University of South Carolina
Scholar Commons
Theses and Dissertations
1-1-2013
Squeeze Flow of Highly Concentrated Suspensions
Mohsen Nikkhoo
University of South Carolina - Columbia
Follow this and additional works at:https://scholarcommons.sc.edu/etd
Part of theChemical Engineering Commons
This Open Access Dissertation is brought to you by Scholar Commons. It has been accepted for inclusion in Theses and Dissertations by an authorized administrator of Scholar Commons. For more information, please [email protected].
Recommended Citation
Nikkhoo, M.(2013).Squeeze Flow of Highly Concentrated Suspensions.(Doctoral dissertation). Retrieved from
S
QUEEZE FLOW OF HIGHLY CONCENTRATED SUSPENSIONS byMohsen Nikkhoo
Bachelor of Science
Sharif University of Technology, 2004
Master of Science
Sharif University of Technology, 2007
Submitted in Partial Fulfillment of the Requirements
For the Degree of Doctor of Philosophy in
Chemical Engineering
College of Engineering and Computing
University of South Carolina
2013
Accepted by:
Francis Gadala-Maria, Major Professor
Jamil Khan, Committee Member
Harry Ploehn, Committee Member
John Weidner, Committee Member
D
EDICATIONThis dissertation is lovingly dedicated to my wife, Anahita. Her support,
A
CKNOWLEDGEMENTSI would like to gratefully and sincerely thank first my advisor, Professor Francis
Gadala-Maria for guiding, teaching, and inspiring the research in this dissertation. I
appreciate all his contributions of time and ideas to make my Ph.D. experience
productive and stimulating.
I would like to thank my committee members, Dr. Harry Ploehn, Dr. Jamil Khan, and Dr.
John Weidner for all their time, attention, and guidance.
Special thanks to my dear wife, Anahita, who was always available with endless support,
unlimited encouragement, and great love. Many thanks to my parents, Nahid and Hassan,
who raised an independent, driven child, and never doubted my abilities. Also, I thank
Anahita’s parents, Aghdas and Akbar, whose love and acceptance allowed me to believe
in myself.
Each and everyone listed above and others who have not been named directly, but whose
friendship remains important to me, deserve my gratitude and my admiration for
A
BSTRACTIn this thesis we investigated through experiment and model, the anomalous
normal stress distribution during constant-force squeeze flow of highly concentrated
suspensions. Using pressure-sensitive films the normal stress distribution is measured in
suspensions of glass spheres in a Newtonian liquid undergoing constant-force squeeze
flow. At volume fractions of solids up to 0.55, the normal stress distribution is
independent of volume fraction and almost identical to the parabolic pressure distribution
expected for Newtonian fluids. However, at higher volume fractions, the normal stresses
become an order of magnitude larger near the center and very low beyond that region. At
these high volume fractions, the normal stresses decrease in the outer regions and
increase in the inner regions as the squeezing proceeds. The normal stress distribution
that results when the glass spheres without any fluid are subjected to squeeze flow is very
similar to that for suspensions with volume fractions above 0.55, suggesting that the
cause for the drastic changes in the normal stress distribution is the jamming of the
particles in the suspension.
The drastic changes in the normal stress distribution are explained in terms of the
radial flow migration of the liquid phase away from the center of the sample and of the
jamming that results from it. Experimental measurements show that changes in the
volume fraction of solids due to liquid-phase migration are found to depend on the initial
volume fraction of solids, the viscosity of the suspending fluid, and the size of the
constant during the squeeze test, indicating that liquid-phase migration does not take
place to any significant degree; however, under other conditions, the volume fraction of
solids increases throughout the sample as the squeezing proceeds and liquid is expelled
from the test region in preference to the solids. In these latter cases the concentration
increases are largest toward the center of the samples. Criteria for the occurrence of
liquid-phase migration in suspensions undergoing squeeze flow are discussed in terms of
dimensionless groups.
Liquid-phase migration is modeled numerically by taking into account the time
and position dependence of the rheological properties of the material due to the change in
the volume fraction of solids. This is done by coupling the equation of motion for a
non-Newtonian material that approximates a Bingham plastic with a continuity equation that
includes diffusive flux. The developed model is first validated with experimental data and
then used to study the effect of various parameters on pressure-induced phase separation.
Changes in the volume fraction of solids within the squeezed suspensions due to
liquid-phase migration were found to depend on the degree of slip at the surfaces and on the
T
ABLE OFC
ONTENTSDEDICATION ... iii
ACKNOWLEDGEMENTS ... iv
ABSTRACT ...v
LIST OF TABLES ... ix
LIST OF FIGURES ...x
CHAPTER 1:INTRODUCTION ...1
CHAPTER 2NORMAL STRESS DISTRIBUTION IN SQUEEZE FLOW OF SUSPENSIONS ...14
2.1BACKGROUND ...14
2.2EXPERIMENTS ...15
2.2.1MATERIALS ...15
2.2.2EQUIPMENT AND PROCEDURE ...18
2.3 RESULTS AND DISCUSSIONS...21
2.4 CONCLUSIONS ...34
CHAPTER 3 LIQUID PHASE MIGRATION IN SQUEEZE FLOW OF SUSPENSIONS ...36
3.1 THEORY OF LIQUID PHASE MIGRATION ...36
3.2 DIMENSIONAL ANALYSIS ...39
3.3EXPERIMENTS ...39
3.3.1MATERIALS ...39
3.3.2EQUIPMENT AND PROCEDURE ...41
3.4.1 EFFECT OF INITIAL SOLID VOLUME FRACTION ...46
3.4.2 EFFECT OF SQUEEZE FORCE AND SQUEEZE TIME ...50
3.4.3 VISUAL OBSERVATION ...54
3.4.4 EFFECT OF PARTICLE SIZE ...57
3.4.5 EFFECT OF SUSPENDING FLUID VISCOSITY ...58
CHAPTER 4 NUMERICAL MODELING OF RADIAL FILTRATION ...62
4.1 THEORY ...62
4.2 BOUNDARY CONDITIONS ...66
4.3EXPERIMENTAL ...67
4.4 RESULTS AND DISCUSSION ...69
CHAPTER 5 CONCLUSION ...90
REFERENCES ...94
L
IST OFT
ABLESTable 3.1 Suspensions used ...40
Table 3.2 Parameters for the data points in Figure 3.14 ...61
Table 4.1 Parameters and results of the simulations ...85
L
IST OFF
IGURESFigure 1.1 Schematic and coordinate system for the squeeze tests ...2
Figure 2.1 Optical micrograph of the glass spheres used in the suspensions ...16
Figure 2.2 Particle size distribution of the glass spheres used in the suspensions...17
Figure 2.3 Schematic of the squeeze test setup...20
Figure 2.4 Normal stress distribution result from scanning pressure-sensitive films ...21
Figure 2.5 Normal stress distribution for Dow Corning 200 Fluid 300,000 cSt squeezed with a constant-force of 13.3 kN for 35 s. The dashed line is the predicted normal stress distribution for a Newtonian fluid...22
Figure 2.6 Images of the pressure-sensitive films used in the squeeze tests of the suspensions of glass spheres in Dow Corning 200 Fluid 300,000 cSt with volume fractions between zero and 0.586. Also shown are the results of squeezing the glass spheres without fluid. The materials were squeezed between a disk and a flat plate with a constant force of 13.3 kN for 35 s...23
Figure 2.7 Normal stress distributions for suspensions of glass spheres in Dow Corning 200 Fluid 300,000 cSt with volume fractions of 0.55 and below squeezed between a disk and a flat plate with a constant force of 13.3 kN for 35 s. The dashed line is the predicted normal stress distribution for a Newtonian fluid ...24
Figure 2.8 Normal stress distributions for suspensions of glass spheres in Dow Corning 200 Fluid 300,000 cSt with volume fractions of 0.572 and 0.586 squeezed between a disk and a flat plate with a constant force of 13.3 kN for 35 s. Also shown is the normal stress distribution for the glass spheres without liquid. The dashed line is the predicted normal stress distribution for a Newtonian fluid ...25
Figure 2.9 The total force on the sample computed by integrating the normal stress distributions of Figures. 2.6 and 2.7 over the area of the disk. The dashed line shows the applied force of 13.3 kN. The label next each data point indicates the volume fraction of the suspension ...26
Figure 2.11 Radii of the concentric circles drawn at the plate surface as a function of time during the slip visualization test for a suspension of glass spheres in Dow Corning 200 Fluid 300,000 cSt with a volume fraction of 0.586 squeezed between a parallel disk and a flat plate with a constant force of 13.3 kN. The curves show the radii of the circles predicted assuming perfect slip at the surface ...29
Figure 2.12 Image of the squeezed suspension of glass spheres in Dow Corning 200 Fluid 300,000 cSt with volume fraction of 0.586 showing a whiter and dryer spot at the center.30
Figure 2.13 Plate separation as a function of time for a suspension of glass spheres in Dow Corning 200 Fluid 300,000 cSt with a volume fraction of 0.586 squeezed between a parallel disk and a flat plate with a constant force of 13.3 kN ...32
Figure 2.14 Comparison of the approach velocity estimated from the data in Figure 2.12 to the critical approach velocity predicted by Eq. (3) for the case of perfect slip on both plates. ...33
Figure 3.1 Measured relative viscosity of suspensions of 74-μm glass spheres in Dow Corning 200 Fluid 300,000 cSt with various different solid volume fraction ...41
Figure 3.2 Schematic of the squeeze test setup...42
Figure 3.3 Measured force as a function of time for suspensions with different initial solid volume fractions of 74-μm glass spheres squeezed with a constant force of 4.45 kN43
Figure 3.4 Diagram and photograph of a suspension after squeezing showing the positions at which samples were taken to measure the solid volume fraction...44
Figure 3.5 Yield stress of suspensions of 74-μm glass spheres in Dow Corning 200 Fluid 300,000 cSt with various solid volume fractions ...45
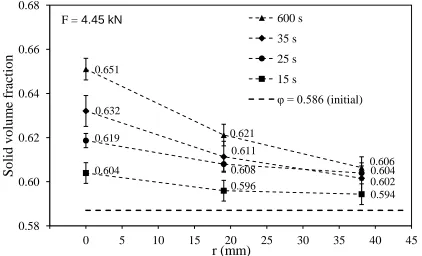
Figure 3.6 (a) Solid volume fraction distributions of suspensions with different initial solid volume fractions of 74-μm glass spheres in Dow Corning 200 Fluid 300,000 cSt squeezed with a constant-force of 4.45 kN from a thickness of 8 mm to a thickness of 1.5 mm (b) Normal stress distributions of suspensions squeezed with a constant force of 13.3 kN for 35 s ...48
Figure 3.7 Plate separation as a function of time and estimated squeeze time (Eq. 15) for suspensions with different initial solid volume fractions of 74-μm glass spheres in Dow Corning 200 Fluid 300,000 cSt squeezed with a constant-force of 4.45 kN ...49
Figure 3.9 Solid volume fraction distributions after various squeezing times for a suspension of 74-μm glass spheres in Dow Corning 200 Fluid 300,000 cSt with an initial volume fraction of 0.586 squeezed with a constant force of 4.45 kN ...53
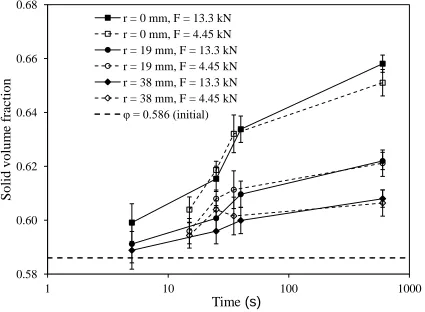
Figure 3.10 The data in Figures. 3.8a and 3.9 plotted as the solid volume fraction as a function of squeeze time at various radial positions. The suspensions consist of 74-μm glass spheres in Dow Corning 200 Fluid 300,000 cSt with a volume fraction of 0.586 squeezed with a constant force of either 4,450 or 13.3 kN ...54
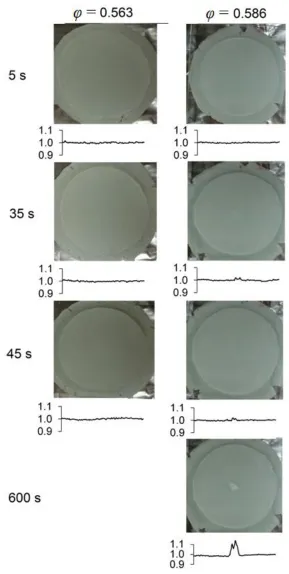
Figure 3.11 Images of suspensions of 74-μm glass spheres in Dow Corning 200 Fluid 300,000 cSt with volume fractions of 0.563 and 0.586 squeezed with a constant-force of 4.45 kN for different periods of time. Also shown are plots of the relative gray level along a horizontal strip passing through the center of the samples ...56
Figure 3.12 Solid volume fraction distributions of suspensions of 74-μm glass spheres and 275-μm PMMA spheres in silicone oil, μ = 1.00 Pa·s, squeezed with a constant-force of 4.45 kN from a thickness of 8 mm to a thickness of 2 mm ...57
Figure 3.13 Solid volume fraction distributions of suspensions of 74-μm glass spheres with an initial volume fraction of 0.595 in three fluids of different viscosities squeezed with a constant-force of 4.45 kN from a thickness of 8 mm to a thickness of 2 mm ...59
Figure 3.14 Fractional changes in the solid volume fraction at the center of the sample after squeeze flow for suspensions with different filterability numbers. The parameters for each data point are given in Table 3.2. ...60
Figure 4.1 Measured relative viscosity of suspensions with different solid volume fractions...64
Figure 4.2 Finite-element mesh used to model the squeeze flow ...66
Figure 4.3 Nomenclature for the coordinates and boundaries ...67
Figure 4.4 Comparison of the thickness of the sample as a function of time predicted by our numerical model to the analytical solution by Laun et al. (1999) of a Newtonian fluid with a viscosity of 1000 Pa·s, squeezed for 1 s with a constant force of 50 N between two parallel disks with a radius of 44.45 mm ...70
Figure 4.5 Comparison of the pressure profile predicted by our numerical model to the analytical solution by Laun et al. (1999) of a Newtonian fluid with a viscosity of 1000 Pa·s, squeezed for 1 s with a constant force of 50 N ...71
Figure 4.7 Comparison of the measured gap as a function of time with the prediction of model for suspensions with different initial solid volume fractions of 74-μm glass spheres in Dow Corning 200 Fluid 300,000 cSt squeezed with a constant force of 4,450 N ...73
Figure 4.8 Experimental and model prediction of the solid volume fraction distributions of suspensions with different initial solid volume fractions of 74-μm glass spheres in Dow Corning 200 Fluid 300,000 cSt squeezed with a constant force of 4,450 N ...74
Figure 4.9 Experimental and model prediction of the solid volume fraction distributions after various squeezing times for a suspension of 74-μm glass spheres in Dow Corning 200 Fluid 300,000 cSt with a volume fraction of 0.586 squeezed with a constant force of 4,450 N ...75
Figure 4.10 Experimental and model prediction of the solid volume fraction distributions of suspensions of 74-μm glass spheres in three different suspending fluids squeezed with a constant-force of 4,450 N from a thickness of 8 mm to a thickness of 2 mm ...76
Figure 4.11 Model prediction of the solid volume fraction distributions of suspensions with different yield stress and φ = 0.560 of 74-μm glass spheres in a Newtonian fluid with μ = 50 Pa·s squeezed with a constant force of 4,000 N from thickness of 8 to 1 mm78
Figure 4.12 Model prediction of the radial velocity profile at h = 0.5 mm of suspensions used in Figure 4.7 after 5 s squeeze time ...79
Figure 4.13 Model prediction of changing the boundary of the unyielded region around the center of the lower plate versus time for a suspension with φ = 0.560 and 0= 100 Pa squeezed at constant velocity of 2 mm/s...80
Figure 4.14 Model prediction of solid volume fraction profile for the suspension with φ = 0.560 and τ0= 50 Pa squeezed with a constant force of 4,000 N from thickness of 8 to 1 mm of 74-μm glass spheres in a Newtonian fluid with μ = 50 Pa·s ...81
Figure 4.15 Model prediction of solid volume fraction profile for a suspension with φ = 0.560 and 50 Pa yield stress of 74-μm glass spheres in a Newtonian fluid with μ = 50 Pa·s squeezed with different constant force from thickness of 15 to 1 mm ...82
Figure 4.16 Model prediction of solid volume fraction profile for a suspension with φ = 0.560 and 50 Pa yield stress of 74-μm glass spheres in a Newtonian fluid with μ = 50 Pa·s squeezed with different constant force from thickness of 15 to 2 mm ...83
Figure 4.17 Model predictions of the effect of initial solid volume fraction on fractional changes in solid volume fraction ...86
Figure 4.19 Model predictions of the effect of suspending fluid viscosity on fractional changes in solid volume fraction ...88
Figure 4.20 Comparison of model predictions to measured fractional changes in solid volume fraction for a suspension with φ = 0.586 for squeeze times of 5, 25, and 40 s with a squeeze force of 13.3 kN, and for squeeze times of 15, 25, and 35 s with a squeeze force of 4.45 kN. ...89
Figure A.1 Calibration Curve for RH=34.8% at 15s and 5s Press Time ...100
CHAPTER
1
I
NTRODUCTIONSuspensions of solid particles in liquids are ubiquitous in industry and nature. The
rheological characterization of highly concentrated suspensions and pastes is useful in
predicting the processing characteristics of solder pastes, concrete, paving asphalt, bulk
molding compounds, ceramic pastes, and other industrial materials. Sometimes, the final
product itself is a concentrated suspension or paste, and its rheological characteristics
affect its performance. Such is the case for tooth paste, diaper cream, modeling clay, etc.
The rheological behavior of these suspensions depends on the particle shape, size and
size distribution, volume fraction of particles, particle-particle and particle-fluid
interactions, and measurement conditions such as temperature and shear rate (Gulmus
and Yilmazer 2005).
The multi-phase nature of highly concentrated suspensions gives rise to complex
rheological behavior as a result of particle contacts, jamming, liquid-phase migration, and
shear localization (Mascia and Wilson 2007). The heterogeneities and anisotropy induced
by the flow may affect the mechanical, thermal, and electrical properties of the final
product (Collomb et al. 2004).
Rotational viscometers are, in general, inadequate to characterize these materials,
mainly because of slip at the surfaces and exudation of the sample during testing.
Squeeze flow, one of the few tests capable of generating useful rheological data for these
two surfaces approaching each other at either a controlled velocity or under the influence
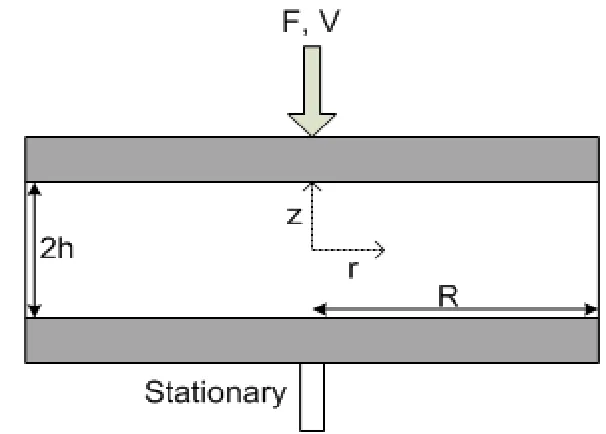
of a controlled force. Figure 1.1 presents a schematic and the coordinate system for our
squeeze flow tests. We denote the distance between the plates by H and the half-distance
by h and use a coordinate system with the origin of the z-axis placed at the symmetry
plane.
Figure 1.1 Schematic and coordinate system for the squeeze tests
The review paper by Engmann et al. (2005) summarizes the various aspects of squeeze
flow rheometry. When highly concentrated suspensions are subjected to constant-velocity
squeeze flow two main flow regimes can be identified (see, for example, Delhaye et al.
2000). In the first regime, when the surfaces approach each other at relatively high
velocities, the suspension remains fairly homogeneous as it squeezed, and the applied
force at a given gap increases with increasing approach velocity. In the second regime,
the fluid filters through the particle network as the material is squeezed, and the applied
force at a given gap decreases with increasing approach velocity. Two regimes are also
squeeze force (Meeten 2007). Sherwood (2002) used the relation describing the uniaxial
compaction of suspensions in the lubrication analysis of the squeeze flow of a plastic
material with slip at the walls. He thus derived the governing equations for the solid
content within the suspension as a function of time and radial position. These equations
predict that if the squeeze velocity is sufficiently small, the solid volume fraction within
the suspension will be non-uniform, with higher volume fractions near the axis of plates.
A constitutive model by Poitou and Racineux (2001) compares the time scale of the
deformation of the suspension to the time scale of the filtration, due to a pressure
gradient, of the liquid phase through the solid particle network. At high squeeze
velocities the deformation time scale is much smaller than the filtration time scale, and
filtration is not important; on the other hand, at low squeeze velocities the opposite is
true, and filtration cannot be neglected. This model has been used to describe the
rheological behavior of ceramic pastes (Poitou and Racineux 2001), sewage sludge
(Chaari et al. 2003), and suspensions of hard spheres in Newtonian fluids (Delhaye et al.
2000) and shear thinning fluids (Collomb et al. 2004). When low approach velocities are
used, the concentration of solids in the squeezed samples is larger towards the center of
the plate; in some cases (Poitou and Racineux 2001) the material at the center is
obviously drier than the rest. Roussel and Lanos (2004) studied squeeze flow of dense
clay suspension and proposed a model that allows prediction of the solid volume fraction
through the squeeze test in terms of the sample’s rheological parameters but in their
model the average permeability and the yield stress value are not depending upon the
Boundary conditions also play an important role in squeeze flow because, unless there
is perfect slip at the plates, the shear stress at the surface is transmitted to the bulk of the
sample. Achieving perfect-slip boundary conditions for any material is very difficult in
experiments (Meeten 2004) although Mascia and Wilson (2007) studied purely biaxial
extensional strain by using Teflon to eliminate the friction from the plates together and by
using large initial sample height (the initial gap was the same order of magnitude as the
radius of the plate). They also found that the effect of lubricating the plates was
negligible at large sample heights and the difference was only apparent at heights below
40% of the initial height. Experiments by Estellé et al. (2006) with smaller initial height
showed that the squeeze flow boundary condition is divided into two zones: a small
circular central zone where the sample sticks to the plates, and the region beyond that
zone, where friction causes the sample to partially slip at the plates. Smyrnaios and
Tsamopoulos (2001) showed that when a Bingham plastic undergoes squeeze flow
between parallel disks approaching each other at a constant velocity, there is a region
around the center of each plate that undergoes no deformation. The unyielded region on
the top plate does not connect with the unyielded region on the bottom plate. As the
plates approach each other these unyielded regions become smaller. Previously, for the
same setup, O’Donovan and Tanner (1984) had shown that regions of almost unyielded
material would be expected around the flow stagnation points (the centers of the top and
bottom plates) for a material that approximates a Bingham plastic by having a very large
viscosity at low shear rates and a shear stress that varies linearly with shear rate at larger
Navier and Sur (1827) first proposed a partial slip condition by relating the tangential
velocity (slip velocity) to the local tangential shear stress for rough surfaces. If the shear
viscosity of the fluid comprising the apparent slip is Newtonian then the relation between
slip velocity and shear stress is linear. Laun et al. (1999) provided analytical solution for
squeeze flow of Newtonian and power-law fluids by using the lubrication approximation
and partial wall slip which slip velocity increases linearly with radial position. For yield
stress materials, the tangential stress at the interfaces is usually assumed to be constant
and is expressed as a fraction of the yield stress of the material (Engmann et. al 2005).
Sherwood and Durban (1998) provided analytical solution for Herschel-Bulkley material
by using this method.
Using a grid array of miniature pressure sensors distributed over the face of one of the
plates, Yates et al. (2001) measured the pressure profile in a Newtonian fluid and in some
food pastes undergoing the constant-velocity squeeze flow. The results for the Newtonian
fluid were in good agreement with the theoretical predictions and the data for the pastes
was fitted to the predictions for pseudoplastic fluids.
The relation between applied velocity and force in squeeze flow for most types of
homogeneous materials has been studied before (see, for example, the review paper by
Engmann et al. 2005), but any model which takes into account liquid-phase migration is
necessarily more complicated than those that assume the test material is homogeneous.
Lipscomb and Denn (1984), using the constitutive equation for a Bingham plastic and
assuming no slip at surfaces, showed that on the central plane (between the two
approaching surfaces) the shear stress is zero and predicted unyielded material in that
extensional straining of the material in the central plane. There is, therefore, an
inconsistency in their analysis. Sherwood and Durban (1996 and 1998) resolved this
inconsistency by the adoption of a constant shear stress as a boundary condition at the
wall.
Sherwood (2002) used the relation describing the uniaxial compaction of suspensions
when applying lubrication theory to the squeeze flow of a Herschel-Bulkley material
between parallel disks with slip at the walls. He thus derived the governing equations for
the solid content within the suspension as a function of time and radial position.
For a Herschel-Bulkley material, Chan and Baird (2002) estimated that the error
involved in the lubrication approximation could be large when the ratio of the distance
between two plates to the radius of plate is large, so that numerical calculation is needed
for a general case.
O’Donovan and Tanner (1984) and Smyrnaios and Tsamopoulos (2001) predicted
numerically that when a Bingham plastic undergoes squeeze flow between parallel disks
approaching each other at a constant velocity, there is a region at the center of each disk
that undergoes no deformation. The unyielded region on the top disk does not connect
with the unyielded region on the bottom disk. They approximated the behavior of the
Bingham plastic with that of a material with a very high viscosity at low shear rates and a
linear dependence of shear stress on shear rate at higher shear rates. Yang and Zhu (2006)
used the same approximation and assumed a linear relation between shear stress and slip
velocity at the wall to obtain analytical solutions of the velocity profile for a Bingham
Kaci et al. (2011) observed during the constant-velocity squeeze flow of a highly
concentrated suspension that the squeeze force as a function of the gap between the plates
becomes almost independent of the velocity below a certain gap size. They believed that
they had reached a transition to solid-like behavior and that the slope of the force curves
provided the elastic modulus of the granular skeleton.
Depending on the industrial application, it is sometimes important to either hinder or
promote liquid-phase migration. Phase separation in constant-velocity squeeze flow has
been investigated in ceramic pastes (Poitou and Racineux 2001), clay (Roussel and Lanos
2004), sewage sludge (Chaari et al. 2003), suspensions of hard spheres in Newtonian
fluids (Delhaye et al. 2000), suspensions of hard spheres in shear thinning fluids
(Collomb et al. 2004), and highly concentrated microcrystalline cellulose suspensions
(Mascia and Wilson 2007). Mascia and Wilson (2008) proposed a modified
Herschel-Bulkley model for constant-velocity squeeze flow with perfect slip at the surfaces. They
also observed liquid-phase migration at slow approach velocities.
Delhaye et al. (2000) argued that the concentration heterogeneity cannot be attributed
to the well studied shear-induced particle migration in non-homogeneous shear flow
(Leighton and Acrivos 1987) because shear-induced migration is a diffusive phenomenon
that occurs on time scales much larger than those involved in typical squeeze flow
experiments.
Ramachandran and Leighton (2010) studied the constant-volume squeeze flow of a
concentrated suspension between two parallel disks. Under certain conditions, they
observed the formation of a highly packed layer of particles at the advancing front of the
They attributed the accumulation of particles at the advancing front to shear-induced
migration (Leighton and Acrivos 1987) and developed criteria to predict when this
phenomenon would occur. Using their criteria, this effect should be absent from our
experiments even if they had been performed at constant volume. In constant-area
squeeze flow, the method we used in our measurements, there is no advancing front
because the gap between the plates is always full and suspension is being expelled from
the edge as the disks approach one another. Therefore, we expect that the phenomenon
observed by Ramachandran and Leighton did not affect our experiments.
Meeten (2007) investigated the behavior of several soft solids undergoing
constant-force squeeze flow. His results showed that samples that readily lost liquid when placed
on filter paper also deviated from the behavior predicted for Herschel-Bulkley materials.
He attributed the deviation to the radial filtration of the liquid during the squeeze flow. A
few milliliters of the material held in a cylindrical tube of radius a, were placed in contact
with filter paper of thickness, porosity. Capillary suction drew the liquid out of the
material and the radius of the wetting front was measured as a function of time. Patel et
al. (2007) verified the existence of liquid-phase migration experimentally and developed
a model that predicted this phenomenon for highly concentrated suspensions of glass
spheres in Newtonian fluid undergoing extrusion.
According to Meeten and Smeulders (1995) the desorptivity is proportional to the
square root of the ratio of the permeability of the material’s solid matrix to the viscosity
of the liquid. Meeten (2007) found that materials for which porosity is larger than 2
μm·s-1/2
deviated from the behavior predicted for Herschel-Bulkley materials and thus
criterion for the prediction of liquid-phase migration in squeeze flow does not account for
the possible effect of the squeezing conditions. For example, for constant-force squeeze
flow, a material may exhibit liquid-phase migration when squeezed with a small force but
not when squeezed with a large force. Similarly, under constant-velocity squeeze flow, a
material may exhibit liquid-phase migration when squeezed slowly but not when
squeezed rapidly.
Yield stress is another phenomena commonly observed in highly concentrated
suspensions (Barnes 1999). Heymann et al. (2002) present evidence for an elastic
component of deformation at high particle concentrations and conclude that, at low shear
stress, particles interact as an elastic network, which breaks up when the yield stress is
reached. They found that the yield stress is a function of the particle volume fraction and
is larger for smaller spheres because of the greater density of particle-particle
interactions, which gives rise to a more robust particle network. They found that the
network deforms elastically in response to an applied stress, which is transmitted through
the network via direct particle-particle contact. The yield stress is reached when the
applied stress is sufficient to cause the network to break up, beyond which point the
suspension flows. It appeared that by carefully controlling the experimental conditions of
the squeeze test one can obtain yield stress values that agree with the common
rheological measurements (Rabideau et al. 2009).
As the solid volume fraction of a concentrated suspension approaches its maximum
value, the rheology changes from Newtonian to pseudo-plastic behavior (Mueller et al.
2010). Moreover, potential of the particle migration (see for example Leighton and
complicated. Therefore, a numerical modeling that takes into account time and position
dependence of the rheological properties of the material is needed.
Mascia and Wilson (2008) performed a constant-velocity squeeze flow of highly
concentrated suspension of glass powder in Newtonian liquid between lubricated plates.
Measuring solid content showed uniform radial concentration of solid at high squeeze
velocity and non-uniform solid profile at low squeeze velocity. Kaci et al. (2011)
reported an experimental study of concentrated suspension undergoing constant-force
squeeze flow. By measuring the squeeze forces at constant velocity versus the sample
thickness, they concluded that the suspension experiences squeeze-induced
heterogeneities, and eventually jamming under certain conditions. Liquid-phase
migration have also reported in cement-based materials (Toutou et al. 2005),
microcrystalline cellulose pastes (Mascia et al. 2006), sewage sludge (Chaari et al. 2003),
titanium oxide particle in an acidic binder (Poitou and Racineux 2001), and clay (Roussel
and Lanos 2004) at constant-velocity slow squeezing and for soft solids (Meeten 2007) at
constant-force squeeze flow.
Suspensions can be studied from a microscopic or macroscopic pinot of view (Ritz et
al. 2000). In the microscopic, or particle-based, point of view, despite the limitation in the
amount of computing, the characterization of interactions appearing at the scale of
particles can applied to describe flow behavior in the scale of suspension. On the other
hand, macroscopic approach considers the suspension as a continuum phase modeled
through a rheological law which is a function of the local values of macroscopic
In most studies on the squeeze flow, the tested material is assumed to remain
homogeneous through the test although there is evidence that complex materials like
suspensions became heterogeneous when undergoing squeeze flow. Poitou and Racineux
(2001) showed that in a constant-velocity squeezing flow of suspensions, liquid-phase
migration occurs in the suspension as long as the squeeze velocity does not exceed a
critical value. Roussel and Lanos (2004) proposed a simplified model in order to take into
account the drainage of water during the constant-velocity squeezing the clay. Their
results showed that the heterogeneity is induced by slow compression and their model
predicted of the average void ratio evolution through the squeeze test in terms of
parameters that can be identified on high speed squeezing test.
Boundary conditions also play an important role in the squeeze flow of suspensions.
Meeten (2004) experimental study on Newtonian fluids and soft solids showed that
achieving perfect-slip boundary conditions for any material is very difficult. On the other
hand, achieving perfect no-slip boundary condition is difficult for highly concentrated
suspensions too because the local particle concentration of the suspension is depleted at a
boundary such that the suspension’s rheological properties differ from those in the bulk
then apparent wall slip may occur (Barnes 1995). Gulmus and Yilmazer (2005) observed
that as the volume fraction of particles increased, the wall slip velocity increased and as
the particle size increased, the wall slip velocity decreased. Navier and Sur (1827) first
proposed a partial slip condition by relating the slip velocity to the local tangential shear
stress for rough surfaces. If the shear viscosity of the fluid comprising the apparent slip is
Newtonian then the relation between slip velocity and shear stress is linear. Laun et al.
fluids by using the lubrication approximation and partial wall slip which slip velocity
increases linearly with the radial position. For materials with yield stress, the tangential
stress at the interfaces is usually assumed to be constant and is expressed as a fraction of
the yield stress of the material (Engmann 2005). Sherwood and Durban (1998) provided
an analytical solution for Herschel-Bulkley materials by using this method. Slip tests on
suspensions with high concentrations showed that the squeeze flow boundary condition is
not uniform and the boundary condition on the surface of the plates was intermediate
between perfect slip and no slip and slip at the surfaces promoted by increasing the solid
volume fraction. Slip can affect the liquid phase migration in squeeze flow of
suspensions; theoretical work by Ayadi (2011) on the squeeze flow of Bingham plastics
showed that the radial pressure gradient increases when there is no slip at the plates, and
this boosts the liquid filtration process.
In this thesis we investigated through experiment and model, the normal stress
distribution during constant-force squeeze flow of highly concentrated suspensions. In
chapter 2, the results of using pressure-sensitive films to measure the normal stress
distribution in suspensions of glass spheres in a Newtonian liquid are presented. In order
to validate the use of the pressure-sensitive films, the normal stress distribution for a
Newtonian fluid was measured and compared to the theoretical predictions. The changes
in the normal stress distribution were also investigated as the squeezing proceeded by
changing the pressure-sensitive film.
In chapter 3, the results of measuring the solid volume fraction distribution throughout
the suspension undergoing the squeeze flow are presented. The influence of rheological
occurrence of liquid-phase migration in suspensions undergoing squeeze flow are
discussed in terms of dimensionless groups.
In chapter 4, the result of developing a model to predict the behavior of highly
concentrated suspensions in squeeze flow is introduced. We compare the model’s
predictions with our previous experimental results on the constant-force squeeze flow of
highly concentrated suspensions. The model is then used to study the effect of process
parameters (such as slip and applied force) and material properties (such as the viscosity
of the suspending fluid, the yield stress, and the particle size) on the migration of the
CHAPTER
2
N
ORMAL STRESS DISTRIBUTION IN SQUEEZE FLOW OF SUSPENSIONS2.1.
Background
According to Bird et al. (2002), the radial distribution of the normal stress in a
Newtonian fluid undergoing squeeze flow in the filled gap between a stationary and a
moving disk with no slip at surfaces is given by:
2 2
3 8 3
r R h
V patm
zz
(2.1)
where the quantity on the left is the normal stress acting on the plate (patm is the
atmospheric pressure acting on the other side of the plate, and τzz is the relevant
component of the deviatoric stress tensor minus the pressure in the fluid), μ is the
viscosity of the fluid, V is the velocity of the moving disk, h is the half of gap between
the disks, R is the radius of the disks, and r is the radial position in cylindrical
coordinates. This relation clearly shows that for a Newtonian fluid we should expect to
see a quadratic normal stress on the surface of the plates that becomes equal to the
atmospheric pressure at the edge. Equation 2.1 is derived by assuming lubrication
approximation (h<<R). The more general form of this equation without this assumption is
2 2 2
4 2
2
z r R R
F patm
zz
Equation 2.1 can be integrated to obtain the total force acting on the plate:
3 4
8 3
h VR
F (2.3)
Using Eq. 2.1 the following expression is obtained for the normal stress on the surface
of the plate:
2 2
42
r R R
F patm
zz
(2.4)
Since Eq. 2.4 was derived assuming a quasi steady state, it applies to squeeze flow
with constant velocity, V, as well as with constant force, F. In the latter case, it is
interesting to note that the normal stress distribution on the plate is independent of the
viscosity of the fluid, the gap between the plates, and the velocity at which the plates
approach one another. Since the weight of the sample undergoing the squeeze test is
small compared to the other forces involved, the normal stresses at the top and bottom
plate have the same values.
2.2.
Experiments
2.2.1.
MaterialsSuspensions of various concentrations were prepared by mixing glass spheres into a
silicone oil. The glass spheres (manufactured by Cataphote Inc., Jackson, MS) were
sieved in order to isolate those between 75 and 90 microns (between 200 and 170 mesh).
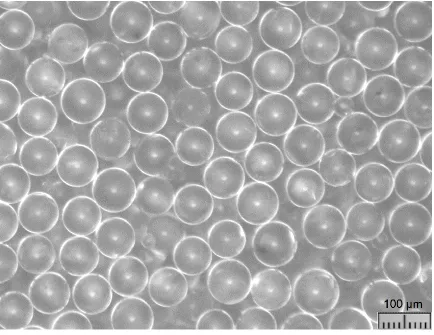
Figure 2.1 Optical micrograph of the glass spheres used in the suspensions
The particle size distribution, shown in Figure 2.2, was obtained with a single-particle
optical sizer (Accusizer Model 780, Particle Sizing Systems, Santa Barbara, CA). The
number-average diameter of the glass spheres was 74 μm. A considerable number of
smaller spheres did not go through the finer sieve and some doublets were able to go
through the coarser sieve. The density of the glass spheres was determined to be 2,730
kg/m3 using a pycnometer and water. The suspending fluid was Dow Corning 200 Fluid
300,000 cSt (Dow Corning Corp., Midland, MI). Its viscosity at 22°C (the temperature
near which all experiments were conducted), measured with a Rheometrics Fluid
Spectrometer RFS II, was constant at 327.5 Pa·s at all shear rates applied (0.05 s-1 to 8.0
Figure 2.2 Particle size distribution of the glass spheres used in the suspensions
Suspensions were prepared with weight percent of solids of 20%, 60%, 70%, 75%,
77.5%, 79%, and 80%, which correspond to volume fractions of solids of 0.082, 0.348,
0.516, 0.550, 0.572, and 0.586, respectively. The glass spheres were thoroughly mixed
into the fluid using a spatula. Most of the air entrained during the mixing process was
removed by placing the suspensions in a vacuum chamber for periods up to two hours
depending on concentration. Upon removal from the vacuum chamber, the suspensions
were lightly stirred to ensure uniformity while trying to avoid the entrainment of any air.
Although the particles were much denser than the fluid, the fluid was viscous enough that
no settling was apparent for periods of several hours, more than ample time for the
completion of a typical squeeze flow experiment. Delhaye et al. (2000) estimates the 0
5 10 15 20 25 30 35 40
0 25 50 75 100 125 150 175
Percen
tag
e
b
y
n
u
m
b
er
sedimentation time of a sphere in a suspension, tsed, that is, the time required for a sphere
to fall a distance equivalent to its diameter, as follows
55 . 6 ) 1 ( ) (
18
φ gD ρ ρ
μ t
f s
sed
, (2.5)
where μ is the viscosity of the fluid, ρs is the density of the spheres, ρf is the density of the
suspending fluid, g is the acceleration due to gravity, D is the diameter of the sphere, and
φ is the volume fraction. For our spheres and fluid, in our most dilute suspension (φ =
0.082), the largest particles present (D = 165 μm), would have a sedimentation time of
3600 s (1.0 h), which is much longer than the duration of the squeeze tests. Therefore, the
sedimentation of the particles during the tests was neglected.
2.2.2.
Equipment and procedure
The suspensions were squeezed between a circular stainless-steel disk, 3.50 in. (88.9
mm) in diameter, and a large flat steel plate in a 12-ton hydraulic press ordered from
Technical Machine Products, Cleveland, OH to our specifications. The circular disk and
the plate were covered with stainless steel foil, soft temper, type 304, 0.002-in. (0.051
mm) thick (McMaster-Carr Supply Company, Elmhurst, IL). In all experiments we
applied a constant force of 1.5 short tons (13.3 kN) to the suspensions. It is worth noting
that the bottom plate, on which the disk rested, approaches the stationary top plate at a
relatively high constant velocity until the required force reaches the set point. After that,
the force remains constant and the approach velocity changes with time in a way
determined by the properties of the sample. We used a closing speed of 50 mm/s (the
total duration of the experiment. In a typical experiment, the initial sample height was 18
mm and the force reached its desired value when the sample height had been reduced to
about 4 mm. At a closing speed of 50 mm/s, this takes place after about 0.28 s. This
period of time is about one hundredth of the total duration of a typical experiment (about
35 s). The disk (resting on the bottom plate) and the top plate were covered with stainless
steel foil, and, without a sample between them, were pressed together to flatten the
stainless steel foil. The pressure-sensitive films were then placed between the disk and its
stainless steel foil. Since the normal stress distribution was radially symmetric, it was
enough to measure it on a one-centimeter-wide strip of pressure-sensitive film passing
through the axis of the disk. Previously-used pressure-sensitive film of the same
thickness was placed on either side of the strip to provide the same thickness throughout.
Finally, the sample was placed between the stainless steel foils and squeezed by raising
the lower plate of the hydraulic press towards the top plate. The setup is shown in Figure
2.3.
used Pressure-X pressure-sensitive films (Sensor Products Inc., Madison, NJ) to
determine the normal stress distribution. These polymer films contain red pigment in
micro-capsules which rupture when subjected to pressure. The intensity of the red color
that results when the films are pressed increases with the magnitude of the applied
pressure. The intensity of the red color of a film already exposed to a moderate pressure
increases when the film is exposed to a higher pressure, but it does not decrease when the
film is exposed to a lower pressure. The redness of the film thus reflects the highest
pressure the film has experienced during a test. In order to convert the intensity of the red
of the film. We then obtained a bitmap color image of the film on a scanner and
determined the average intensity of the pixels in that area using the Matlab image
analysis toolbox (The MathWorks, Inc., Natick, MA). Temperature and humidity as well
as the time of exposure influence the color intensity of the pressure-sensitive films.
Therefore, to minimize error, we kept the conditions in our experiments close to the
conditions at which the films were calibrated. The estimated error in measuring the
normal stresses using the sensitive films is about 10%. Three different
pressure-sensitive films: medium 1400-7100 psi (9700-49000 kPa), low 350-1400 psi (2400-9700
kPa), and super low 70-350 psi (480-2400 kPa) were used in our experiments. The
procedure of pressure sensitive films calibration and use is explained in detail in
appendix A.
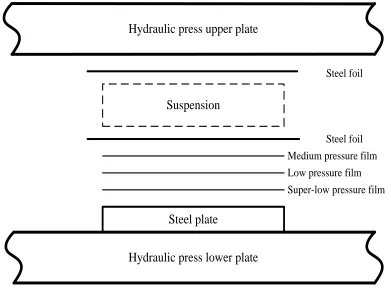
Steel plate Suspension
Steel foil
Steel foil Medium pressure film Low pressure film Super-low pressure film
Hydraulic press upper plate
Hydraulic press lower plate
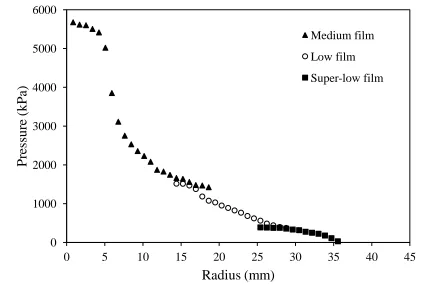
We Each suspension was squeezed for 35 s and the resulting films were analyzed.
Figure 2.4 shows the result of measuring normal stress distribution using this method. As
described below, one of the tests on the suspension with a volume fraction of 0.586 (80
wt%), was interrupted at regular intervals in order to replace the pressure-sensitive films
to determine how the normal stress profile changed during the squeeze test.
Figure 2.4 Normal stress distribution result from scanning pressure-sensitive films
2.3.
Results and Discussions
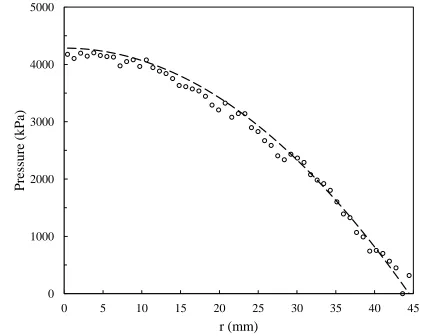
In order to test the technique for measuring the normal stress distribution with the
pressure-sensitive films, the Newtonian Dow Corning fluid was subjected to squeeze
flow and the resulting pressure distribution was compared to Eq. 2.4. Figure 2.5 shows 0
1000 2000 3000 4000 5000 6000
0 5 10 15 20 25 30 35 40 45
Pres
su
re
(k
Pa)
Radius (mm)
Medium film
Low film
that the results for the Dow Corning fluid, using a force of 13.3 kN, are in close
agreement with the predictions.
Figure 2.5 Normal stress distribution for Dow Corning 200 Fluid 300,000 cSt squeezed with a constant-force of 13.3 kN for 35 s. The dashed line is the predicted normal stress distribution for a Newtonian fluid
Figure 2.6 shows the appearance of the three different types of pressure-sensitive film
after the Dow Corning suspending fluid and the suspensions were subjected to squeeze
flow under a constant force of 13.3 kN for 35 s. The impressions on the film are very
similar for the pure fluid and for suspensions with volume fractions below 0.55. The
impressions on the films for the suspension with volume fraction of 0.550 differ
somewhat from those only in the outermost region. The normal stress at the center of disk 0
1000 2000 3000 4000 5000
0 5 10 15 20 25 30 35 40 45
Pres
su
re
(k
Pa)
for the two suspensions with volume fraction above 0.55 is much higher than for the less
concentrated suspensions and reaches the range of the pressure of the medium film. Also,
the width of red color on the super-low and low pressure-sensitive films decreases for
these two suspensions which means that qualitatively the maximum pressure at the center
for the highest volume fraction suspensions increases while the area on which the normal
stress is felt decreases.
Figure 2.6 Images of the pressure-sensitive films used in the squeeze tests of the suspensions of glass spheres in Dow Corning 200 Fluid 300,000 cSt with volume fractions between zero and 0.586. Also shown are the results of squeezing the glass spheres without fluid. The materials were squeezed between a disk and a flat plate with a constant force of 13.3 kN for 35 s.
the applicable range. Each curve represents a single run, but combines measurements
from pressure-sensitive films of various sensitivities; this and the error inherent in the
technique contribute to the waviness of some of the curves. In both Figures the prediction
for Newtonian fluids is presented for comparison. The suspensions with volume fractions
up to 0.55 have normal stress profiles very similar to that for Newtonian fluids. On the
other hand, the suspensions with higher volume fraction have normal stress profiles with
a prominent region in the middle of the disk in which the normal stress is much higher
than that predicted for Newtonian fluids.
Figure 2.7 Normal stress distributions for suspensions of glass spheres in Dow Corning 200 Fluid 300,000 cSt with volume fractions of 0.55 and below squeezed between a disk and a flat plate with a constant force of 13.3 kN for 35 s. The dashed line is the predicted normal stress distribution for a Newtonian fluid
0 1000 2000 3000 4000 5000
0 5 10 15 20 25 30 35 40 45
N
o
rm
al
st
res
s
(k
Pa)
r (mm)
0.5500.516
0.453
0.348
0.082
The normal stress profile for the glass spheres without liquid, also shown in Figure
2.8, is very similar to those for the suspensions with volume fraction above 0.55.
Figure 2.8 Normal stress distributions for suspensions of glass spheres in Dow Corning 200 Fluid 300,000 cSt with volume fractions of 0.572 and 0.586 squeezed between a disk and a flat plate with a constant force of 13.3 kN for 35 s. Also shown is the normal stress distribution for the glass spheres without liquid. The dashed line is the predicted normal stress distribution for a Newtonian fluid
Figure 2.9 plots the total force computed by integrating the pressure profiles of
Figures. 2.7 and 2.8 over the area of the disk. For volume fractions less than 0.586, the
calculated total force is within 15% of the applied force. On the other hand, for the
suspensions with a volume fraction of 0.586 the total calculated force is considerably
higher than the applied force. As will be explained below, this discrepancy is due to the 0
5000 10000 15000 20000 25000 30000 35000 40000 45000
0 5 10 15 20 25 30 35 40 45
N
o
rm
al
st
res
s
(k
Pa)
r (mm)
Glass spheres without liquid
0.586 Run I
0.586 Run II
0.572 Run I
0.572 Run II
fact that, at this volume fraction, the pressure profile changes during the constant-force
squeezing process. Since the pressure-sensitive films do not recover their original color
once they have been subjected to pressure, they accumulate the effect of pressure changes
during the experiment.
Figure 2.9 The total force on the sample computed by integrating the normal stress distributions of Figures. 2.6 and 2.7 over the area of the disk. The dashed line shows the applied force of 13.3 kN. The label next each data point indicates the volume fraction of the suspension
In order to investigate the “pressure accumulation” effect, we measured the normal
stress profile at different times during the squeezing of the suspension with a volume
fraction of 0.586. Two sets of pressure-sensitive films were used in this measurement.
The first set remained for the entire experiment (0 to 40 s); the second set was replaced at 0
5000 10000 15000 20000 25000 30000
0.0 0.1 0.2 0.3 0.4 0.5 0.6 0.7 0.8
Co
m
p
u
ted
t
o
tal
fo
rce
(N
)
Solid volume fraction
0.586 Run I 0.586 Run II
0.572 Run I
0.572 Run II 0.550
0.516 0.453 0.348
0.082
various intervals, and the squeezing was then resumed. The results are shown in Figure
2.10. In the central region (r < 5 mm), the normal stress increases dramatically after the
first three seconds of squeezing, whereas in the middle region (5 mm < r < 15 mm), the
normal stress decreases.
Figure 2.10 Normal stress distributions at various times in a suspension of glass spheres in Dow Corning 200 Fluid 300,000 cSt with a volume fraction of 0.586 squeezed between a parallel disk and a flat plate with a constant force of 13.3 kN
The highest normal stress experienced at each position is close to that of the normal
stress distribution measured by the set of pressure-sensitive films that remained for the
entire experiment (0 to 40 s). The curve made up from the highest normal stress at each 0
10000 20000 30000 40000 50000 60000 70000
0 5 10 15 20 25 30 35 40 45
N
o
rm
al
st
res
s
( kPa)
r (mm)
0-40 s
8-23 s
3-8 s
position is higher than any of the curves for partial squeezing, thus explaining the higher
apparent force calculated when the normal stresses are integrated.
In order to determine whether or not there was slip at the wall, we used a transparent
Plexiglas disk and plate in one experiment. We drew concentric circles of various radii
(after Estellé et al. 2006 and Mascia and Wilson 2007 and 2008) with a felt-tip marker on
a suspension with a volume fraction of 0.586 and subjected it to squeeze flow. We
interrupted the experiment at various times and photographed the suspension through the
transparent plate to measure the change in the radii of the circles. Figure 2.11 shows as
data points the radii of the drawn circles at various times, and as curves, their radii if
there had been perfect slip at the surface. The results indicate neither perfect slip nor no
Figure 2.11 Radii of the concentric circles drawn at the plate surface as a function of time during the slip visualization test for a suspension of glass spheres in Dow Corning 200 Fluid 300,000 cSt with a volume fraction of 0.586 squeezed between a parallel disk and a flat plate with a constant force of 13.3 kN. The curves show the radii of the circles predicted assuming perfect slip at the surface
0 5 10 15 20 25 30 35 40 45
0 5 10 15 20 25 30 35 40
Rad
ial
p
o
si
ti
o
n
(m
m
)
Time (s)
I II
III IV
I II IV
III
I II
IV
In the suspension with a volume fraction of 0.586, a small region (about 5 mm in
diameter) at the center became very dry, as ascertained visually by the change in the
appearance of the suspension. The suspension in the central region became whiter and
less smooth than before as can be seen in Figure 2.12. This region corresponds to the
region of high normal stresses in Figure 2.8. The fact that squeezing the spheres without
fluid results in a similar normal stress distribution suggests that at concentrations above
0.55, the liquid phase migrates out of the central region and jamming takes place.
Figure 2.12 Image of the squeezed suspension of glass spheres in Dow Corning 200 Fluid 300,000 cSt with volume fraction of 0.586 showing a whiter and dryer spot at the center.
In squeeze flow, liquid-phase migration becomes important in suspensions when the
For squeeze flow between parallel disks with perfect slip at both surfaces, Mascia and
Wilson (2007) obtained an expression for the critical approach velocity by comparing
two of the time scales involved. The first relates to the deformation of the suspension as a
whole, and the second to the filtration of the liquid phase through the particle network.
Their result is equivalent to
2 2 R Ph k Vcritical (2.6)
where k is the absolute permeability of the solids matrix, ΔP is the pressure difference
between the center (r = 0) and the edge (r = R) of the disks, h is the gap between the
disks, R is the radius of the disks, and μ is the viscosity of the liquid phase.
This expression can be easily obtained by finding the approach velocity, V, at which
vr,susp, the radial velocity at which the suspension as a whole flows when there is perfect
slip on both plates,
h r V vrsusp
2
,
(2.7)
is equal to vr,liq, the velocity at which the liquid phase filters through the particulate
network according to Darcy’s law,
R P k r P k vrliq
, (2.8)
For our calculations, we estimated the absolute permeability using Happel’s (1986)
correlation,
2 1/3 55//33 2
2 3 6 9 9 6
36
D
k
where D is the particle diameter and ε is the porosity of the suspension (1 - φ). The
absolute permeability for our suspension of 74 μm-diameter spheres with a volume
fraction of 0.586 was thus estimated to be 3.5410-11 m2.
Figure 2.13 Plate separation as a function of time for a suspension of glass spheres in Dow Corning 200 Fluid 300,000 cSt with a volume fraction of 0.586 squeezed between a parallel disk and a flat plate with a constant force of 13.3 kN
Figure 2.13 shows the gap between the disk and the plate as a function of time for this
suspension when squeezed with a force of 13.3 kN using the 3.5-in. diameter disk. 0
1 2 3 4 5
0 5 10 15 20 25 30 35 40
h
(m
m
)
Figure 2.14 Comparison of the approach velocity estimated from the data in Figure 2.12 to the critical approach velocity predicted by Eq. (3) for the case of perfect slip on both plates.
The approach velocity as a function of time was calculated by numerical differentiation
of these data and is presented in Figure 2.14. Also plotted are the estimates for the critical
approach velocity obtained using Eq. 2.6. These estimates are two orders of magnitude
smaller than the actual approach velocity, thus predicting no liquid phase migration in
this suspension. That the prediction is contrary to our observations is not surprising in
view of the evidence, clear from Figure 2.11, that the assumption of perfect slip does not
apply in this case. 1.E-08 1.E-07 1.E-06 1.E-05 1.E-04 1.E-03 1.E-02 1.E-01 1.E+00
0 2 4 6 8 10 12 14 16 18
V
el
o
ci
ty
(m
/s
)
h (mm)
Approach velocity
If there is no slip or partial slip at the surface, the rheological characteristics of the
suspension play a large role in determining whether or not liquid-phase migration takes
place. If our suspensions could be modeled approximately as a Bingham plastic, the work
of Smyrnaios and Tsamopoulos (2001) would predict an unyielded region near the center
of plates. In the unyielded region, where the radial velocity of the suspension as a whole
is zero, the pressure gradient would cause the liquid phase to filter out. Eventually, the
volume fraction of solids in the central region would be so high that the particles would
jam. As squeezing continued the jammed structure would be disturbed and the particles
would jam again at a lower plate separation.
2.4.
Conclusions
The normal stress distribution for suspensions of glass spheres in a Newtonian fluid
near their maximum packing fraction undergoing squeeze flow with a constant-force
between a parallel circular disk and a large flat surface is qualitatively different from that
for Newtonian fluids. The central region of high normal stresses may be due to migration
of the liquid from the central region to the outer regions causing the formation of a highly
viscous material with a yield stress in the central region.
It is well documented that the viscosity of suspensions is very sensitive to volume
fraction and increases sharply near the maximum packing fraction. The normal stress
distribution changes drastically in our suspensions with volume fractions beyond 0.55. At
high concentrations, suspensions have a yield stress. It is possible that the yield stress
causes the material near the middle of the top surface and of the bottom surface to remain
that deforms. As the squeeze test proceeds, the unyielded region on the top surface
touches the unyielded region on the bottom surface and the particles jam. Particles of the
suspension near the central region jam and the continued squeezing causes the liquid to
migrate out of that region.
At lower concentrations the unyielded region does not form in the center of the plates
because these suspensions have a small or no yield stress. On the other hand, at high
concentrations, a small increase in the solid content in the central region as a
consequence of liquid filtration can cause particle jamming in that region. This in turn
causes a very large pressure gradient between the center and the outer region forcing the
remaining suspending liquid out of that region, which results in an almost dry spot in the
center of the disk.
The concentration gradient that results from accumulation of particles in the middle of
the disk during the squeeze flow requires that the analysis take into account the time and
position dependence of the rheological properties of the material. In these cases,
assuming that the material is characterized by a rheological model with constant