Abstract—Biogeography-based optimization (BBO) algorithm realizes the information circulation and sharing by the species migration among habitats and achieves the global by improving the adaptability of habitats. Based on the population adaptive migration mechanism of BBO algorithm, the unconstrained function optimization problem is solved with six species migration models. For performance comparison, the ant colony optimization (ACO) algorithm, the differential evolution (DE) algorithm and the particle swarm optimization (PSO) algorithm are adopted to solving six unconstrained functions optimization problems. Simulation results show that the convergence speed, optimization accuracy and solution uniformity of BBO algorithm have been improved significantly, and BBO algorithm is more efficient to solve the unconstrained function optimization problem.
Index Terms—biogeography-based optimization algorithm, function optimization, performance comparison
I. INTRODUCTION
HE nature of function optimization problem is to find the optimal solution of an objective function through iterative [1]. The function features are usually described as continuous, discrete, linear, non-linear, convex function, etc. In that the constraint function optimization problem can be converted into unconstrained problem by using the designed special operators and penalty functions to make solution always feasible, the unconstrained function optimization problem is the main research focus. The swarm intelligent optimization algorithms [2] are a kind of random search algorithm to simulate the biological population evolution and evolution, which solves the complex global optimization Manuscript received June 17, 2016; revised October 5, 2016. This work was supported by the Project by National Natural Science Foundation of China (Grant No. 21576127), the Program for Liaoning Excellent Talents in University (Grant No. LR2014008), the Project by Liaoning Provincial Natural Science Foundation of China (Grant No. 2014020177), the Program for Research Special Foundation of University of Science and Technology of Liaoning (Grant No. 2015TD04) and the Opening Project of National Financial Security and System Equipment Engineering Research Center (Grant No. USTLKFGJ201502 and USTLKEC201401).
Jie-Sheng Wang is with the School of Electronic and Information Engineering, University of Science and Technology Liaoning, Anshan, 114051, PR China; National Financial Security and System Equipment Engineering Research Center, University of Science and Technology Liaoning. (phone: 86-0412-2538246; fax: 86-0412-2538244; e-mail: [email protected]).
Jiang-Di Song is a postgraduate student in the School of Electronic and Information Engineering, University of Science and Technology Liaoning, Anshan, 114051, PR China (e-mail: [email protected]).
problems through individual cooperation and competition between species, and is applied in many fields, such as multi-objective optimization, data mining, network routing, signal processing, pattern recognition, etc. The typical swarm intelligence optimization algorithms include Ant Colony Optimization (ACO) algorithm [3], Genetic Algorithm (GA) [4], Bat Algorithm (BA) [5], Artificial Bee Colony (ABC) algorithm [6], etc.
Artificial bee colony (ABC) algorithm is inspired by the foraging behavior of honey bee swarm. Inspired by PSO, an improved artificial bee colony (ABC) algorithm called gbest-guided ABC (GABC) algorithm was proposed by incorporating the information of global best (gbest) solution into the solution search equation to improve the exploitation [7]. In that ABC is good at exploration but poor at exploitation, and its convergence speed is also an issue in some cases, an improved ABC algorithm called I-ABC was proposed, where inertia weight and acceleration coefficients are introduced to modify the search process [8]. A new modified genetic algorithm with adaptive elitist-population strategies was proposed for multimodal function optimization, which is based on the concept of adaptively adjusting the population size according to the individuals’ dissimilarity and a novel direction dependent elitist genetic operator [9]. A hybrid niching algorithm based on the PSO was proposed to deal with multimodal function optimization problems [10], where the recombination-replacement crowding strategy that works on the archive population is introduced to improve the exploration capability. An ensemble of differential evolution algorithms employing the variable parameter search and two distinct mutation strategies in the ensemble was proposed to solve real-parameter constrained optimization problems, which was tested using benchmark instances [11]. An improved fruit fly optimization (IFFO) algorithm was proposed for solving continuous function optimization problems. A new control parameter is introduced to tune the search scope around its swarm location adaptively and a new solution generating method is developed to enhance accuracy and convergence rate of the algorithm [12]. Cuckoo search algorithm which reproduces the breeding strategy of the best known brood parasitic bird, the cuckoos has demonstrated its superiority in obtaining the global solution for numerical optimization problems. An improved cuckoo search algorithm with adaptive step size adjustment is introduced and its feasibility on a variety of benchmarks is validated [13]. Biogeography-based optimization (BBO) Algorithm is put forward by Simon in 2008 [14-15], whose basic idea is the
Application and Performance Comparison of
Biogeography-based Optimization Algorithm on
Unconstrained Function Optimization Problem
Jie-Sheng Wang, and Jiang-Di Song
T
IAENG International Journal of Applied Mathematics, 47:1, IJAM_47_1_12
species migration to complete the information flows among habitats. By adjusting immigration rate, emigration rate, migration topology, migration interval and migration strategies, the information sharing is realized in the migration process in order to improve the suitability of habitats and obtain the optimal solution [16]. BBO algorithm has been successfully applied in economic load assignment [17], combinatorial optimization [18], power distribution of wireless sensor network [19], function optimization [20], etc. In this paper, based on the population adaptive migration mechanism of BBO algorithm, the unconstrained function optimization problem is solved with six species migration models. The remainder of this paper is organized as follows. In Section 2, the BBO algorithm is introduced. The simulation experiments and the analysis of the results are discussed in detail in Section 3. The concluding remarks are presented in the last section.
II. BIOGEOGRAPHY-BASED OPTIMIZATION ALGORITHM
A. Biogeography
[image:2.595.345.510.199.302.2]BBO algorithm [14] is derived from biogeography, whose main contents is to establish mathematical models for a series of events include residence, migration routes, production of new species, and extinction of species in nature. Figure 1 introduces this migration relationship among habitants.
Fig. 1. Multi-habitats in biological geography
In addition to the relationship among these islands, each island has its own factors and survival indicators. For those islands suitable for breeding populations, a higher habitat suitable index (HSI) is obtained. The un-isolated index variables affecting HIS are named as independent habitat variable. However, when the HSI is high, the population on the corresponding island is more crowded, many populations will migrate to other neighboring islands to multiply. Meanwhile, there are other populations from other low HSI islands migrating into this island with higher HSI. The immigration rate of the island with lower HIS is higher than the island with higher HIS. The habitat migration operator in BBO algorithm is set up based on probability theory to realize the information sharing among each individual in the population. Each individual has its emigration rate and immigration rate for controlling the moving probability of individuals.
B. Mathematical model of biogeography
The species migratory model of monomer HIS shown in
figure 2[14] is described as follows. Based on emigration rate
and immigration rate , the function of the number of
species on the island is established. Is can be seen from Figure 2, the larger the number of species, the larger the emigration rate. When the number of species reached maximum number of species capacity Smax , the emigration rate reaches its
maximum value E. On the other hand, when the number of species on the island is 0, the immigration rate is the largest value I. The equilibrium point of the number of species on this island is S0, where the immigration rate equals to the
emigration rate.
Fig. 2. Species migration model of single island
In BBO algorithm, an island has S species, whose probability is Ps . Ps changes within the time
t t, t
described as follows.( ) ( )(1 )
1 1 1
P t t P t t t P t P t
s s s s s s s s
(1) When the number of species of the island is S , the emigration rate is s ,= and the immigration rate is s .
Suppose Eq. (1) is established, the number of species is S at the time t t. Aiming at this situation, it must satisfy at least one of the following conditions.
(1) At the time t, there are S species in this island. At the time t t, no species emigrate and immigrate.
(2) At the time t, there are S1 species in this island. At the time t t, there is a specie to emigrate.
(3) At the time t, there are S1 species in this island. At the time t t, there is a specie to immigrate.
If t is small enough, the probability of emigration/immigration can be neglected for this species. Define nSmax and P Ss( 0,1,, )n . Then equation
0 1
[ , , , n]T
P P P P can be represented as a matrix:
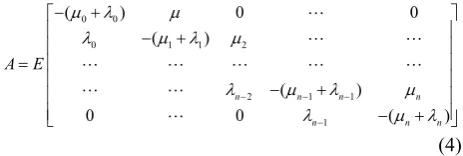
PAP (2) where Ais given in the Eq. (4).
1 1
-1 -1 1 1 max
-1 -1 max
( ) , 0
( ) + 1 1
( ) ,
s s s s s
s s s s s s s
s s s s s
P P S
p P P P S S
P P S S
, (3)
IAENG International Journal of Applied Mathematics, 47:1, IJAM_47_1_12
[image:2.595.49.287.383.527.2]0 0
0 1 1 2
2 1 1
1
( ) 0 0
( )
( )
0 0 ( )
n n n n n n n A E
(4) In order to facilitate our research, Figure 2 can be changed to Figure 3 assumed EI.
[image:3.595.59.291.51.129.2]
Fig. 3. Simplified species migration model of single island
k
k E
n
(5)
k 1
k I
n
(6)
where nSmax and k equals the number of species. Eq. (4)
can be further changed as:
1
1 0 0
2
' 2
1 1
0 0 1
n n
n
n n
A E EA
n
n n
n
(7)
The probability to accommodate the number of species of each island is given by the following formula:
0
0 1 1
1 1 2
0 1 1
0 1 1
1 2
1 1 2
1
, 0
1
,1 1
n
l
l l
k
k
k n
l k
l l
P k
P
P k n
(8)
If each island (solution) has the same species migratory curve, that is to say S2 represents a solution with higher HIS
and S1 represents a solution with lower HIS. The emigration
rate of S1 is lower than the corresponding value of S2, while
the immigration rate of S1 is higher than the corresponding
value of S2. Through the mobility of each solution, it can
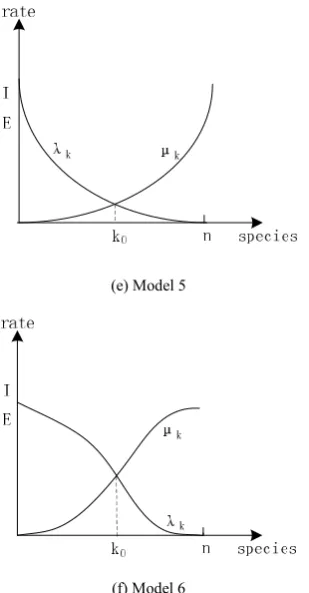
make the information sharing among islands. Six species migration models of BBO algorithm are shown in Figure 4.
(a) Model 1
(b) Model 2
(c) Model 3
(d) Model 4
IAENG International Journal of Applied Mathematics, 47:1, IJAM_47_1_12
(e) Model 5
[image:4.595.94.249.53.350.2](f) Model 6
Fig. 4. Six species migration models of BBO algorithm
C. BBO algorithm
The BBO algorithm is a method composed by n habitats with D -dimension SIV fitness vector. Hi represents the
fitness value of the habitat i. By comparing the habitat values of Hi with Smax, the number of all species are denoted as n.
Then the rest habitat population Si is realized the successive
reduction i according to Hi from good to bad, that is to say max
i
S S i (i1, 2,,n). By the above calculatation, the emigration rate and immigration rate of Hi in the
different migration model can be obtained. Also the species contained probability P K( i) of Hi can be calculated.
max
max
.(1 S )
S
P
M M
P
(9)
So the mutation rate Mi of each Hi is obtained. The
global variable is composed of the maximum emigration rate
E, the immigration rate I , the mutation rate Mmax, the
individual reservations elitist number Z and the global mobility rate Pmod of species.
The flowchart of BBO algorithm is shown in Figure 5. The algorithm procedure is described as follows.
Step 1: Initialize the parameters of BBO algorithm and the
i
H vector of any habitat.
Step 2: For different suitability Hi, sort the habitats from
good to bad. Generally the update rate of habitats i1. Step 3: By comparison, judge whether the desired optimum is satisfied or not. If it is satisfied, the optimum is output and algorithm procedure is terminated. Otherwise, turn to Step 4.
Step 4: Suppose the maximum number of a specie in a habitat Smaxn . Then by means of SiSmaxi
(i1, 2,,n), the populations value Si of habitat i is
obtained, which is further brought into the migration model to obtain its i and i.
Step 5: After the cyclic operation of Pmod, whether i has
entered into the immigration pattern (the number n of i is defined as the number of cycles) can be determined. If habitat
i is carried out the immigration operation, the habitat immigration rate i (the dimension D of SIV as the
number of cycles) is used to judge its characterized component SIVij whether to be immigrated or not. If SIVij is
implemented with the immigration, then, through its emigration rate m ( m1, 2,, ,n mi ) it can be
performed by selecting, and then the feature component SIVij
of the i is replaced by a component of selected m.
Step 6: By calculating Mi of the corresponding habitat, the
[image:4.595.319.540.333.697.2]related variable of the Habitat i is judged to see whether the mutation has occurred. The results are compared and turn to Step 2.
Fig. 5. Flowchart of BBO algorithm
III. SIMULATION EXPERIMENTS
In this paper, ant colony optimization (ACO) algorithm, differential evolution (DE) algorithm and particle swarm optimization (PSO) algorithm are chosen for realizing the
IAENG International Journal of Applied Mathematics, 47:1, IJAM_47_1_12
performance comparison with six Benchmark functions (Ackley function, Griewank function, Rastrigin function, Sphere function, Step function and Quartic function). Their n input parameters are defined as x ii( 1, 2,, )n . The global minimum point is x*(0,, 0) and the minimum of the objective function is f x( *)0. These six testing functions are described as follows.
In this paper, the parameters of each optimization algorithm are roughly adjusted in order to obtain better performance, but the parameters of any algorithm are not fine-tuned specially. The adopted parameters are described as
follows. In ACO algorithm, the pheromone evaporation coefficient is 0.9 and the quality factor of the pheromone is 1. In DE algorithm, the weight factor and the cross-constant are 0.5. In PSO algorithm, the inertia constant is 0.3, the cognitive constant is 1 and the particle swarm interaction constant is 1. In BBO algorithm, the habitat update probability is 1, the mobility range of each generation is [0, 1], the step length of probability integral calculation, the maximum immigration and the emigration rate are all 1. For each algorithm, the population size is 50 and the maximum iteration number is 50.
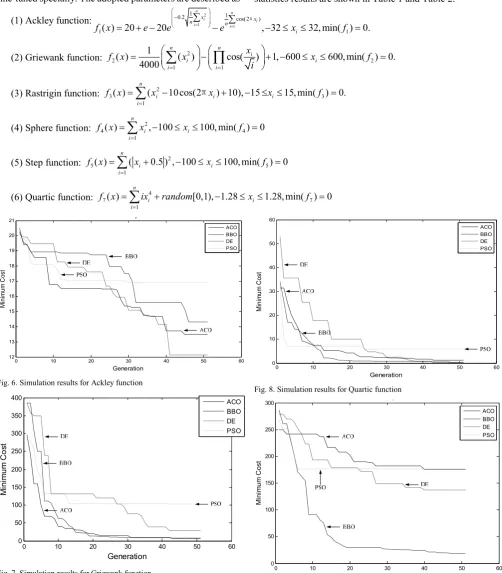
The simulation results are shown in Figure 6-11. The statistics results are shown in Table 1 and Table 2.
(1) Ackley function: 1 2 1
1 1
0.2 cos( 2 )
1( ) 20 20 , 32 32, min( )1 0.
n n i i i i x x n n i
f x e e e x f
π
(2) Griewank function: 2 2 2
1 1
1
( ) ( ) cos( ) 1, 600 600, min( ) 0.
4000 n n i i i i i x
f x x x f
i
(3) Rastrigin function: 3 2 3
1
( ) ( 10 cos(2 ) 10), 15 15, min( ) 0.
n
i i i
i
f x x x x f
π (4) Sphere function: 4 2 4
1
( ) , 100 100, min( ) 0
n
i i
i
f x x x f
(5) Step function: 5 2 5
1
( ) ( 0.5 ) , 100 100, min( ) 0
n
i i
i
f x x x f
(6) Quartic function: 7 4 7
1
( ) [0,1), 1.28 1.28, min( ) 0
n
i i
i
f x ix random x f
0 10 20 30 40 50 60
12 13 14 15 16 17 18 19 20 21 Generation M in im u m C o s t Ackley ACO BBO DE PSO
Fig. 6. Simulation results for Ackley function
0 10 20 30 40 50 60
[image:5.595.50.553.194.768.2]0 50 100 150 200 250 300 350 400 Generation M in im u m C o s t ACO BBO DE PSO
Fig. 7. Simulation results for Griewank function
0 10 20 30 40 50 60
0 10 20 30 40 50 60 Generation M in im u m C o st Quartic ACO BBO DE PSO
Fig. 8. Simulation results for Quartic function
0 10 20 30 40 50 60 0 50 100 150 200 250 300 Generation M ini m u m C os t Rastrigin ACO BBO DE PSO
Fig. 9. Simulation results for Rastrigin function
IAENG International Journal of Applied Mathematics, 47:1, IJAM_47_1_12
0 10 20 30 40 50 60 0
20 40 60 80 100 120 140
Generation
M
in
im
u
m
C
o
s
t
Sphere
[image:6.595.48.294.52.234.2]ACO BBO DE PSO
Fig. 10. Simulation results for Sphere function
0 10 20 30 40 50 60 0
0.5 1 1.5 2 2.5 3 3.5 4 4.5
5x 10
4
Generation
M
in
im
u
m
C
o
s
t
Step
[image:6.595.47.555.438.787.2]ACO BBO DE PSO
Fig. 11. Simulation results for Step function
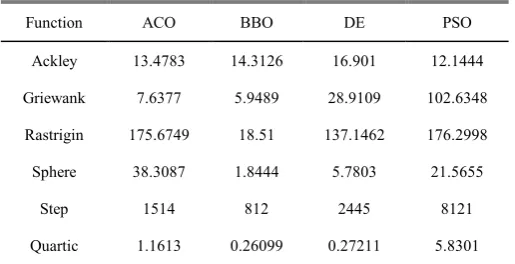
TABLE 1.OPTIMAL SOLUTION UNDER FOUR ALGORITHMS
Function ACO BBO DE PSO
Ackley 13.4783 14.3126 16.901 12.1444
Griewank 7.6377 5.9489 28.9109 102.6348
Rastrigin 175.6749 18.51 137.1462 176.2998
Sphere 38.3087 1.8444 5.7803 21.5655
Step 1514 812 2445 8121
Quartic 1.1613 0.26099 0.27211 5.8301
TABLE 2.AVERAGE FUNCTION VALUES UNDER FOUR ALGORITHMS
Function ACO BBO DE PSO
Ackley 20.1244 20.2531 20.0362 14.0955
Griewank 116.1742 17.1637 49.235 314.7486
Rastrigin 359.658 28.4341 187.2935 302.6841
Sphere 165.911 5.6114 12.4625 99.4257
Step 16018.68 1807.16 4298.18 40422
Quartic 29.3765 2.2185 1.5771 150.0125
It can be seen form Figure 6-11, the BBO algorithm is behaved very well compared with other three swarm intelligent algorithms in five benchmark functions in addition to seem slightly less in Ackley function. The iteration number of BBO algorithm is about 20 times to be leveled to the minimum, which proves that the algorithm is more rapid and efficient in global function optimization problem. Seen form the simulation results, the optimal solution and the average value of the BBO algorithm for five benchmark functions are both at the forefront position. For Ackley function, it is slightly inferior to ACO and DE algorithm. The simulation results may indicate that BBO algorithm is the most effective in terms of solving function optimization problems, the DE and ACO algorithm secondly, the PSO algorithm has worst performance.
IV. CONCLUSION
In that the current optimization algorithms have poor convergence in solving function optimization problems, the BBO algorithm is used to solve the function optimization problem. The simulation experiments are carried out with multiple test functions to verify it’s optimization performance. Simulation results show that BBO algorithm can solve function optimization problems more efficiently. The convergence speed and optimization accuracy are higher than other intelligent optimization algorithms. These results also indicate deep-seated that the biogeography mechanism is the law of nature in the formation of long-term evolution and it is unique and effective in handling all kinds of optimization problems.
REFERENCES
[1] Y. Ren, and Y. Wu, “An efficient algorithm for high-dimensional function optimization.” Soft Computing, vol. 17, no. 6, pp. 995–1004, Jun. 2013.
[2] Z. Yuan, M. A. M. de Oca, and M. Birattari, “Continuous optimization algorithms for tuning real and integer parameters of swarm intelligence algorithms,” Swarm Intelligence, vol. 6, no. 1, pp. 49–75, Mar. 2012. [3] Y. Ghanou, and G. Bencheikh, "Architecture Optimization and Training for the Multilayer Perceptron using Ant System," IAENG International Journal of Computer Science, vol. 43, no.1, pp. 20-26, 2016.
[4] E. Vallada, and R. Ruiz, “A genetic algorithm for the unrelated parallel machine scheduling problem with sequence dependent setup times,” European Journal of Operational Research, vol. 211, no. 3, pp. 612–622, Jun. 2011.
[5] Anping Song, Mingbo Li, Xuehai Ding, Wei Cao, and Ke Pu, "Community Detection Using Discrete Bat Algorithm," IAENG International Journal of Computer Science, vol. 43, no.1, pp37-43, 2016.
[6] Chun-Feng Wang, and Yong-Hong Zhang, "An Improved Artificial Bee Colony Algorithm for Solving Optimization Problems," IAENG International Journal of Computer Science, vol. 43, no.3, pp336-343, 2016.
[7] G. Zhu, and S. Kwong, “Gbest-guided artificial bee colony algorithm for numerical function optimization,” Applied Mathematics and Computation, vol. 217, no. 7, pp. 3166–3173, Dec. 2010.
[8] G. Li, P. Niu, and X. Xiao, “Development and investigation of efficient artificial bee colony algorithm for numerical function optimization,” Applied soft computing, vol. 12, no. 1, pp. 320–332, Jan. 2012. [9] Y. Liang, and K. S. Leung, “Genetic Algorithm with adaptive
elitist-population strategies for multimodal function optimization,” Applied Soft Computing, vol. 11, no. 2, pp. 2017–2034, Mar. 2011. [10] M. Li, D. Lin, and J. Kou, “A hybrid niching PSO enhanced with
recombination-replacement crowding strategy for multimodal function optimization,” Applied Soft Computing, vol. 12, no. 3, pp. 975–987, Mar. 2012.
IAENG International Journal of Applied Mathematics, 47:1, IJAM_47_1_12
[image:6.595.41.299.488.620.2] [image:6.595.42.317.652.785.2][11] M. F. Tasgetiren, P. N. Suganthan, Q. K. Pan, and R. Mallipeddi, “An ensemble of differential evolution algorithms for constrained function optimization,” in Proc. 2010 IEEE Congress on Evolutionary Computation (CEC), Barcelona, Spain, 2010, pp. 1–8.
[12] Q. K. Pan, H. Y. Sang, J. H. Duan, and L. Gao, “An improved fruit fly optimization algorithm for continuous function optimization problems,” Knowledge-Based Systems, vol. 62, no. 5, pp. 69–83, May. 2014.
[13] P. Ong, and Z. Zainuddin, “An efficient cuckoo search algorithm for numerical function optimization,” in Proc. the 20th National Symposium on Mathematical Sciences: Research in Mathematical Sciences: A Catalyst for Creativity and Innovation, Putrajaya, Malaysia, 2013, pp. 1378–1384.
[14] D. Simon, “Biogeography-based optimization,” IEEE Transactions on Evolutionary Computation, vol. 12, no. 6, pp. 702–713, Jan. 2009. [15] D. Simon, “A probabilistic analysis of a simplified
biogeography-based optimization algorithm,” Evolutionary computation, vol. 19, no. 2, pp. 167–188, May. 2011.
[16] H. Ma, “An analysis of the equilibrium of migration models for biogeography-based optimization,” Information Sciences, vol. 180, no. 18, pp. 3444–3464, Sep. 2010.
[17] A. Bhattacharya, and P. K. Chattopadhyay, “Hybrid differential evolution with biogeography-based optimization for solution of economic load dispatch,” Power Systems, IEEE Transactions on, vol. 25, no. 4, pp. 1955–1964, Dec. 2010.
[18] M. Ergezer, and D. Simon, “Oppositional biogeography-based optimization for combinatorial problems,” in Proc. 2011 IEEE Congress on Evolutionary Computation (CEC) , New Orleans, LA, USA, 2011, pp. 1496–1503.
[19] W. Gong, Z. Cai, C. X. Ling, and H. Li, “A real-coded biogeography-based optimization with mutation,” Applied Mathematics and Computation, vol. 216, no. 9, pp. 2749–2758, Jul. 2010.
[20] I. Boussaid, A. Chatterjee, P. Siarry, and M. Ahmed-Nacer, “Hybridizing biogeography-based optimization with differential evolution for optimal power allocation in wireless sensor networks,” IEEE Transactions on Vehicular Technology, vol. 60, no. 5, pp. 2347–2353, May. 2011.
Jie-sheng Wang received his B. Sc. And M. Sc. degrees in control science from University of Science and Technology Liaoning, China in 1999 and 2002, respectively, and his Ph. D. degree in control science from Dalian University of Technology, China in 2006. He is currently a professor and Master's Supervisor in School of Electronic and Information Engineering, University of Science and Technology Liaoning. His main research interest is modeling of complex industry process, intelligent control and Computer integrated manufacturing.
Jiang-Di Song is received her B. Sc. degree from University of Science and Technology Liaoning in 2012. She is currently a master student in School of Electronic and Information Engineering, University of Science and Technology Liaoning, China. Her main research interest is modeling methods of complex process and intelligent optimization algorithms.
![figure 2[14] is described as follows. Based on emigration rate this island is and immigration rate , the function of the number of species on the island is established](https://thumb-us.123doks.com/thumbv2/123dok_us/380769.535518/2.595.345.510.199.302/figure-described-follows-emigration-immigration-function-species-established.webp)