COMPARATIVE EVALUATION OF IMPLANT DESIGNS:
INFLUENCE OF DIAMETER, LENGTH AND TAPER ON
STRESS AND STRAIN IN THE MANDIBULAR SEGMENT -
A THREE DIMENSIONAL FINITE ELEMENT ANALYSIS
GOWTHAMA RAAJ K.C.
Dissertation submitted to the Tamil Nadu Dr. M.G.R. Medical University
in partial fulfillment
of the requirements for the degree of
Master of Dental Surgery
in
Prosthodontics
including crown and bridge and implantology
Under the guidance of
Dr. P. Manimaran
HOD and Professor of Prosthodontics J.K.K.Nattraja Dental college and Hospital
Komarapalayam. 2015-2018
Tamil Nadu Dr. M.G.R. Medical University
Declaration
I hereby declare
that this dissertation entitled
COMPARATIVE EVALUATION OF IMPLANT DESIGNS:
INFLUENCE OF DIAMETER, LENGTH AND TAPER ON
STRESS AND STRAIN IN THE MANDIBULAR SEGMENT -
A THREE DIMENSIONAL FINITE ELEMENT ANALYSIS
is a bonafide and genuine research work carried out by me under
the guidance of
Dr. P. Manimaran, H.O.D. and Professor of Prosthodontics
J.K.K. Nattraja Dental College and Hospital
Komarapalayam
GOWTHAMA RAAJ K.C.
Postgraduate student in Prosthodontics J.K.K.Nattraja Dental College and HospitalEndorsement
by the Head of the Department and Principal
This is to certify that the dissertation entitled
COMPARATIVE EVALUATION OF IMPLANT DESIGNS: INFLUENCE OF DIAMETER, LENGTH AND TAPER ON STRESS AND STRAIN IN THE MANDIBULAR SEGMENT - A THREE DIMENSIONAL FINITE ELEMENT
ANALYSIS
is a bonafide research work done by
GOWTHAMA RAAJ K.C.
under the
guidance of
Dr. P. Manimaran
H.O.D. and Professor of Prosthodontics
J.K.K.Nattraja Dental College and Hospital
Komarapalayam
Dr. P. Manimaran
Head of the Department of Prosthodontics J.K.K. Nattraja Dental College and Hospital
Komarapalayam
Dr. A. Sivakumar Principal
Copyright Declaration
I hereby declare that the
Tamil Nadu Dr. M.G.R. Medical University
shall have the rights to preserve, use
and disseminate this dissertation
in print or electronic format
for academic / research purpose.
GOWTHAMA RAAJ K.C.
Postgraduate student in Prosthodontics J.K.K. Nattraja Dental College and Hospial
Komarapalayam
©
Tami Nadu Dr. M. G. R. Medical University KomarapalayamCertificate - I
This is to certify that the dissertation entitled
COMPARATIVE EVALUATION OF IMPLANT DESIGNS: INFLUENCE OF DIAMETER, LENGTH AND TAPER ON STRESS AND STRAIN IN THE MANDIBULARSEGMENT - A THREE DIMENSIONAL FINITE ELEMENT ANALYSIS
is a bonafide research work done by
GOWTHAMA RAAJ K.C.
in partial fulfillment of the requirement
for the degree of
Master of Dental Surgery
in
Prosthodontics
including crown and bridge and implantology
Dr. C. Dhinesh Kumar
Co-Guide and Reader Department of Prosthodontics J.K.K. Nattraja Dental College
Komarapalayam
Komaraplayam Date: -2018
Dr. P. Manimaran
Guide and HOD
Department of Prosthodontics J.K.K. Nattraja Dental College
CERTIFICATE - II
This
is
to
certify
that
this
dissertation
work
titled
COMPARATIVE
EVALUATION OF IMPLANT DESIGNS: INFLUENCE OF
DIAMETER, LENGTH AND TAPER ON STRESS AND STRAIN IN
THE MANDIBULAR SEGMENT - A THREE DIMENSIONAL
FINITE ELEMENT ANALYSIS
of
the
candidate
GOWTHAMA RAAJ K.C.
with
registration
Number
241511101
for
the
award
of
MASTER of DENTAL SURGERY
in
the
branch
of
Prosthodontics
including crown and bridge and Implantology
.
I
personally
verified
the
urkund.com
website
for
the
purpose
of
plagiarism
check.
I
found
that
the
uploaded
thesis
file
contains
from
introduction
to
conclusion
pages
and
result
shows
0%
percentage
of
plagiarism
in
the
dissertation.
ACKNOWLEDGEMENT
I express my profound gratitude and respect to my guide Dr. P. Manimaran, M.D.S., HEAD OF THE DEPARTMENT, postgraduate Department of prosthodontics for his invaluable council and encouragement not only this study but throughout my postgraduate
course. I will always indebted to him for his wholehearted support in study.
I am extremely thankful to Dr. A. SIVAKUMAR M.D.S., Principal, J.K.K Nattraja Dental college & Hospital for his kind help and permitting me to use the facilities in the
institution.
I am thankful to Dr. C. Dhinesh Kumar M.D.S., Reader, Postgraduate – Department of prosthodontics for giving me constant guidance, support and for giving a final shape to this
study. This dissertation has been the fruitful outcome of his immense patience support, expert
guidance and advice from beginning to end of this study.
I am thankful to Dr. Saisadan M.D.S., Reader for all the inspiration and guidance he has provided throughout my postgradutation.
I am thankful to Dr. Abirami M.D.S., Senior lecturer, for her instant help, support and motivation rendered throughout this study.
I am thankful to my senior Dr. S. Uthayana Raaja and juniors Dr. Preethi suganya
and Dr. Sandhya for their concern and support.
I thank Dr. V. Prabu Raja, B.E., M.E., PhD, Associate professor, Department of mechanical engineering, CAE lab, PSG College of technology, Coimbatore for allowing me to
work and taught to me about the software used in this study.
I thank Dr. Kumaresan, B.A., M.A., M.Sc., M.Phil, PhD, Principal, Laxminarayana Arts and Science College for Women, Dharmapuri, for helping me out in doing the statistical
analysis of study results.
Finally I thankful to my parents Mr. P. Chidambaram, Mrs. K. Thilagavathy and my sister Dr. K.C. Keerthana Sri for an immense support, help and motivation throughout this study.
TABLE OF CONTENTS
S. No. Description Page No.
1. Introduction 1
2. Aim and objectives 6
3. Review of literature 8
4. Finite element methodology 27
5. Materials and methods 33
6. Photographs 34
7. Tables and graphs 51
8. Statistical analysis 60
9. Results 79
10. Discussion 81
11. Summary and conclusion 87
LIST OF FIGURES
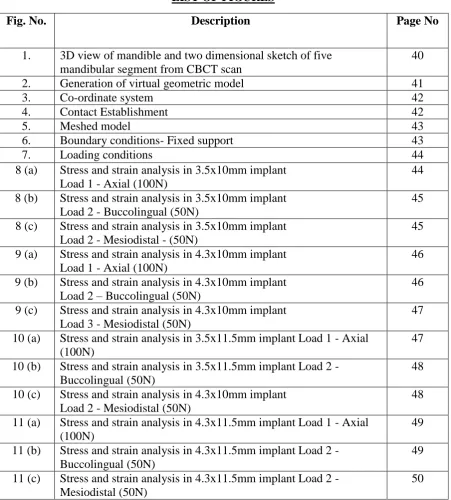
Fig. No. Description Page No
1. 3D view of mandible and two dimensional sketch of five mandibular segment from CBCT scan
40
2. Generation of virtual geometric model 41
3. Co-ordinate system 42
4. Contact Establishment 42
5. Meshed model 43
6. Boundary conditions- Fixed support 43
7. Loading conditions 44
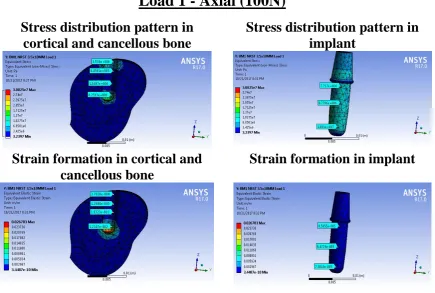
8 (a) Stress and strain analysis in 3.5x10mm implant Load 1 - Axial (100N)
44
8 (b) Stress and strain analysis in 3.5x10mm implant Load 2 - Buccolingual (50N)
45
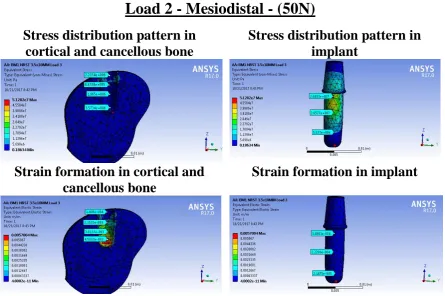
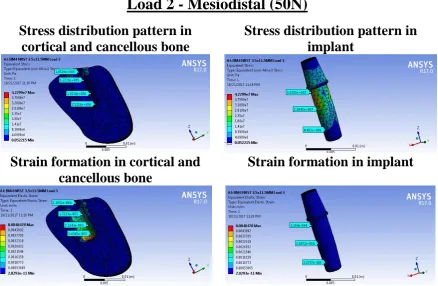
8 (c) Stress and strain analysis in 3.5x10mm implant Load 2 - Mesiodistal - (50N)
45
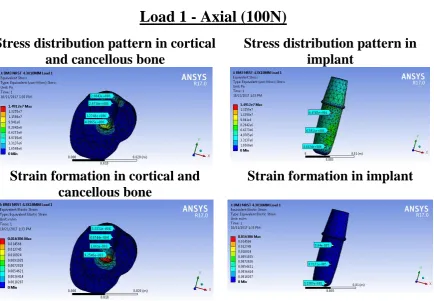
9 (a) Stress and strain analysis in 4.3x10mm implant Load 1 - Axial (100N)
46
9 (b) Stress and strain analysis in 4.3x10mm implant Load 2 – Buccolingual (50N)
46
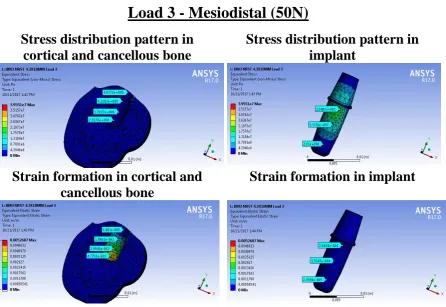
9 (c) Stress and strain analysis in 4.3x10mm implant Load 3 - Mesiodistal (50N)
47
10 (a) Stress and strain analysis in 3.5x11.5mm implant Load 1 - Axial (100N)
47
10 (b) Stress and strain analysis in 3.5x11.5mm implant Load 2 - Buccolingual (50N)
48
10 (c) Stress and strain analysis in 4.3x10mm implant Load 2 - Mesiodistal (50N)
48
11 (a) Stress and strain analysis in 4.3x11.5mm implant Load 1 - Axial (100N)
49
11 (b) Stress and strain analysis in 4.3x11.5mm implant Load 2 - Buccolingual (50N)
49
11 (c) Stress and strain analysis in 4.3x11.5mm implant Load 2 - Mesiodistal (50N)
50
LIST OF TABLES
Table No Description Page No.
1. Mechanical properties of different material used in the model 36 2. Contact Type between the Three Dimensional Models 36
3. Load (force) and magnitude 37
4. Von mises Stress (MPa) produced under Axial load 100N Load-1 (G1) Implant size 3.5x10 mm
52
5. Von mises Stress (MPa) produced under Axial load 100N Load-1 (G2) Implant size 4.3x10 mm
[image:10.595.77.529.100.583.2]6. Von mises Stress (MPa) produced under Axial load 100N Load-1 (G3) Implant size 3.5x11.5 mm
52
7. Von mises Stress (MPa) produced under Axial load 100N Load-1 (G4) Implant size 4.3x11.5 mm
53
8. Von mises Strain produced under Axial load 100N Load-1 (G1) Implant size 3.5x10 mm
53
9. Von mises Strain produced under Axial load 100N Load-1 (G2) Implant size 4.3x10 mm
53
10. Von mises Strain produced under Axial load 100N Load-1 (G3) Implant size 3.5x11.5 mm
54
11 Von mises Strain produced under Axial load 100N Load-1 (G4) Implant size 4.3x11.5 mm
54
12 Von mises Stress (Mpa) produced under Non Axial load (Bucco lingual) 50N Load-2 (G1) Implant size 3.5x10 mm
54
13 Von mises Stress (Mpa) produced under Non Axial load (Bucco lingual) 50N Load-2 (G2) Implant size 4.3x10 mm
55
14 Von mises Stress (Mpa) produced under Non Axial load (Bucco lingual) 50N Load-2 (G3) Implant size 3.5x11.5 mm
55
15 Von mises Stress (Mpa) produced under Non Axial load (Bucco lingual) 50N Load-2 (G4) Implant size 4.3x11.5 mm
55
16 Von mises Strain produced under Non Axial load (Bucco lingual) 50N Load-2 (G1) Implant size 3.5x10 mm
56
17 Von mises Strain produced under Non Axial load (Bucco lingual) 50N Load-2 (G2) Implant size 4.3x10 mm
56
18 Von mises Strain produced under Non Axial load (Bucco lingual) 50N Load-2 (G3) Implant size 3.5x11.5 mm
56
19 Von mises Strain produced under Non Axial load (Bucco lingual) 50N Load-2 (G4) Implant size 4.3x11.5 mm
57
20 Von mises Stress (Mpa) produced under Non Axial load (Mesio distal) 50N Load-3 (G1) Implant size 3.5x10 mm
57
21 Von mises Stress (Mpa) produced under Non Axial load (Mesio distal) 50N Load-3 (G2) Implant size 4.3x10 mm
57
22 Von mises Stress (Mpa) produced under Non Axial load (Mesio distal)50N Load-3 (G3) Implant size 3.5x11.5 mm
58
23 Von mises Stress (Mpa) produced under Non Axial load (Mesio distal) 50N Load-3 (G4) Implant size 4.3x11.5 mm
58
24 Von mises Strain produced under Non Axial load (Mesio distal) 50N Load-3 (G1) Implant size 3.5x10 mm
58
25 Von mises Strain produced under Non Axial load (Mesio distal) 50N Load-3 (G2) Implant size 4.3x10 mm
59
26 Von mises Strain produced under Non Axial load (Mesio distal) 50N Load-3 (G3) Implant size 3.5x11.5 mm
59
27 Von mises Strain produced under Non Axial load (Mesio distal) 50N Load-3 (G4) Implant size 4.3x11.5 mm
59
33 Statistical analysis of Implant - Load 2 Buccolingual (50N) 64 34 Statistical analysis of cortical bone - Load 3 Mesiodistal (50N) 64 35 Statistical analysis of Cancellous bone - Load 3 Mesiodistal (50N) 65 36 Statistical analysis of Implant - Load 3 Mesiodistal (50N) 66
LIST OF GRAPHS
S. No Description Page No
INTRODUCTION
Page | 2 A key factor for the success or failure of a dental implant is the manner in which stresses
are transferred to the surrounding bone. Load transfer from implants to surrounding bone
depends on the type of loading, the bone–implant interface, the length and diameter of the
implants, the shape and characteristics of the implant surface, the prosthesis type, and the
quantity and quality of the surrounding bone39. The finite element analysis (FEA) is an
upcoming and significant research tool for biomechanical analyses in biological research. It is
an ultimate method for modelling complex structures and analysing their mechanical
properties. FEA has now become widely accepted as a non-invasive and excellent tool for
studying the biomechanics and the influence of mechanical forces on the biological systems.
The finite element method (FEM) is basically a numerical method to analyse stresses and
deformations in the structures of any given geometry77. The structure is discretized into the so
called ‘finite elements’ connected through nodes. The type, arrangement and total number of
elements impact the accuracy of the results. FEA allows researchers to predict stress
distribution in the contact area of the implants with cortical bone and around the apex of the
implants in trabecular bone. The biomechanical load management is dependent on the nature
of the applied force and the functional surface area over which the load is dissipated. The
principal factors that influence the load transfer at the bone implant interface includes implant
geometry which includes diameter and length, thread pitch, shape, depth in the case of threaded
implants, the type and magnitude of loading, implant material properties, quality and quantity
INTRODUCTION
Page | 3 and the nature of the bone–implant interface78. FEA is capable of providing detailed
quantitative data at any location within the mathematical model. Thus, FEA has become a
valuable analytical tool in implant dentistry65. Stress analysis of dental implant is very
necessary for the investigation of bone turnover and maximum anchorage success. Incorrect
loading or overloading may lead to distributed bone turnover and consequent implant loss.
Previous literature have shown that the cortical bone-implant interface has a higher
concentration of stress and implant having greater diameter produces minimum stress. Bone
quality also influences the long term success of implant treatment, poor bone quality reduces
the success rates. Load transfer to bone implant interface depends on number, position, design,
geometry of the implant, abutment connection, quality and quantity of surrounding bone. Since
clinical determination of stress and strain distribution in bone is not possible, therefore an
alternative technique should be used. So here finite element (FE) analysis, which is a reliable
method, is used to determine the information about stress and strain in implant-bone structure57.
This study was made to analyse the stress and strain distribution patterns in implants
with different diameter and length under axial and non-axial loading conditions in both cortical
INTRODUCTION
Page | 4
TERMINOLOGY
DENTAL IMPLANT a prosthetic device made of alloplastic material(s) implanted into the
oral tissues beneath the mucosal and/or periosteal layer and on or within the bone to provide
retention and support for a fixed or removable dental prosthesis; a substance that is placed into
and/or on the jaw bone to support a fixed or removable dental prosthesis28.
ABUTMENT- the supplemental component of a dental implant that is used to support and/ or
retain any fixed or removable dental prosthesis28
CORTICAL BONE – the peripheral layer of compact osseous tissue28
CANCELLOUS BONE – the reticular, spongy or lattice-like portion of the bone; the spongy
bone tissue located in the medulla of the bone; this bone is composed of a variable trabecular
network containing interstitial tissue that may be hematopoietic28.
C.T. SCAN X-RAY- radiography in which a three-dimensional image of a body
structure is constructed by computer from a series of plane cross -sectional images
made along an axis — called also computed axial tomography, computerized axial
tomography, computerized tomography33.
YOUNG’S MODULUS - eponym for the constant of proportionality expressed in the stress
strain plot as the slope in the elastic region where elastic recovery occurs upon release of the
INTRODUCTION
Page | 5
Poisson's ratio is the ratio of transverse contraction strain to longitudinal extension strain in
the direction of stretching force. Tensile deformation is considered positive and compressive
deformation is considered negative. The definition of Poisson's ratio contains a minus sign so
that normal materials have a positive ratio. Poisson's ratio, also called Poisson ratio or the
Poisson coefficient, or coefficient de Poisson, is usually represented as a lower case Greek
nu,
.
VON MISES STRESS - it is a geometrical combination of all the stresses (normal stress in
the three directions and all three shear stresses acting at a particular location. Since it is a stress,
it is measured in Pascal2.
VON MISES STRAIN - It is an index gained from the combination of principle stress at any
given point to determine at which points stress occurring on the x, y and z axis will cause
failure2.
FINITE ELEMENT ANALYSIS - It is a numerical method of structural analysis based on
the principle of dividing a structure into a finite number of small elements that are connected
with each other at the corner points or nodes. For each element its mechanical behaviour can
AIM
AND
AIM & OBJECTIVES
Page | 7 AIM:
To evaluate the influence of variable length and diameter of implant on stress
distribution in cortical and cancellous bone.
OBJECTIVES:
To understand the pattern of stress and strain distribution around implant
surface with variable length and diameter under axial and non-axial loading
conditions.
To understand the response of cortical and cancellous bone, under axial and
REVIEW
OF
REVIEW OF LITERATURE
Page | 9
Meijer et al (1992)57 investigated the influence of stress distribution of a three layered flexible
coating of poly active substance on a titanium implant in bone. On vertical loading, the
application of a flexible coating reduced the compressive and the tensile radial stress.
Variations in composition and thickness of the coating did not affect the results significantly.
Lewinstein et al (1995)48 used two dimensional finite element method to analyse the IL system
for supporting cantilever prosthesis, a special ball attachment and surrounding bone. Effective
and maximum stresses in tension and compression were determined. In this study the
observation was, in the IL system that support the cantilever prosthesis dramatically lowers the
stresses in the bone, cantilever and implants.
Richter et al (1995)23 quantifies the vertical forces applied to dental implants during oral
functions. Implants in the molar position that were fixed to a premolar with a prosthesis
withstand maximum vertical force so 60 to120 N during chewing. Single molars and premolars
carried maximum vertical forces of 120 to 150N. Clenching in centric occlusion caused a load
level of approximately 50 N for both natural and artificial abutments.Occlusal pre maturities
on the implant restoration that were less than 200 μm in height showed no significant increase
of the implant load level.
Zyl et al (1995)63 used three dimensional finite element stress analysis method to determine
the distribution of stress in an around a model of six implants in a stimulated human mandible.
A load of 100 N was applied at different intervals along the cantilever segment. There was a
decrease of stress that reached a minimal level at 15 mm along the cantilever segment.
Thereafter a progressive increase in stress in the lingual and buccal plates was demonstrated.
Kaukinen et al (1996)36 studied the influence of occlusal surface design on the longitudinal
success of implant treatment is believed to be significant, but it is not well understood. This
REVIEW OF LITERATURE
Page | 10 and strain transmitted through cusped 33 and cuspless 0 occlusal design specimens to a
simulated implant-retained prosthesis and the supporting bone. The results of this pilot study
indicated that the occlusal configuration and cusp angulation of implant retained prostheses
play a significant role in force transmission and the stress-strain relationship in bone.
Papavasilou et al (1996)26 used three dimensional finite element analysis and examined effects
of:
Types of edentulous mandible
Veneering materials
Absence of cortical bone
Different intra-mobile elements
Loading of cortical bone
Loading directions and levels
Five different models were created and these models were loaded with 20N magnitude
in axial and oblique (12 degree). Two different types of mandibles were modelled i.e. A3 type
and C3 type. Two types of intra-mobile elements i.e. delrin and titanium with respect to a single
IMZ implant (11x4 mm) were placed. The prosthesis attached to the implant with acrylic resin
veneered gold or porcelain fused to metal (PFM) restoration. Stress distribution patterns were
compared and interfacial stress were monitored toward cortical bone (0.8 to 15 MPa). Summary
of this study are minor stress increases were associated with smaller mandibles, no differences
were found with type of veneering materials, absence of cortical bone increased interfacial
stress, oblique load increase stress 15 times and 200N loads increased stress 10 times.
Conditions for bone micro fracturing were associated with oblique loads, high occlusal stress
REVIEW OF LITERATURE
Page | 11
Wadamoto et al (1996)53 evaluated a 3D morphometric method to acquire date for the bone
implant interface around a HA coated titanium alloy dental implant during initial healing. Three
implant were placed in the mandible of monkeys and the surface bone contact ration in the
buccal, lingual, mesial and distal directional were computed. Computer graphics were
generated by the integration of data for serial ground surfaces obtained at 75μm intervals of the
tissue block involved with the implant. The values of bone contact ratio (BCR) for the whole
implant surface in the three implants were 80.8%, 68.1% and 68.8% and the bone value ratio
(BVR) values were the volume of cortical bone. These results may contribute to the
development of realistic FEA models on biologic bone structures around the implants.
Barbier et al (1998)6 examined the influence of axial and non-axial occlusal load on the bone
remodelling phenomena around oral implants in an animal experiment and stimulated in FEA.
The axial and non-axial loading conditions were introduced by inserting a bilaterally supported
fixed partial prosthesis and a cantilever FPD on two IMZ implants in the mandible of beagle
dog. Strong correlations between the calculated stress distribution in the surrounding bone
tissue and the remodelling phenomena in the comparative animal model were observed. It was
concluded that the highest bone remodelling events coincided with the regions of highest
equipment and that the major remodelling differences between axial and non-axial loading
were largely determined by the horizontal stress component of the endangered stress.
Brosh et al (1998)79 evaluated the influence of abutment angulation on stress and strain along
the implant bone interface. The two experimental techniques, strain gauges and photo elasticity
were used and compared for the analysis. Identical vertical loads applied on pre angulated
abutment produced higher stress at the coronal zone of an implant compared with the straight
REVIEW OF LITERATURE
Page | 12
Hobkirk et al (1998)40 tested the hypothesis that functional mandibular deformation influences
force distribution in the jaw/ implant/superstructure complex. Six Branemark implants were
mounted in an acrylic resin replica of an edentulous mandible, which was suspended in a frame
that stimulated the natural situation. It was conclude that functional mandibular deformation is
a significant factor in the design of mandibular implant stabilized prosthesis and calls into
doubt the value of modelling techniques that do not allow for this phenomenon.
Stegaroiu et al (1998)43 assessed stress in bone around titanium implants using three treatment
designs for a partially edentulous mandible, under axial (AX), buccolingual (BL) or mesiodistal
(MD) loads. The 3D FEA method was used. For each of the loads highest stress was calculated
in the model with cantilever prosthesis supported two implants (M2). Less stress was found in
the model with a conventional fixed partial denture on two implants (M3) cortical bone stress
was high, comparable to that calculated for M2 under same load. When axial or mesiodistal
load was applied to M3 the cortical bone stress was low similar to that found in M1.
Teixeira et al (1998)80 developed a 3D FEA model of an osseointegrated implant that could
accurately simulated the stress distribution in the peri implant compact and cancellous bones.
In this study a 3D model construction was first evaluated with respect to minimal model length
represented in a section of the mandible and also with regard to effect of decreased element
number by unification of elements far away from the implants on stress distribution for saving
computer memory and calculation time. Analysis of stress distribution followed by 100 N
loading with the fixation of the most external planes of the models indicated that a minimal
bone length of 4.2 mm of mesial and distal sides was acceptable for FEA representation.
Moreover, unification of elements located far away from the implant surface did not affect
REVIEW OF LITERATURE
Page | 13 implant model of the mandible with less range and fewer elements without altering stress
distribution.
Wyatt et al (1998)10 used Branemark implants to support fixed partial prosthesis which appears
to be a highly successful treatment alternative for restoration of the partially edentulous patient.
Satisfactory treatment outcomes are possible for a broad range of patients using various
implant, abutment and prosthetic components as was documented in this 1 -12 follow up study.
Sato et al (1998)71 investigated the effectiveness of element downsizing on the construction of
a 3D FE bone trabecular model with different element size 600,300,150 and 75 Micro meter).
Downsizing of elements from 600 to 300 Micro meter is suggested to be effective in the
construction of a 3D FEA.
O’Mahony and Williams et al (2000)60 determined elastic modulus values in three orthogonal
directions for cancellous bone taken form edentulous jaw and related these values to apparent
density (bone density and volume fraction. These results facilitated more accurate modelling
of the mandible in future finite element studies. Young’s moduli were greatest in the
mesiodistal direction followed by the buccolingual and inferio-superior direction. The
mesiodistal and buccolingual directions could not be shown to be different. This suggested a
model of transverse isotropy for cancellous bone in the jaw that be elastic isotropy occurred in
the transverse plane, i.e. in the mesiodistal and buccolingual direction with the symmetry axis
directed along the inferio-superior directions.
Ress et al (2001)69 examined the importance of the supporting structures of a tooth during
modelling was sell as analysing the stress distributions within a tooth. A 2D plane strain FEM
of a lower second premolar was developed, supported by periodontal ligament and alveolar
REVIEW OF LITERATURE
Page | 14 both the periodontal ligament and alveolar bone are important when undertaking the FEAA of
teeth.
Akca et al (2002)32 compared the data obtained from an in vitro strain gauge analysis of an
implant supported fixed partial denture with its 3D FEA model and a mathematical model in
which human simulation was provided. A static vertical load of 50N was applied at certain
location to simulated centrally positioned axial and laterally positioned axial loading for SGA
and 3D FE stress analysis. A statistically significant increase in strain levels were recorded
between loading types in the SGA (p<0.05) Strains obtained from SGA were higher than for
3D FEA. However there was compatibility on the determination of the quality of induced
strains under applied load between two methods.
Cruz et al (2003)51 analysed the stress distribution around a cuneiform geometry implant using
accurate three dimensional model that had a finer mesh than commonly found in the literature.
A mechanical model of an edentulous mandible was generated from computerised tomography
(CT SCAN) with the implant placed in the left first premolar region. A 100 n axial load was
applied at the implant abutment and mandibular boundary conditions were modelled
considering the real geometry of its muscle supporting system. They concluded that the
cuneiform geometry distributed the stress in a smooth pattern with a stress concentration in the
cortical region. No considerable apical stress concentrations were found. The modelling
methodology, conditions of the support and the load system and the finest anatomic and
functional variation played important roles in the results.
Jeffcoat et al (2003)52 compared the efficacy of Hydroxy apatite coated threaded endoosseous
dental implants and HA coated cylindrical end osseous dental implants with that of the
machined titanium threaded endoosseous dental implants. Each 120 edentulous patients
REVIEW OF LITERATURE
Page | 15 meier analysis was used to compare the proportion of ailing implants to each type of implant
design. This analysis revealed that 95.2% of machined titanium threaded implants experienced
less than 2 mm of bone loss p<0.06) over 5 years, the success rate tended to favour HA coated
implants.
Lang et al (2003)47 examined the dynamic nature of developing preload using FEA in an
implant complex that was modelled with a screw bore to provide the thread helix in the model
design. Even the co-efficient of friction on the development of preload amount in the implant
complex during and after abutment screw tightening was also determined. They concluded that
using FEA a torque of 32 Ncm applied to the abutment screws in the presence of coefficient of
friction of 0.26 resulted in lower than optimum preload for the abutment screws. To reach the
desired preload of 75% of the yield strength, using a torque of 32 Ncm, co-efficient of friction
between the implant components should be 0.12.
Lin et al (2003)12 analysed the biomechanics in an implant/tooth–supported system under
REVIEW OF LITERATURE
Page | 16
different when vertical forces (50N) were applied to the pontic, molar (implant) only or the entire prosthesis, respectively, regardless of whether rigid or non-rigid connectors were used. Moreover, the peak stress values in the implant system and prosthesis were significantly reduced in single- or multiple-contact situations once vertical forces on the pontic were decreased. Minimization of the occlusal loading force on the pontic area through occlusal adjustment procedures to redistribute stress within the implant system in the maximum intercuspation position for an implant/tooth–supported prosthesis is recommended.
Eskitascioglu et al (2004)30 investigated the effect of loading at 1 to 3 different locations on
the occlusal surface of a tooth on the stress distributions in an implant-supported mandibular
fixed partial denture (FPD) and surrounding bone, using 3-dimensional finite element analysis.
A 3-dimensional finite element model of a mandibular section of bone (Type 2) with missing
second premolar and its superstructures were used in this study. A 1-piece 4.1 X 10mm
screw-shape ITI dental implant system (solid implant) was modeled for this study. Cobalt-Chromium
(Wiron 99) was used as the crown framework material and porcelain was used for occlusal
surface. The implant and its superstructure were simulated in a Pro/Engineer 2000i program.
Total loads at 300 N were applied at the following locations: 1) tip of buccal cusp (300 N), 2)
tip of buccal cusp (150 N) and distal fossa (150 N), or 3) tip of buccal cusp (100 N), distal fossa
(100 N), and mesial fossa (100 N). Results demonstrated that vertical loading at 1 location
resulted in high stress values within the bone and implant. Close stress levels were observed
within the bone for loading at 2 locations and 3 locations; the former created the most extreme
stresses and the latter the most even stresses within the bone. With loading at 2 or 3 locations,
stresses were concentrated on the framework and occlusal surface of the FPD, and low stresses
were distributed to the bone.
Dincer Bozkaya (2004)18 investigated the effects of external geometry and occlusal load
REVIEW OF LITERATURE
Page | 17 different implant systems; Ankylos, Astra, Bicon, ITI, and Nobel Biocare, comparable in size,
but different in thread profile and crest module shapes, were compared using the finite element
method. Type II bone quality was approximated and complete osseous integration was
assumed. Occlusal loads of varying magnitudes (0 to 2000 N) were applied on the abutments
supporting single tooth restorations at 11.3 degrees from the vertical axis with a 1-mm offset.
Total overloaded bone area, where tensile and compressive normal stresses fell outside of the
recommended limits of 100 and 170 MPa respectively, was investigated for different load
levels. Result shows that moderate levels of occlusal loads up to 300 N, the compact bone was
not overloaded by any of the implant systems. At the extreme end of the occlusal load range
(1000 N or more) the overloading characteristics of implants may be dependent on geometric
shape.
Mordefeld et al (2004)55 investigated and evaluated retrospectively the treatment outcome of
WP Mk II implants used in maxillary and mandibular posterior region. Fifty two patients
treated with seventy eight WP Mk II implants of 5mm diameter, length 7 to 13 mm placed in
the posterior segment of the maxilla and mandible were chosen. Patients under study were
recalled for general health and prosthodontics and radiographic examinations. Of seventy-eight
implants, eight had been lost by the time of re-examination. The survival rate was 89.8%. They
concluded that it is advisable to used wide implants longer than 8.5mm in the posterior areas
to minimize the risks for failure, as these regions present higher masticatory loadings, greater
lateral forces and sometimes compromised quality.
Kitamura et al (2005)43 observed average marginal bone resorption of about 1 mm after the
first year of functional loading, which is followed by an annual loss of approximately 0.1 mm,
has been reported in stable implants. However, finite element analyses on bone stress around
REVIEW OF LITERATURE
Page | 18 Three-dimensional finite element analysis was performed to compare the bone stresses in a
non-resorption model with those in four models with bone resorption of two depths (1.3 and
2.6 mm) and types (horizontal resorption and angular defects). Axial and bucco-lingual forces
were separately applied to the center of the superstructure and the maximum equivalent stress
was calculated. The main tendencies of bone stress (highest stress concentration around implant
neck, higher stresses under bucco-lingual than axial load, as well as in the cortical than
cancellous bone) were the same in the non-resorption and resorption models. Bone stress
distributions were similar in the non-resorption and horizontal resorption models, but differed
from those in the angular defect models. Moreover, the changes of the bone stress value with
resorption depth differed for the two resorption types. Thus, in FEA, accurate simulation of the
marginal bone shape in the implant neck region is advisable.
Petrie et al (2005) 18 analysed and compared systematically the relative and interactive effects
of implant diameter, length, and taper on calculated crestal bone strains. Three-dimensional
finite-element models were created of a 20mm premolar section of the mandible with a single
end osseous implant embedded in high or low density cancellous bone. Oblique (200-N vertical
and 40-N horizontal) occlusal loading was applied. Implant diameter ranged from 3.5 to 6mm,
total implant length from 5.75 to 23.5mm, and taper from 0 to 141 degree were taken for study,
resulting in 16 implant designs. Result shows that when the diameter of the implant is increased
3.5 fold reduction in crestal strain, increasing length caused as much as a 1.65 fold reduction,
whereas taper increased crestal strain, especially in narrow and short implants. Diameter, length
and taper have to be considered together because of their interactive effects on crestal bone
strain. A wide and relatively long, untapered implant appears to be the most favourable choice.
Narrow, short implants with taper in the crestal region should be avoided, especially in low
REVIEW OF LITERATURE
Page | 19
Jingade et al (2005)38 used finite element method to detect the stress distribution in three
situations namely a) Comparison of stress distribution in a single implant with the narrow ceramic occlusal table and wide ceramic occlusal table, b) comparison of stress distribution in two implants supporting a three-unit bridge, one model with implants placed parallel to each other and the other with one implant placed in angular position to the other. c) Compare the difference in the stress distribution in six implants and four implants supporting mandibular over denture. The three-dimensional (3-D) finite-element mesh model was modelled with the standard dimension of the implant with 11mm long and 4mm. Result shows that the number of implant, design and placement of implant plays an important role in success of implant prosthetic treatment.
Xi ding et al (2009)82 analysed stress distribution in bone around implants of different
diameters on immediate loading. Three mandible models, embedded with thread implants (ITI,
Straumann, Switzerland) with diameters of 3.3, 4.1, and 4.8 mm, respectively were developed
using CT scanning and self-developed Universal Surgical Integration System software. Result
shows that when increase of implant diameter, stress and strain on the implant–bone interfaces
significantly decreased, especially when the diameter increased from 3.3 to 4.1 mm.
Siddharth Shelat et al (2011)75 investigated the effect of two different abutment types on
stress distribution in the bone around an implant under two loading conditions, vertical load
and combined load (vertical + angle of 45°). Implant of 4.2 × 12 mm2 was used. Two 2-piece
implant systems, Internal Hex and External Hex implant-abutment complex were used. The
implant-abutment complex was embedded in bone and subjected to static load of 100 N
vertically and a combined load (vertical + 45° angulation). Finite element analysis shows that
the maximum Von Mises stress occurred in the region of the compact bone under all loading
REVIEW OF LITERATURE
Page | 20 was observed at the boundary between compact and spongy bone because of relatively low
elastic modulus of spongy bone.
Saluja et al (2012)72 used finite element method to investigate the level of stress distribution
to maintain a strong and healthy bone. The design efficacy of the Indigenous titanium Dental
implant “INDIDENT” developed by INMAS was studied using finite element stress analysis.
Abacus software has been chosen for the analysis and the models are constructed as
three-dimensional Solid models. The boundary conditions for each case remains same. The amount
of load applied is equal for all the cases as 100 N. The study involved the modelling of mandible
and the dental implant meshed together. The stress generated was calculated by Finite element
method using Abacus software. The different parameters used in this study for FEA simulation
were stresses developed due to variation in length and diameter variation. The results indicated
that the stress concentration and distribution was not effect by the length variation of the
Implants. Stress concentration was same at the neck of hole and which can be reduced after
suitable chamfering of the hole. The stress distribution on the effect of diameter variation
indicates that if the diameter of implant was increased the contact surface also increases and
simultaneously stress pattern was reduced.
Mohapatra et al (2012)44 investigated the effect of implant design on the stress distribution in
the framework, implant, and surrounding bone, using a three-dimensional finite-element
analysis. Finite element model of a mandibular section of bone with implants placed in the first
and second premolar region was created to support a distal cantilever fixed partial denture.
Four models were created in this study. Result shows that showed that the maximum stress
overall was in the cervical portion of the secondary abutment. When used in combination, the
maximum stress was when the two-piece implant was used as secondary abutment. The
REVIEW OF LITERATURE
Page | 21 The maximum stress distribution in the bone was around the neck region of the secondary
implant.
Jayaraman et al (2012)37 observed the stress absorbed by the bone around mini over‑denture dental implant with and without acrylonitrile O‑ring under two different loading conditions. A three‑dimensional finite element analysis using Pro‑E mechanical finite element software was used to check the stress absorbed by the bone with and without acrylonitrile O‑ring. The implant and the mandible where modelled from the data obtained from C.T. scan and optical
projector using reverse engineering process. Two different loading conditions of 80 N and 220
N were determined and the analysis was done. The result showed at lower loads (80 N), there
was not much difference in the stress absorbed by the cancellous bone with or without
acrylonitrile O‑ring, but at higher loads (220), there was difference in the stress absorbed by the cancellous bone with (0.03508 MPa) and without acrylonitrile O‑ring (3.874 MPa) which showed that significant stress was absorbed by the acrylonitrile O‑ ring. This study proves that higher loads during para functional movement were absorbed by the acrylonitrile O‑ring increasing the success of the implants.
Hao-Sheng Chang et al (2013)31investigated the stress distributions in an implant, abutment,
and crown restoration with different implant systems, in various bone qualities, and with
different loading protocols using a dimensional finite element model. Eight
three-dimensional finite element models with 16 test conditions containing four types of dental
implants embedded in two different bone qualities (types II and IV) under 100-N axial and 30_
oblique loading forces were applied to analyse the stress distribution in the crown restoration,
abutment, abutment screw, implant, and supporting bone. Result shows that the von Mises
stresses in the cortical bone were mostly greater in the tissue-level implant (MK III) than in the
REVIEW OF LITERATURE
Page | 22 cancellous bone were mostly greater in the bone-level implant (Active) than in the tissue-level
implant (MK III) of the NobelBiocare system.
Stuart J McNally et al (2013)56 studied the effect on stress in bone with variable diameter
using finite element analysis. Dental implants that are 2.0 mm in diameter or smaller
(mini‑implant, small diameter implant) have been advocated as an acceptable alternative to conventional diameter implants (3.0‑5.0 mm diameter) for definitive oral restoration. A finite element analysis (FEA) study was designed to ascertain if reduction of implant diameter to 1.8
m would increase cervical bone stress and result in non‑physiologic stress in the investing bone. A finite element model of a 1.8 mm × 12 mm titanium implant was produced through
micro computed tomography scanner. Observation shows that the crestal bone stress was
increased and Von Mises stress (an average of 300 MPa) exceed the trabecular and cortical
bone yield stress of 100 MPa and 33 MPa respectively. The results indicate that, for implants
of 1.8 mm diameter, normal occlusal forces can induce stresses that are destructive to investing
bone.
Desai et al (2013)14 compare the stresses, strains, and displacements of double versus single
implant in immediate loading for replacing mandibular molar. Two 3D FEM (finite element
method) models were made to simulate implant designs. The first model used 5‑mm‑wide diameter implant to support a single molar crown. The second model used 3.75-3.75 double
implant design. Anisotropic properties were assigned to bone model. Each model was analysed
with single force magnitude (100 N) in vertical axis. This FEM study suggested that micro
motion can be controlled better for double implants compared to single wide‑diameter implants. The Von Mises stress for double implant showed 74.44% stress reduction compared
REVIEW OF LITERATURE
Page | 23 compared to 5mm implant. Within the limitations of the study, when the mesiodistal space for
artificial tooth is more than 12.5 mm, under immediate loading, the double implant support
should be considered.
Bholla et al (2014)8 analysed the biomechanical factors like angulation of the abutment that
may have a profound influence on the stress levels on bone for long-term function of
implant-supported prosthesis using FEA method. The model resembles the maxillary bone, and the
material properties similar to the bone are introduced in the model and clinical loading
conditions were simulated. Von mises stresses occurring for four angulated abutments (0, 15,
20, 25 degree) in compact and cancellous bone, thick and thin compact bone and subjected to
axial and combined loading. Result shows that Von Mises stresses (ΣEmax) were higher in the
cortical bone compared to the cancellous bone and were concentrated in the crestal (facial)
region in both types of bone. Von mises stress values of 0, 15 degree abutments in thin bone
and 0, 15, 20 degree abutments in thick bone were within the physiological remodelling zone.
Stress values for a 25 degree abutment in both types of bone were above the resorption limit.
Stress values were higher due to combined loading compared to axial loading irrespective of
the angulation or quality of bone present. Clinically, within a load of 178 N angulated
abutments up to 20 degrees can be placed in the anterior maxillary zone.
Pedram Iranmanesh et al (2014)34 investigated the effects of prosthesis material types on
stress distribution of the bone surrounding implants and to evaluate stress distribution in
three-unit implant-supported fixed dental prosthesis. A three-dimensional (3D) finite element fixed
dental prosthesis model of the maxillary second premolar to the second molar was designed.
Three load conditions were statically applied on the functional cusps in horizontal (57.0 N),
vertical (200N), and oblique (400N, θ = 120°) directions. Four standard framework materials
REVIEW OF LITERATURE
Page | 24 Result shows that the maximum of von Mises stress in the oblique direction was higher than
the vertical and horizontal directions in all conditions. In the bone-crestal section, the maximum
von Mises stress (53.78 MPa) was observed in PMMA within oblique load. In fixed dental
prosthesis, the maximum stress was generated at the connector region in all conditions.
Sarfaraz et al (2015)73 evaluated the stress distribution pattern in the implant and the
surrounding bone for a passive and a friction fit implant abutment interface and to analyse the
influence of occlusal table dimension on the stress generated. CAD models of two different
types of implant abutment connections, the passive fit or the slip‑fit represented by the Nobel Replace Tri‑lobe connection and the friction fit or active fit represented by the Nobel active conical connection were made. The implant and abutment complex was placed in cortical and
cancellous bone modeled using a computed tomography scan. This complex was subjected to
a force of 100 N in the axial and oblique direction. The results showed that overall maximum
Von Misses stress on the bone is significantly less for frictional fit than the passive fit in any
loading conditions stresses on the implant were significantly higher for the frictional fit than
passive fit. The narrow occlusal table models generated the least amount of stress on the
implant abutment interface.
Eazhil et al (2016)20 evaluated the impact of implant diameter and length on neighbouring
tissues around the implant. Tapared implants of different diameter and length were numerically
analysed using bone–implant models developed from computed tomography generated images
of mandible with osseointegrated implants. The impact of implant with various diameters on
stress distribution was examined using implants with a length of 13 mm and diameters of 3.5
mm, 4.3 mm and 5.0 mm. Implants with a diameter of 4.3 mm with lengths of 10 mm, 13 mm,
16 mm was developed to examine the impact of various implant length. Results shows that
REVIEW OF LITERATURE
Page | 25 there was statistically significant decrease in von Mises stress as the implant diameter
increased.
Gizem (2017)19 used finite element analysis to determine the implant location, number, and
diameter to support a maxillary implant supported overdenture. Three-dimensional models of
an atrophic maxilla, dental implants, and ball attachments were modelled, and different loading
conditions were applied to simulate realistic conditions. Six models with different numbers and
diameters of implants, including mini-dental implants and differently located implants, were
formed, and stress values were compared by implementing a finite element analysis. The study
showed that, as the implant number increased, decreased stress values were observed in
peri-implant bone and peri-implants in the maxillary peri-implant supported overdenture prosthesis.
However, changes in implant diameter had no significant effect on stresses. Increasing the
implant diameter was not advantageous; the use of mini-dental implants may be a viable
alternative method. However, using four implants for maxillary implant supported overenture
FINITE ELEMENT ANALYSIS
FINITE ELEMENT ANALYSIS METHODOLOGY
Page | 27 Finite element analysis method (FEA) allows detailed visualization of any kind of
structures that indicates about the distribution of stresses and displacements. FEA software
provides a wide range of simulation options for controlling the complexity of both modelling
and analysis of a system11. Similarly, the desired level of accuracy required and associated
computational time requirements can be managed simultaneously to address most
engineering applications. FEA which is an engineering method of calculating stresses and
strains in all materials including living tissues, teeth model, restorative materials and dental
implants for scientific checking, and validating the clinical assumptions. FEA is capable of
providing detailed quantitative data at any location within the mathematical model. Thus,
FEA has become a valuable analytical tool in dentistry. A more recent method of stress
analysis, generally developed in 1956 in the aircraft industry was the FEA77. This technique
was used widely only in aerospace engineering at first but slowly due to the flexibility of the
method to model any complex geometries and provide instant results, it made its presence felt
in dentistry in early 1970’s.
Software using for Finite element Analysis:
ANSYS
Adina
Free CAD
HYPERMESH
ABAQUS
CALCULIX
FINITE ELEMENT ANALYSIS METHODOLOGY
Page | 28
Application of finite element analysis in dentistry39:
Stress distribution in bone-implant interface
Stress distribution in bone using various design of implants
Stress analysis in prosthesis and implant interface
Stress analysis in abutment and screw of implant
Plastic and viscoelastic behaviours in materials
Tooth-to-tooth contact analysis
Contact analysis in implant structures
FEA has been used in orthodontics to study growth and development.
Interfacial stress in restorations
To study stress distribution on supporting structures in relation during designing of
fixed and removable prostheses
To investigate stress distribution during cavity preparation and root canal treatment in
endodontics.
Nonlinear simulation of periodontal ligament property
Steps involved in Finite Element Analysis:
1. Development of virtual geometric model
2. Import the VGM in ANSYS workbench
3. Applying of material properties to the three dimensional models
4. Co-ordinate system (Three dimensional axis)
5. Establishing contacts between the models
6. Meshing of models
7. Boundary conditions
8. Application of loads
FINITE ELEMENT ANALYSIS METHODOLOGY
Page | 29
Methodology:
1. Development of the geometric model
The first step before an FEA model can be obtained is the creation of a virtual geometry
model (VGM). Usually VGM are created by several software, some of them are:
Creo parametric by PTC
Solid works by Dassault systems
Auto CADD mechanical by Autodesk
Auto CADD Inventor by Autodesk
In this study Creo 2.0 parametric by PTC is used for modelling and assembling of model
structures.
2. Import the VGM in ANSYS workbench
After generation of virtually designed models it is imported in the ANSYS workbench
software for analysis.
3. Applying of material properties to the three dimensional models:
Engineering data is the material property applied to the three dimensional models that
convert the models into objects. In this study Young’s modulus and poisons ratio are applied
to the models. In general, material behaviour can be classified into five categories: Nonlinear
elastic phenomena (return to original conditions after deformation, not following a specific
pattern), plastic phenomena (deformation without return to original conditions), elastoplastic
phenomena (partly elastic and partly plastic behaviour), viscoelastic phenomena (return to
original conditions after deformation is time-dependent), and viscoplastic phenomena
(time-dependent deformation without return to original conditions). Material properties greatly
influence the stress and strain distribution in a structure. These properties can be modelled in
FEA as isotropic, transversely isotropic, orthotropic and anisotropic. In most reported studies,
FINITE ELEMENT ANALYSIS METHODOLOGY
Page | 30 classification is based on the mechanical properties of a material in relation to the directions
of each of the axes (X, Y and Z).
Isotropic materials are defined as those that present the same properties in every direction.
Anisotropic materials are defined as the materials with properties that are different along all
the directions.
Orthotropic materials are defined as the properties of materials are same in two direction
and different in the third direction.
4. Co-ordinate system (Three dimensional axis):
Three dimensional axis (X, Y, Z axis) will be assigned by the software. This is an
important step because, visualization of the model by rotation, zoom, pan options. This step is
used also for application of loads in particular or multiple axis and certain angulations for
analysis and interpretation of result.
5. Establishing contacts between the models:
Contact between the models decides the stress distribution though the applied force. In
ANSYS workbench, types of contacts are bonded, frictional, frictionless, force frictional
sliding, rough, no separation. Type of contact between the models decides the movement of
the models while mathematical analysing by the solver. Results will vary according to the
contact establishment.
6. Meshing of models:
Once the Virtual geometry model has been obtained and establishment of contacts it
should be processed to generate the finite element mesh, several software options are
currently available and can be used for FEA mesh generation, with satisfactory results,
particularly ANSYS (Swanson Analysis Systems, Houston, PA,USA) and MSC/Nastran
(MSC Software Corporation, SantaAna, CA, USA). The finite element mesh comprises
FINITE ELEMENT ANALYSIS METHODOLOGY
Page | 31 different geometric shapes – triangle, tetrahedrons and hexahedrons (most commonly the
latter two). The quadrilaterals used in mesh generation are connected by nodes, resulting in a
complex 2D or 3D net, which allows the transport of mathematical equations between the
coordinates.
7. Boundary Conditions:
Zero displacement constraints must be placed on some boundaries of the model to ensure
an equilibrium solution. The constraints should be placed on nodes that are far away from the
region of interest to prevent the stress or strain fields associated with reaction forces from
overlapping with each other. Fixed support is used as a boundary condition in this study.
8. Application of loads:
Load (Force) was applied in particular axis or multiple for results generation. In this study
Three forces are applied to the implant model. They are
Axial load 100N
Non-axial (buccolingual) load 50N
Non-axial (mesiodistal) load 50N
9. Analysis and evaluation of results:
Once force and time properties have been properly defined, the software performs a
series of calculations by mathematical equations and yields the simulation results. These are
presented according to a colour scale where each shade represents a different degree of
Materials
and
MATERIALS AND METHODS
Page | 33
MATERIALS USED IN THIS STUDY:
CBCT scan of a patient with edentulous mandible
Computer with higher end configuration for faster processing of data.
Software:
Carestream 3D imaging
Corel Draw X7
Creo 2.0 parametric by PTC
Workbench V17.0 by ANSYS
METHODOLOGY:
Steps involved in finite element method are:
I. Finite element modelling (CREO 2.0 Parametric by PTC)
Construction of geometric model
a. Modelling of the bone
b. Modelling of implants with abutment
c. Preparation mould space in cortical and cancellous bone model
d. Assembling of bone models and implant model with abutment
II. Finite element analysis (Workbench 17.0 By ANSYS)
1. Import designed three dimensional model in workbench by ANSYS
2. Applying of material properties to three dimensional models
3. Co-ordinate system (Three dimensional axis)
4. Establishing contacts between the models
MATERIALS AND METHODS
Page | 34 6. Boundary conditions
7. Application of loads
8. Analysis of results
a. Equivalent Von Mises stress
b. Equivalent Von Mises strain
I. Finite element modelling: (CREO 2.0 Parametric by PTC)
Construction of geometric model:
a. Modelling of bone:
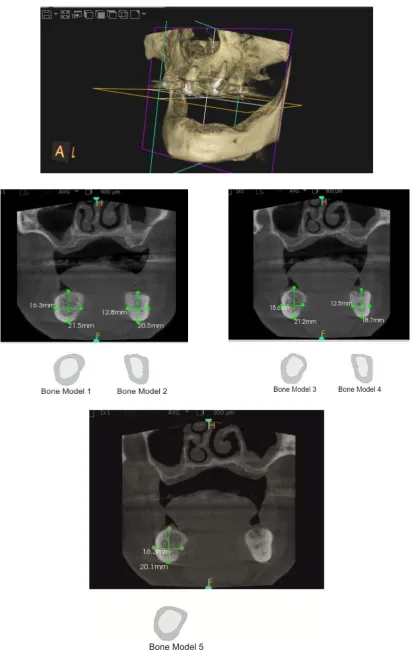
CBCT scan of patient with completely edentulous mandible was taken. The
scanned file was opened as DICOM frames in Carestream 3D imaging, in that
software frontal view, coronal view, 3D view, sagittal view were seen. In frontal
view, five regions in the posterior region of the mandible were chosen and that
regions shows both cortical bone and cancellous bone layers respectively. These
regions in the image are drawn as two dimensional layers with the same dimension
and shape using Corel draw X7.0 software (Fig. 1) these two dimensional sketches
were imported to creo 2.0 parametric software and by using extrude command 3D
cortical and cancellous three dimensional bone models was generated. The generated
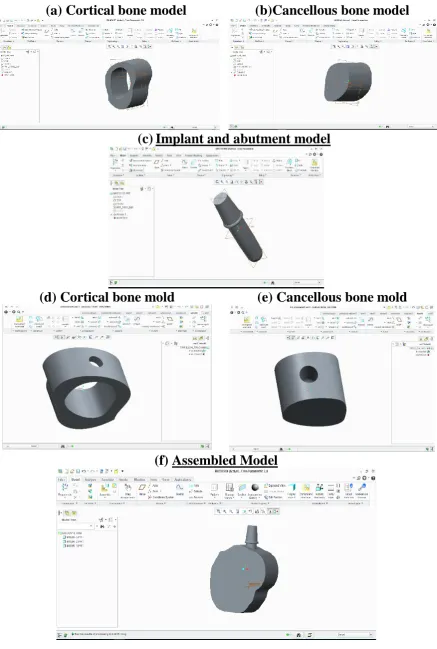
models were saved as (.PRT) files. (Fig. 2)
b. Modelling of implant and abutment:
Nobel replace select tapered implant and tri channel narrow and regular platform
abutment was chosen with diameter and length 3.5x10mm, 4.3x10mm, 3.5x11.5mm
and 4.3x11.5mm. The implant considered was tapered type which is straight parallel
MATERIALS AND METHODS
Page | 35 prepared by using measuring instruments like vernier calliper and screw gauge.
These measurements are builds as models feature by feature. Implant and abutment
are modelled together not separately because the analysis was made only in bone
and implant. Options used for creating 3D implant models are Boolean operations,
revolve, extrude etc. the modelled implants were saved as (.PRT) files.
c. Preparation mould space in cortical and cancellous bone model:
By taking the modelled implant as reference, moulds were created in cortical bone
with respective cancellous bone. Likewise (5 bone sets X 4 implants) 20 cortical
bone with the respective cancellous bone moulds are generated. The moulds were
saved as (.PRT) files separately. (Fig. 2)
d. Assembling of bone and implant model with interface
The moulds of cortical bone with the respective cancellous bone and implant were
assemble as .ASM file. This assemble file was exported as (.IGES) file format. Like
this way 20 (.IGES) file 3d assembly models were created. (Fig. 2)
II. Finite element analysis (Workbench 17.0 By ANSYS)
1. Import designed three dimensional model in workbench by ANSYS
Generated three dimensional assembled models were imported in the workbench
software.
2. Applying of material properties to three dimensional models
For the execution and accuracy of the programme and interpretation of the results,
two material properties were utilized i.e. young’s modulus and poisons ratio. The
cortical bone, cancellous bone and implant with abutment presumed to be linearly
elastic, homogenous and isotropic. Although cortical bone has anisotropic material
characteristics and possesses regional stiffness variation, they were modelled
MATERIALS AND METHODS
Page | 36 principle axis of anisotropy. The corresponding elastic properties such as Young’s
modulus ( and poisson’s ratio ( of cortical bone, cancellous bone and implant were
determined according to literature survey.
Table 1 shows the material properties applied to the cortical bone model, cancellous
bone model and implant model.
Table 1: Mechanical properties of different material used in the model
Material Young’s modulus(
(MPa)
Poisson’s ratio ( Reference
Cortical bone 13000 0.30 9,71
Cancellous bone 690 0.30 9,71
Implant (Titanium) 102000 0.35 9,71
3. Co-ordinate system (Three dimensional axis)
Workbench generates the three dimensional axis (X, Y, Z) for visualization of model
and application of load in particular axis. (Fig. 3)
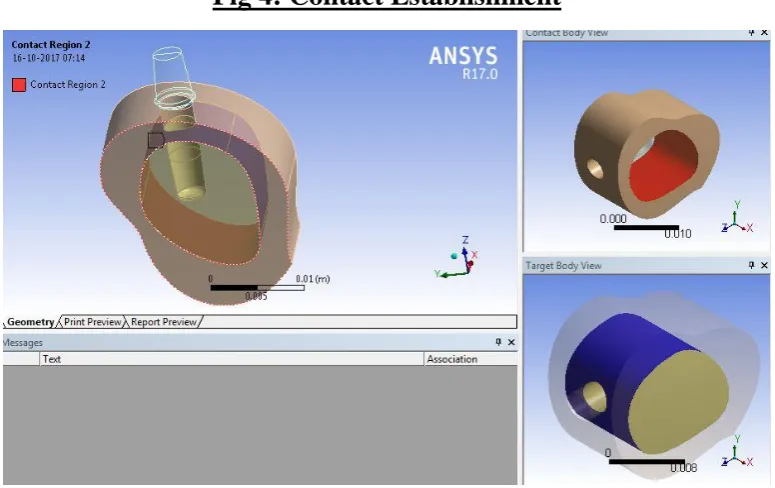
4. Establishing contacts between the models
Contact between the models are given in table 2 (Fig. 4)
Table 2: Contact Type between the Three Dimensional Models
Materials
Cortical bone Cancellous bone ImplantCortical bone -- Bonded Frictional
Cancellous bone Bonded -- Frictional
MATERIALS AND METHODS
Page | 37
5. Meshing of models
After contact establishment between three dimensional models are meshing was done.
Type of mesh was used in this study is FINE type, for interpretation of more accurate
results. (Fig. 5)
6. Boundary conditions
Constraints were applied on the distal end of the model in all three axes and omitting
support at the bottom permitted bending of the model. These aspects make the model
more realistic representation of the clinical situation (Fig. 6)
7. Application of loads
The magnitude of applied loads was within physiologic limits and direction of
application of the loads simulated the clinical conditions. Loads are directly applied
onto the abutment. The prosthesis was not modelled for ease of fabrication of model
and also for simplification of interpretation of results. The loads applied are shown in
table 3: (Fig. 7)
Table 3: Load (force) and magnitude
Load
Magnitude
Axial 100 N
Non-axial (Bucco Lingual) 50 N
Non-axial (Mesio Distal) 50 N
8. Analysis and results:
These 20 models were analysed by post processor i.e. solver and results were
displayed in the form of colour coded maps using von mises stress and strain
MATERIALS AND METHODS
Page | 38 ductile materials. Metallic implants failure occurs when the von mises stress values
exceed the yield strength of an implant material. Von mises stress are most
commonly reported in FEA studies to summar