DEVELOPING STRATEGY EVALUATION METHOD VIA STRATEGIC
CONTROL SYSTEM BASED RISK ASSESSMENT
Emin Başar Baylan,
(PhD)Istanbul Commerce University, Turkey
Received: Feb. 19, 2018 Accepted: April. 12, 2018 Published: June 1, 2018
Abstract
:In strategic planning process, strategy alternatives have to be evaluated properly to select best one to achieve strategic goals. During the evaluation process strategy alternatives are compared and measured according to their probable performance on their related strategic target. Risk, cost, feasibility, effect on performance target and implementation time are the main parameters which reflect performance of strategy. In this study, risk aspect is analyzed with a consecutive approach while evaluating a particular strategy in terms of the effect on performance targets. After this analysis, strategic control model based strategy evaluation technique is developed to assess the risk level of particular strategy and it is illustrated by an application.
1.
Introduction
Strategic management process has four parts. Strategic planning is the first part which contains vision, SWOT analysis, corporate values, strategic goals, strategic targets, performance targets. Technically, these statements are determined by strategic planning team which consists of top and medium level managers. Second step is constructing organization structure which is capable to implement strategic plan. Organization design process involves coordinating the relationship between human and human, human and work, work and work. Organizational structure and hierarchy is edited according to work and human relationships. Third step is implementing the selected strategies by motivating the edited corporate organization. Last step of strategic management process is strategic control which is maintained to make assessment about performance of selected strategies. This control system provides a dashboard that represents attitude of strategies performing. According to observation of control process, sometimes process strategies should be abandoned or should be improved or should be passed to another.
In literature, it is seen that strategy selection process is maintained by comparing strategy alternatives with each other according to their aspects. Generally, these measurement parameters are consistency, consonance, advantage and feasibility(Rumelt,1993).
• Consistency: Strategies have to be fit with other strategic plan parameters. Strategic plan has hierarchic structure. It includes vision statement, strategic goals, and strategic targets. Selected strategies must not contradict with these macro decisions. Otherwise strategies do not help achieving the vision of foundation.
• Consonance: Analysis part of strategic plan uses the information of internal and external environment of foundation. SWOT analysis is made according to these information. However; after the strategic plan made, internal and external environment condition go on to change. Therefore, strategies are to selected among flexible ones. Namely, strategies must reply environmental changes.
• Advantage: Strategies are developed to gain benefit for company. The term “benefit” means in this terminology is gaining competitive advantage while reaching the vision of plan. Strategies have to be useful for foundations(Rumelt,1993).
In strategic planning context, control of reaching strategic targets (whether or not) is made by performance indicators and their reference values. Technically, strategies are also evaluated according to these items.
Strategic Target
Strategy Alternative 1
Strategy Alternative 2
Strategy Alternative 3
Performance Target 1
Performance Target 2
Performance Target 3
Performance Target 4
Actually, strategic control procedure and strategy evaluation for selection process have a theoretical link because in strategy selection process, experts try to predict the future impact of strategy alternatives on performance indicators. While this prediction process, expert’s makes intuitive forward strategic control. They foresight every future aspect of strategic plan parameters. For example; once a strategy is selected for a strategic target, it means that it’s the best alternative for related strategic target according to current situation (which is easier to make comment). When it comes to future situation, things may go harder. Because strategy risks become to be active in the future. Technically, these risks could be named as strategy input risks, strategy implementation process risks, strategy output risk(Mirze,2010).
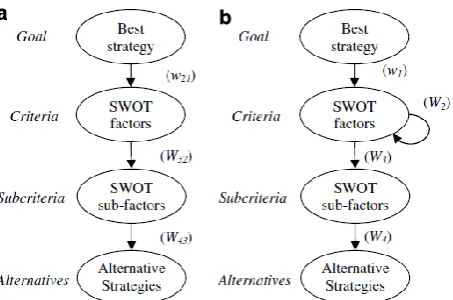
On the other hand, with the beginning of this century strategy multi-criteria decision methods are begun to use for strategy assessment process. First application is using AHP (Analytic Hierarchic Process) which is a multi-criteria decision making method for strategy selection. They construct a hybrid method by combing SWOT analysis and AHP method(Kajanus and others, 2003). They applied this method to tourism management. In 2005, this method is used for chemical industry to make decision about which product to invest. First they make a proper SWOT analysis and according to that they evaluate their alternative product to invest on(Taşkın and Güneri, 2005). In 2007, Osuna and Aranda examine interaction between AHP and SWOT analysis. They investigate for different combinations to create a novel mathematical method. They perform their mathematical model to a medical service firm(Osuna and Aranda, 2007). AHP method can be only used for hierarchical models. In fact, in real life multi-criteria decision models are sometimes need to be constructed as network structure. In 2007, Yüksel and Dağdeviren develop a network structure decision model the prioritize SWOT factors and strategies of a textile firm(Yüksel and Dağdeviren, 2007).
Figure 1. (a) The hierarchical representation of the SWOT model.
TOPSIS method is another multi-criteria decision making method. It has more analytic view then AHP and ANP methods. In 2011, Iranian researchers construct a decision model which combines fuzzy TOPSIS method and SWOT analysis. In their approach, they first apply SWOT analysis then they evaluate SWOT information and strategy information by TOPSIS method. This method do not use pairwise comparisons, so that provides a quantitative decision support(Ghorbani and others, 2011). Iranian mining industry is analyzed by researchers. They use SWOT-ANP hybrid method. With this method they asses six strategies(Fouladgar and others, 2011).
Those methods above are analytic strategy assessment methods but they are not related with strategic control approach or risk integrated model. In this article, a novel strategy evaluation method is proposed which integrates strategic control concept and risk assessment with decision tree method.
2. Development of Risk Control Based Strategy Evaluation Method
During strategy selection process, strategy alternatives are evaluated according to their important aspects. These are implementation time, cost, feasibility and risk. Strategy risk is a very distinguishing factor because it influences other aspects (Zavadskas and Turskis, 2017). If risks occur about particular strategy, implementation time might delay, cost of strategy might increase and also feasibility of strategy could be endanger. For this reason, in this study strategy risks are considered while implementing strategy evaluation. For a particular strategy risks occur at three circumstance. First, risks may occur before performing the strategy. These problems are about materials, technological and human resources which is needed to implement the strategy. Namely, these are strategy input risks. Second level risks are strategy process risks. Occasionally, strategy inputs contains no risk but while implementation process problems may occur. Sources of these risks are misunderstanding of strategy, lack of motivation and knowledge, poor method usage ability. Third level risks are strategy output risks (Siddique and Shadbolt, 2016). These risks can only be observed after implementation process. Strategy input risks and strategy implementation risks directly influence this type of risks. As a formal definition, strategy output risks are the probability not reaching performance targets. In some conditions, actually, it is impossible to eliminate this type of risks. Because environmental factors continues to change during strategic plan implementation, this causes lack of achieving performance targets. These targets also indicates level of success.
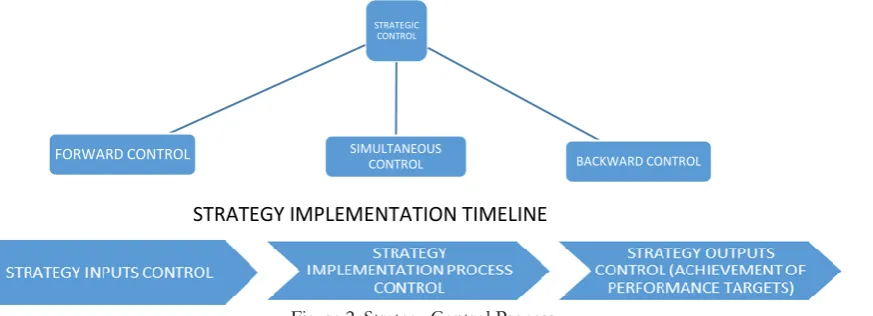
Figure 2. Strategy Control Process
In the proposed method, strategic control system is integrated with risk assessment. This integration process is conducted with decision tree method. Decision tree is a model which represents conditional probabilities of successive events. It illustrates the probabilities in a tree form. The prior probabilities are in the first column and conditional probabilities are located in the second column(if there is more, it can go further from second column). These are inputs of decision tree model. Multiplying each probability in the first column by a probability in the
STRATEGIC CONTROL
SIMULTANEOUS
CONTROL BACKWARD CONTROL
FORWARD CONTROL
second column and results are written in the third column. Each joint probability become the numerator in the calculation of the corresponding posterior probability in the fourth column. Cumulating the joint probabilities with the same finding provides the denominator for each posterior probability with this finding(Hillier and Lieberman, 2015).
Figure 3 Decision tree diagram example (Hillier and Lieberman, 2015)
In this novel strategy evaluation process, decision tree is used to create link concept between strategic control and strategy risk. Strategy control phases are assumed as probability columns of model. First column is forward control, second column is simultaneous process control and the third column is backward control. Probability risks which are emerged by control processes are probability inputs of decision tree model. To apply this method properly, strategy input risks, strategy process risks and performance targets of related strategic targets are to listed. Their risk occurrence probability is derived by a decision tree. After all, their effects on performance targets are calculated.
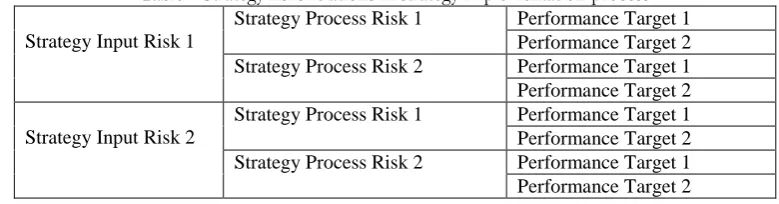
Table 2 Strategy risks relations in strategy implementation process
Strategy Input Risk 1
Strategy Process Risk 1 Performance Target 1
Performance Target 2
Strategy Process Risk 2 Performance Target 1
Performance Target 2
Strategy Input Risk 2
Strategy Process Risk 1 Performance Target 1
Performance Target 2
Strategy Process Risk 2 Performance Target 1
Performance Target 2
According to table, if no strategy input risk and strategy process risk occur, selected strategy make reach the foundation to the desired performance targets. On the other hand, input risks may trigger process risks and also process risks trigger risk of not reaching performance targets. At the end of strategy implementation process desired performance targets are influenced by precedence risks. Decision tree method provides benefit us at that point.
Oil (0.25)
FSS,given Oil(0.2) 0.25(0.6)=0.15 Oil and Gas
0.15/0.3=0.5 Oil,given FSS
USS,given Oil(0.4) 0.25(0.4)=0.1 Oil and USS
0.1/0.7=0.14 Oil,given USS
Dry (0.75)
FSS,given Dry(0.2) 0.75(0.2)=0.6 Dry and FSS
0.15/0.3=0.5 Dry,given FSS
USS, given Dry(0.8) 0.75(0.8)=0.6 Dry and USS
Figure 4. Link between strategy level, strategy input risk, strategy process risk and performance targets
This evaluation process can be conduct for each strategy which must be evaluated.
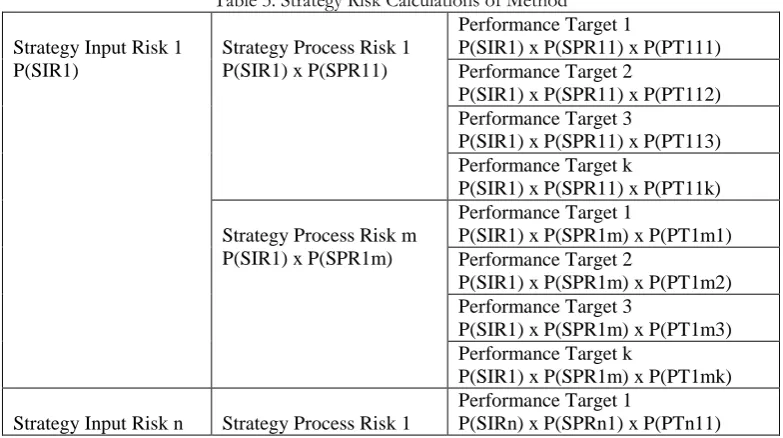
∑𝑛𝑖=1𝑃(𝑆𝐼𝑅𝑖) = 1 ∑𝑛𝑖=1∑𝑚𝑗=1𝑃(𝑆𝑃𝑅𝑖𝑗) = 1
P(SIR) and P(SPR) are probability values of risks that might occur.
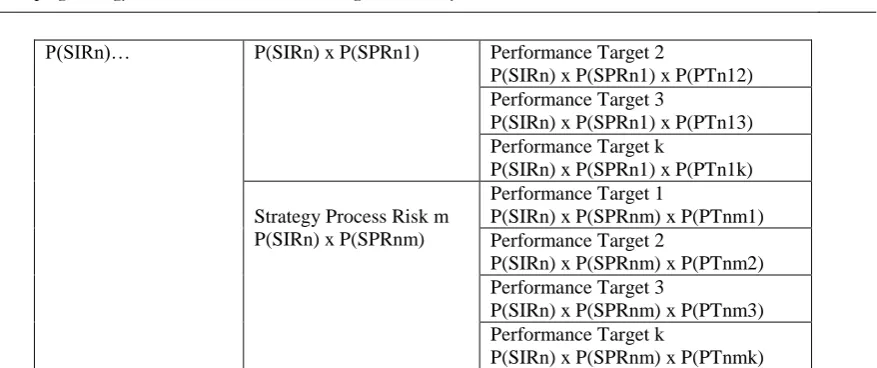
Table 3. Strategy Risk Calculations of Method
Strategy Input Risk 1 P(SIR1)
Strategy Process Risk 1 P(SIR1) x P(SPR11)
Performance Target 1
P(SIR1) x P(SPR11) x P(PT111) Performance Target 2
P(SIR1) x P(SPR11) x P(PT112) Performance Target 3
P(SIR1) x P(SPR11) x P(PT113) Performance Target k
P(SIR1) x P(SPR11) x P(PT11k)
Strategy Process Risk m P(SIR1) x P(SPR1m)
Performance Target 1
P(SIR1) x P(SPR1m) x P(PT1m1) Performance Target 2
P(SIR1) x P(SPR1m) x P(PT1m2) Performance Target 3
P(SIR1) x P(SPR1m) x P(PT1m3) Performance Target k
P(SIR1) x P(SPR1m) x P(PT1mk)
Strategy Input Risk n Strategy Process Risk 1
Performance Target 1
P(SIRn) x P(SPRn1) x P(PTn11)
Strategy
Process
Risk
Strategy
Input
Risks
Strategy
Level
Evaluated Strategy
Strategy Input Risk 1 Probability of Occurance
Strategy Process Risk1
Performance target 1
Performance Target 2
Performance Target k Strategy Pocess Risk2
Strategy Process Risk m Strategy Input Risk 2
Probability of Occurance
P(SIRn)… P(SIRn) x P(SPRn1) Performance Target 2
P(SIRn) x P(SPRn1) x P(PTn12) Performance Target 3
P(SIRn) x P(SPRn1) x P(PTn13) Performance Target k
P(SIRn) x P(SPRn1) x P(PTn1k)
Strategy Process Risk m P(SIRn) x P(SPRnm)
Performance Target 1
P(SIRn) x P(SPRnm) x P(PTnm1) Performance Target 2
P(SIRn) x P(SPRnm) x P(PTnm2) Performance Target 3
P(SIRn) x P(SPRnm) x P(PTnm3) Performance Target k
P(SIRn) x P(SPRnm) x P(PTnmk)
3. Application of Risk Control Based Strategy Evaluation Method
Karaca Elektrik is a company which produce power generators. They have continuous production system. They suffer from some quality problems which are sourced from level of employee ability. Therefore, they tend to increase know-how level of their employees and technicians. They think of two strategy alternatives. One is establishing an employee training program and the other is recruiting new technicians and employees. To evaluate two strategy alternatives they perform Risk Control Based Strategy Evaluation Method. Each strategy has own strategy input risks and strategy process risks. With their risks, both strategy contribute performance target at different levels. If they conduct “Employee and technician training strategy” they may have some problems about finding a good trainer. Besides that; due to work intensity some employees and technicians might not have properly participate the training program. During the training period; there is a probability that production rate may decrease. Technically it causes stock outs. Effectiveness of training is another risk. Normally, at the end of training program, employees and technicians have to come the desired level. These risk have negative effects on reaching performance targets. Second strategy alternative has also risks. Recruiting well-educated technicians and employees requires big amount of financial resource. Financing these new personnel may cause some financial risks. Before hiring new personnel, skills of prospective personnel must be clearly defined. Also it has to be make sure that there are some people outside who can fit these requirements. Namely, there is a risk that nobody or insufficient people apply for these jobs. After hiring new personnel, two different risk may occur, one is likelihood of not adapting the new job and other one is likelihood of not adapting the older personnel. Risks of second strategy also have effect on reaching performance target.
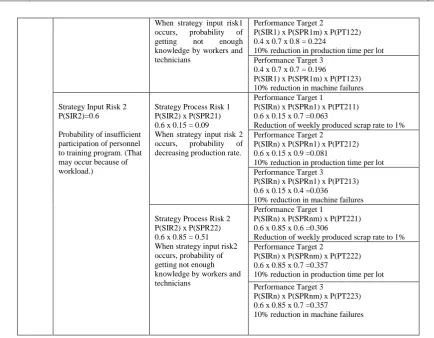
Table 4. Risk Analysis of "Employee and Technician Training Strategy"
"Em p lo ye e a n d T ec h n ic ia n T ra in in g S tra te g y"
Strategy Input Risk 1 P(SIR1) =0.4
Probability of employing the insufficient trainer for education program
Strategy Process Risk 1 P(SIR1) x P(SPR11) 0.4 x 0.3 = 0.12
When strategy input risk1
occurs, probability of
decreasing production rate during training program continuing.
Performance Target 1
P(SIR1) x P(SPR11) x P(PT111) 0.4 x 0.3 x 0.9 =0.108
Reduction of weekly produced scrap rate to 1% Performance Target 2
P(SIR1) x P(SPR11) x P(PT112) 0.4 x 0.3 x 0.6 =0.072
10% reduction in production time per lot Performance Target 3
0.4 x 0.3 x 0.7 =0.084
P(SIR1) x P(SPR11) x P(PT113) 10% reduction in machine failures
Strategy Process Risk 2 P(SIR1) x P(SPR12) 0.4 x 0.7 = 0.28
Performance Target 1
P(SIR1) x P(SPR1m) x P(PT121) 0.4 x 0.7 x 0.5 =0.14
When strategy input risk1
occurs, probability of
getting not enough
knowledge by workers and technicians
Performance Target 2
P(SIR1) x P(SPR1m) x P(PT122) 0.4 x 0.7 x 0.8 = 0.224
10% reduction in production time per lot Performance Target 3
0.4 x 0.7 x 0.7 = 0.196
P(SIR1) x P(SPR1m) x P(PT123) 10% reduction in machine failures
Strategy Input Risk 2 P(SIR2)=0.6
Probability of insufficient participation of personnel to training program. (That may occur because of workload.)
Strategy Process Risk 1 P(SIR2) x P(SPR21) 0.6 x 0.15 = 0.09 When strategy input risk 2
occurs, probability of
decreasing production rate.
Performance Target 1
P(SIRn) x P(SPRn1) x P(PT211) 0.6 x 0.15 x 0.7 =0.063
Reduction of weekly produced scrap rate to 1% Performance Target 2
P(SIRn) x P(SPRn1) x P(PT212) 0.6 x 0.15 x 0.9 =0.081
10% reduction in production time per lot Performance Target 3
P(SIRn) x P(SPRn1) x P(PT213) 0.6 x 0.15 x 0.4 =0.036
10% reduction in machine failures
Strategy Process Risk 2 P(SIR2) x P(SPR22) 0.6 x 0.85 = 0.51 When strategy input risk2 occurs, probability of getting not enough knowledge by workers and technicians
Performance Target 1
P(SIRn) x P(SPRnm) x P(PT221) 0.6 x 0.85 x 0.6 =0.306
Reduction of weekly produced scrap rate to 1% Performance Target 2
P(SIRn) x P(SPRnm) x P(PT222) 0.6 x 0.85 x 0.7 =0.357
10% reduction in production time per lot
Performance Target 3
P(SIRn) x P(SPRnm) x P(PT223) 0.6 x 0.85 x 0.7 =0.357
10% reduction in machine failures
Table 5. Risk Analysis of "Employee and Technician Training Strategy"
“Re cr ui tin g ne w w el l-ed u ca te d t ec h n ,c ,a n s a n d e m p lo ye es st ra te gy ”
Strategy Input Risk 1 P(SIR1) = 0.7
Probability of not having enough financial resource to employ new personnel
Strategy Process Risk 1 P(SIR1) x P(SPR11) 0.7 x 0.7 =0.49
When strategy input risk1
occurs, probability of
having not enough
adaption to older personnel
Performance Target 1
P(SIR1) x P(SPR11) x P(PT111) 0.3 x 0.7 x 0.8 =0.168
Reduction of weekly produced scrap rate to 1% Performance Target 2
P(SIR1) x P(SPR11) x P(PT112) 0.3 x 0.7 x 0.7 = 0.147
10% reduction in production time per lot Performance Target 3
P(SIR1) x P(SPR11) x P(PT113) 0.3 x 0.7 x 0.7 =0.147
10% reduction in machine failures
Strategy Process Risk 2 P(SIR1) x P(SPR12) 0.7 x 0.3 =0.21
When strategy input risk 1
occurs, probability of
having not enough
adaption to their new job
Performance Target 1
P(SIR1) x P(SPR1m) x P(PT121) 0.3 x 0.3 x 0.7 =0.063
Reduction of weekly produced scrap rate to 1% Performance Target 2
P(SIR1) x P(SPR1m) x P(PT122) 0.3 x 0.3 x 0.6 = 0.054
Performance Target 3
P(SIR1) x P(SPR1m) x P(PT123) 0.3 x 0.3 x 0.7= 0.063
10% reduction in machine failures
Strategy Input Risk 2 P(SIR2)= 0.3 Probability of missdetermining qualifications of new staff
Strategy Process Risk 1 P(SIR2) x P(SPR21) 0.3 x 0.2 =0.06
When strategy input risk 2
occurs, probability of
having not enough
adaption to older personnel
Performance Target 1
P(SIRn) x P(SPRn1) x P(PT211) 0.1 x 0.1 x 0.7 =0.003
Reduction of weekly produced scrap rate to 1% Performance Target 2
P(SIRn) x P(SPRn1) x P(PT212)
0.1 x 0.1 x 0.7 =0.007
10% reduction in production time per lot
Performance Target 3
P(SIRn) x P(SPRn1) x P(PT213)
0.1 x 0.1 x 0.6 =0.006
10% reduction in machine failures
Strategy Process Risk 2
P(SIR2) x P(SPR22)
0.3 x 0.8 =0.24
When strategy input risk2
occurs, probability of
having not enough
adaption to their new job
Performance Target 1
P(SIRn) x P(SPRnm) x P(PT221)
0.3 x 0.6 x 0.7 =0.126
Reduction of weekly produced scrap rate to 1%
Performance Target 2
P(SIRn) x P(SPRnm) x P(PT222)
0.3 x 0.6 x 0.7 =0.126
10% reduction in production time per lot
Performance Target 3
P(SIRn) x P(SPRnm) x P(PT223)
0.3 x 0.6 x 0.6 =0.108
10% reduction in machine failures
4. Results and Conclusion
In application part of article, two different strategies processed with Risk Control Based Strategy Evaluation Method. It is observed that each three different performance targets has different probability of occurrence. When probability of occurrence performance targets are added up, first strategy (Employee and technicians training strategy) allows totally 61.7% probability for “Reduction of weekly produced scrap rate to 1%” performance target, allows totally 73.4% probability for “10% reduction in production time per lot” performance target and allows 67.3% probability for “10% reduction in machine failures” performance target. Second strategy alternative which is “Recruiting new well-educated technicians and employees strategy” has less performance according to foresight of experts and rules of the novel method. This strategy alternative allows totally 36% probability for “Reduction of weekly produced scrap rate to 1%” performance target, allows totally 33.4% probability for “10% reduction in production time per lot” performance target and allows totally 32.4% probability for “10% reduction in machine failures” performance target. When results are examined, it is obvious that “Employee and technicians training strategy” is better choice for reaching performance targets.
References
Rumelt, R. P. (1993). Evaluating Business Strategy. Mirze, K. (2010). İşletme. İstanbul: Ömür Matbaacılık.
Hillier, F., & Lieberman, G. (2015). Introduction to Operations Research (Tenth Edit). New York: Mc-Graw-Hill. Lepkova, N., Zavadskas, E. K., & Turskis, Z. (2017). Integrated group fuzzy multi-criteria model : Case of facilities management strategy selection. Expert Systems With Applications, 82, 317–331. http://doi.org/10.1016/j.eswa.2017.03.072
Siddique, M. I., & Shadbolt, N. (2016). Strategy Implementation Literature Review. Lincoln University, Massey University. New Zeland.
Kajanus, M., Kangas, J., & Kurttila, M. (2004). The use of value focused thinking and the A’WOT hybrid method in tourism management. Tourism Management, 25(4), 499–506. http://doi.org/10.1016/S0261-5177(03)00120-1 Taşkın, A., & Ali Fuat Güneri. (2005). STRATEJİ GELİŞTİRMEDE A’WOT HİBRİT METODU KULLANIMI VE TÜRK KİMYA SEKTÖRÜNDE BİR UYGULAMA ÇALIŞMASI Alev. In V. Ulusal Üretim Araştırmaları Sempozyumu, İstanbul Ticaret Üniversitesi, 25-27 Kasım 2005 STRATEJİ (pp. 1–16).
Osuna, E. E., & Aranda, A. (2007). Combining SWOT and AHP Techniques For Strategic Planning. Isahp, 1–8. Yüksel, I., & Daǧdeviren, M. (2007). Using the analytic network process (ANP) in a SWOT analysis - A case study for a textile firm. Information Sciences, 177(16), 3364–3382.http://doi.org/10.1016/j.ins.2007.01.001
Ghorbani, M., Velayati, R., & Ghorbani, M. (2011). Using Fuzzy TOPSIS to Determine Strategy Priorities by SWOT Analysis. Proceedings of the International …, 11, 135–139. Retrieved from http://www.ipedr.com/vol11/26-R10044.pdf