AnearchReportNo. 101 JuIy,1985
Measured Crop Per/onnance
SMALL GRAIN
1985
D. T. BOWMAN, Assistant Professor In Charge of Variety Testing
Department of Crop Science
NORTH CAROLINA STATE UNIVERSITY
TABLE OF CONTENTS
INTRODUCTION ...•..•...•.... , ..•.•...••...
COMPARING VARIETIES ..•...•...•...•.•..•...••...••... 2
EXPERIMENTAL PROCEDURE ...•..•...•..•...
6Entri es ...•.•.•••....••••.••.••••.••....••••••••••...• 6
Field Plot Design •••..••••.••••.••••.••..•.•••••••...•.•
6Crop Management ...•••.••.•....••••••••••••••••.•...••..••••
7Agencies Sponsoring Entries •..••.•.••....•••.••••.•••••....••
11Cooperators
11SEASONAL CONDITIONS ...••..••...•...•...•.••.•....•..••...
1.2DATA •...•....•..•...•...•...•...•.•.•.•••....•...
13RESULTS
ANDDISCUSSION ..••..••...•....••..•..••..••...•.
15
Bar
1ey ...,... 15
Oats ...••.••••.•..•.••.••.••••••••.••••••••.••.••..•..•....•• 15
Wheat .••.••••••••.•••..•...•.•.•••••.•••••••••••••••.•...•••. 16
TABLES
1.
Characteristics of barley varieties ••••••••••••••••••.••.•••
4
2.
Characteristics of oat varieties •.•••••••••••.•••••••••••••. 4
3.
Characteristics of wheat varieties .•••••••
~••.••••••••••••••
5
4.
Cultural practices for small grain
tests~1984-85 .•.••.•••••. 9
5.
Soil test results •.••.•••••.••••••••••••••••••.•••.•...•••.• 10
6.
Summary of barley performance trials across the state .••••.• 18
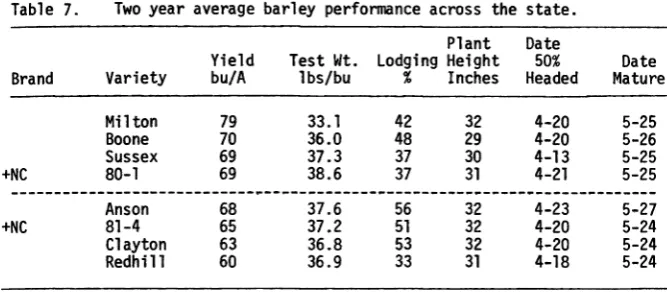
7• Two year average barley perfonnance across the state •••.•••• 19
8.
Three year average barley perfonnance across the state .••••. 19
9.
Summary of barley performance trials in the Piedmont ••.•.•••• 20
10.
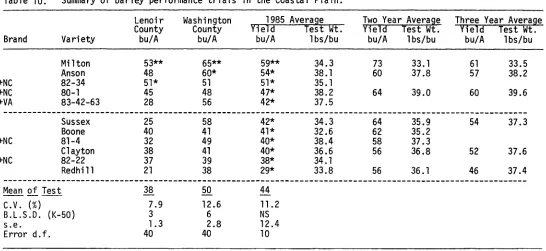
Summary of barley performance trials in the Coastal Plain •.• 21
11.
Summary of oat performance trials across the state ••.•••••.•• 22
12.
Two year average oat perfonmance across the state ..••••..••.
2313. Three year average oat
perfo~anceacross the state .•.••.•..
2314.
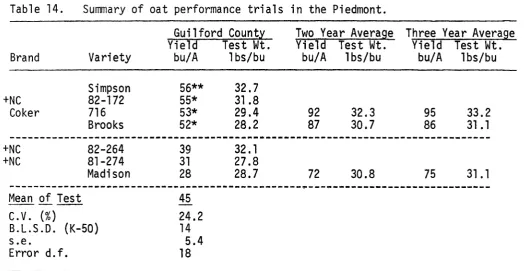
Summary of oat perfonmance trials in the Piedmont •••••••••.• 24
15. Summary of oat performance trials in the Coastal Plain ••..••• 25
16.
Summary of wheat performance trials across the state •.•••... 26
17.
Two year average wheat perfonmance across the state •••.•..•. 27
1985
PERFORMANCE OF SMALL GRAIN VARIETIES IN NORTH CAROLINA!/
INTRODUCTION
Across the state of North Carolina during the spring of
1984, growers harvested 64,999 acres of barley, 68,000 acres
of oats, and 629,999 acres of wheat. Average yields were
63, 58, and 43 bushels per acre for barley, oats, and wheat,
respectively. Conditions were generally favorable that year
for excellent yields.
with the large number of commercially available and
prospective varieties of barley, oats, and wheat, it becomes
difficult for growers to select a superior variety suited
for their particular area of the state. To make this
decision, the grower needs up-to-date, unbiased, reliable
information. The Official Variety Testing Program, through
this report, seeks to provide that type of information.
Information on varietal performance is presented from
seven test locations in the state--four in the Piedmont, and
three in the Coastal Plain. Also included are multiple-year
performance data on a selected number of varieties.
2
COMPARING VARIETIES
Performance of a variety cannot be determined with
absolute precision. Even though the tests are conducted in
a uniform manner, as much as possible, uncontrollable
variability exists among experimental plots due to soil,
fertility, moisture, insects, diseases, and other sources of
variation. Because this variability exists, statistics are
used as a tool to determine differences among varieties.
The size of difference among varieties which may have been
due to chance variation is listed in each table as the
B.L.S.D. (least significant difference). Those varieties
which do not differ by more than the B.L.S.D. are not
statistically different.
varietal performance may appear inconsistent among
locations within an area or among years at a particular
location, thus i t is important for the reader to examine
results from more than one location within an area or more
than one year at a particular location, to obtain a more
accurate picture of relative varietal performance. An
effort has been made to facilitate comparisons among
locations and years in this report.
The varieties which do not yield significantly less
than the highest yielding variety are denoted by an asterisk
(*) next to their yields. The relative performance of a
variety across locations within an area can be easily
evaluated by going across the table; those varieties which
3
highly desirable. Other agronomic characteristics may be as
equally important as yield. All available data regarding
pathologic and agronomic characteristics of the varieties
are found in Tables 1, 2, and 3 for barley, oats, and wheat,
respectively.~
It is suggested that the grower plant a small number of
acres in a new variety when first determining if it is
adapted to his farm.
~special
acknowledgment is due Drs: PaulM~r~hy
andTable 1.
Characteristics of barley varieties*
Mildew
Rust
Scald
Lodging
Winter
Test
Length
resist-
resist-
resist-
resist-
hardi-
Maturi ty
Weight
of
Vari ety
ance
ance
ance
ance
ness
lb/bu
awns
Anson
Fair
Good
Poor
Good
Good
Medium
Medium
Awnless
Boone
Fair
Good
Fai r
Fair
Good
Medium
High
Short
Cl ayton
Good
Excellent
Good
Good
Good
Early
Medium
Awnless
Milton
Fair
Good
Good
Excellent
Good
Early
Medium
Short
Redhill
Good
Good
Good
Good
Good
V. Early
Medium
Awnless
Sussex
Excellent
Poor
Excellent
Good
Fair
V. Early
Low
Short
.,J:::a.
Table 2.
Characteristics of oat varieties*
Rust
Smut
~1osaic
Winter
Lodging
Test
resist-
resist-
resist-
Maturity
hardi-
resist-
Weight
Variety
ance
ance
ance
ness
ance
lb/bu
Brooks
Fair
Good
Fair
Early
Fair
Good
Med. High
Coker 716
Fair
Good
Good
Medium
Good
Good
Med. High
Madison
Fair
Good
Fair
Medium
Fair
Excellent
Medium
Table
3.Characteristics of wheat varieties·
Leaf
Soft
rust
Mildew
Mosaic
Winter
Lodging
Height
Test
Wheat
resist- resist-
resist-
Maturity
Hardi-
resist-
of
Weight
Milling
Variety
ance
ance
ance
ness
ance
Straw
lb/bu
Qual i ty
Caldwell
Good
Fair
Good
Medium
Good
Fair
Medium
High
Good
Compton
Good
Poor
Good
Medium
Good
Excellent Semi-Dwarf
High
Good
Coker 747
Good
Fair
Good
Medium
Good
Good
Semi-Dwarf
High
Fair
Coker 762
Good
Poor
Good
Medium
Fair
Fair
Semi-Dwarf
Medium
Fair
Coker 797
Good
Fair
Fair
Early
Fair
Excellent Semi-Dwarf
Medium
Fai r
Coker 916
Good Excellent
Good
Medium
Good
Excellent Semi-Dwarf
High
Good
Coker 983
Good
Excellent
Good
Med. Early
Fair
Excellent Semi-Dwarf
Medium
Good
(J"IHunter
Good
Good
Good
Early
Fair
Excellent Semi ..Dwarf
High
Good
Massey
Poor
Good
Good
Medium
Good
Good
Medium
Medium
Fair
McNair 1003
Poor
Good
Good
Medium
Fai r
Excellent
Medium
Medium
Good
Pioneer
Brand 2550
Good
Fai r
Good
Medium
Good
Good
Medium
High
Fair
Saluda
Good
Poor
Fair
Medium
Good
Fair
Medium
Medium
Good
Scotty
Good
Fair
Good
Medium
Good
Excellent
Medium
Excellent
Fair
Tyler
Poor
Fair
Good
Late
Good
Good
Medium
High
Good
Wheeler
Poor
Poor
Good
Medium
Good
Good
Medium
High
Fair
6
EXPERIMENTAL PROCEDURE
The state is divided into physiographic regions and
tests were located in the Piedmont and Coastal Plain (Figure
1). Three tests were located on private
farms~
and fivewere on research stations.
Entries: Commercial varieties and experimental lines
developed by public and private agencies are included in
these tests. Any individual or firm may make application
for having entries included by writing the Department of
Crop Science, North Carolina State University at Raleigh.
A fee is charged on an entry basis for all private entries.
Entries about which further information was desired may have
been included on a no-fee basis. A total of 11, 7, and 26
commercial varieties and experimental lines of barley, oats,
and wheat, respectively, were evaluated in the 1984-85
season.
Field Plot Design: A randomized, complete block design with
four or six replications was used at each location.!! Each
plot consisted of seven rows, seven inches apart, fifteen
feet long with two feet between each plot.
~The
cooperative spirit and civic-mdnded service rendered bythe farmers who provided the land and the necessary cultural practices for these trials and the cooperation of the county agents are gratefully acknowledged.
7
Crop Management: Cultural practices, such as seed bed
preparation, date of planting, fertilization and topdressing
were in accord with good farming practices and were uniform
for all entries at a given location (Table 4). Prior to
planting each test, soil samples were obtained from the test
field and fertilizer and lime applications were made
• Signifies Official Variety Test Locations
FIGURE 1-LOCATION OF SMALL GRAIN PERFORMANCE TRIALS
1985
Table 4. Cultural practices for small grain tests, 1984-85. County Piedmont Area Catawba Granville Guilford Rowan Fertilizer Ibs/A & Grade
300 Lbs , 12-34-0
400 Ibs. 10-20-20
400 lbs. 10-20-20
700 lbs. 10-20-20
Topdress lbs/A
168 lbs. 33.5% N
188 lbs. 33.5% N
150 lbs. 33.5% N
60 lbs. 33.5% N
Soil Type
Sandy Clay Loam
Vance Sandy Loam Cecil Sandy Clay Loam Cecil Sandy Loam Date of Planting Oct. 10
Oct. 9 - Barley Oats Oct. 22 - Wheat
Oct. 29
Oct. 8 - Barley Oats Oct. 24 - Wheat
Date of Harvest
June 10 - Barley Oats & Wheat Discarded Discarded
June 18
June 10 - Barley Wheat Oats - Discarded
co
Coastal Plain Area
Pasquotank 500 Ibs. 4-12-24 224 lbs. 33.5% N Elkton Fine Sandy Loam
Oct. 23 June 11
Lenoir 300 lbs. 10-10-20 280 lbs. 33.5% N Goldsboro Loamy Sand Oct. 11 Oct. 25 - Barley Oats - Wheat May 28 June 3 June 4 - Barley - Oats - Wheat Sampson 400 Ibs. 10-10-10
Washington 500 lbs. 4-6-18
224 lbs. 33.5% N
280 lbs. 33.5% N
Orangeburg Loamy Sand Cape Fear Sandy Loam Oct. 26 Oct. 18 Discarded
May 28 - Barley June 11 - Oats
Table 5. Soil test results from test sites, 1984-85.
HM % w-v CEC BS % Ac pH P-I K-I Ca % Mg % Mn-I Zn-I Cu-I
PIEDMONT AREA
Granville 0.3 1.27 2.5 68 0.8 5.7 166 48 43.7 15.1 96 36 38 Guilford 0.3 1.10 7.3 89 0.8 6.4 47 116 63.2 17.9 625 136 122 Catawba 0.6 1.20 4.9 83 0.8 6.1 26 46 59.7 18.3 101 33 32 Rowan 0.2 1.11 6.1 80 1.2 5.4 17 124 54.3 14.8 625 31 144
~
0
COASTAL PLAIN AREA
Pasquotank 0.6 1.12 3.6 55 1.6 5.2 147 62 36.4 10.1 178 78 50 Sampson 0.3 1.39 1.7 76 0.4 6.0 128 32 48.2 18.1 104 38 266 Lenoir 0.5 1.27 3.4 64 1.2 5.3 124 78 38.8 13.7 26 28 30
11
Agencies sponsoring Entries
Agripro
Arkansas Agric. Expt. Station
Florida Agricultural Experiment Station
Illinois Agricultural Experiment Stationn
North Carolina Agric. Experiment Station
Pioneer Hi-Bred International, Inc.
purdue University Agric. Expt. Station
Rohm and Haas Seeds
south Carolina Agric. Experiment Station
Virginia Agricultural Experiment Station
Cooperators Piedmont Entries Hunter Nelson, Rosen Florida Scotty
Anson, Boone, Clayton Milton, Brooks, NC Madison
Pioneer
Caldwell, Compton, Adder
Coker, McNair, HW
Redhill, Simpson
Sussex, Massey, Tyler VA, Wheeler, Saluda
Granville County: Bill Clements, Superintendent, Oxford Tobacco Research Station, Oxford, NC
Agricultural Extension Agent, Derek Day.
Catawba County: Stanly Stewart, Promiseview Farms, Newton, NC Agricultural Extension Agent, Bobby Simpson.
Guilford County: Rick Apple, 5389 NC 159E, Brown Summit, NC Agricultural Extension Agent, Chris Ingram.
Rowan County: Billy Ayscue, Superintendent, Piedmont Research Station, Salisbury, NC.
Agricultural Extension Agent, Kevin Fisher.
Coastal Plain
Pasquotank Couunty: John Madre, R-3, Box 473, Elizabeth City, NC County Extension Chairman, Donald W. Baker.
Sampson County: Fred Cumbo, Supt., Hort. Res. Sta., R-S, Box 43, Clinton, NC.
Agricultural Extension Agent, Tommy Glover.
Lenoir County: Sandy Barnes, Superintendent, Lower Coastal Plain Tobacco Research Station, Kinston, NC.
Agricultural Extension Agent, Johnnie Jones, III.
Washington County: John Smith, Superintendent, Tidewater Research Station, Plymouth, NC.
12
SEASONAL CONDITIONS
The 1984-85 small grain growing season was characterized
by below-normal rainfall and above-normal temperatures for the
most part. Record breaking low temperatures in January caused
substantial damage to stands of oats and resulted in loss of tests
at four locations. A record low temperature in the second week of
April severely reduced yields of some early-maturing barley and
wheat varieties. Rainfall data at four locations are shown below:
Monthly Rainfall Totals (Inches)
No- Dec- Jan-
Feb-Location October vember cember uary ruary March April ~
Granville 2.49 1.96 2.73 4.79 4.70 1.15 0.64 4.13
Lenoir ftJ.84 1.31 1.29 4.34 4.62 1.34 0.48 1.44
Rowan 2.16 1.82 2.06 3.27 5.89 1.09 1.19 3.33
Washington 0.33 1.92 1.16 5.90 3.90 1.89 9.67 1.19
Dates of planting during the fall of 1984 were near normal
although fields were generally dry. Above-normal temperatures
in December resulted in considerable growth of small grains
which increased their vulnerability to the record cold temperatures
in January. Leaf rust was evident in the spring although not
to the extent where viable ratings could be taken. Ratings of
wheat varieties are reported for powdery mildew. Cereal leaf
beetle was evident at several locations and at the Rowan
County location they appeared to be more concentrated on
the barley.
Topdressing of small grains was on time. Dry, warm
13
reveal very little differences (in maturity) among the
varieties. Harvesting progressed rapidly and all tests
had been harvested by June 18.
Yields were below-normal due primarily to the dry spring.
Protein levels in the wheat were far above average and it is
thought to be a result of the unique weather.
DMA
Yield is reported in bushels per acre by location,
across locations within areas and across all locations within
the state. Test weights in pounds per bushel were reported
averaged by area and averaged across the state. Lodging
was reported in percentage averaged across all locations
within the state; the lodging data are for lodging prior to
harvest. After harvest losses were negligible for all crops
and, thus, were not reported.
Date 5~% headed and date of physiological maturity
were taken at the Granville County location and reported in
the state-wide average. Date of physiological maturity is
considered when the grain is dried down to 18% moisture.
Disease ratings are reported in the state-wide
averages although they may have only been taken at one or
two locations.
Certain varieties were tested only in the Coastal Plain
while other varieties were tested in the Piedmont only.
Tables reflect these differences.
Coded samples of wheat were submitted for wheat and
flour analyses to the Bartlett Milling Company, Stateville,
14
whether released or potential varieties are suitable for
the mills in terms of quality. A general protein content
of 8 to 11% is desirable for soft red winter wheat.
Special acknowledgment is due Bartlett Milling Company
and Howard Lemon, Quality Control Manager, for their
assistance in making available these data.
Yield data were analyzed. The average yield of each
test was indicated on the bottom of the tables. The
B.L.S.D. K-50 is equivalent to the Fisher's L.S.D. at
the 10% level. The standard error of the mean (s.e.) is
an indicator of the precision of that test; the smaller the
s.e., the more precise the estimate of yield is for any
particular variety. The s.e. of the mean is equal to the
standard deviation divided by the square root of N; N is
normally the number of replications in the trials.
The averages across locations within an area such as
Piedmont or Coastal Plain may not appear to equal that of
the average between the locations; this is due to the fact
that different number of replications was used at each location
and the total number of replications was used in calculating
the average across locations within an area and across all
15
RESULTS AND DISCUSSION
Barley
Barley performance is summarized across the state for
1985 in Table 6 while two and three-year averages across the
state are shown in Tables 7 and 8. Anson and Milton
significantly outyielded all other varieties when averaged
across locations with an average yield of 70 bushels per
acre. Test weights were low for all varieties which is
thought to be a result of the environment since plots were
harvested as early as feasible. Milton appears at the top
of the two and three year averages. Date of 50% headed is
the most critical trait to examine for those growers wishing
to' plant an early-maturing variety since the data reveal
very little difference in physiological maturity.
Across the Piedmont, Anson, Milton, and Va. 83-42-63
led the group in yield (Table 9). Highest yields of barley
were recorded at the Catawba County location.
In the Coastal Plain, Milton was the highest yielder at
both locations (Table 10).
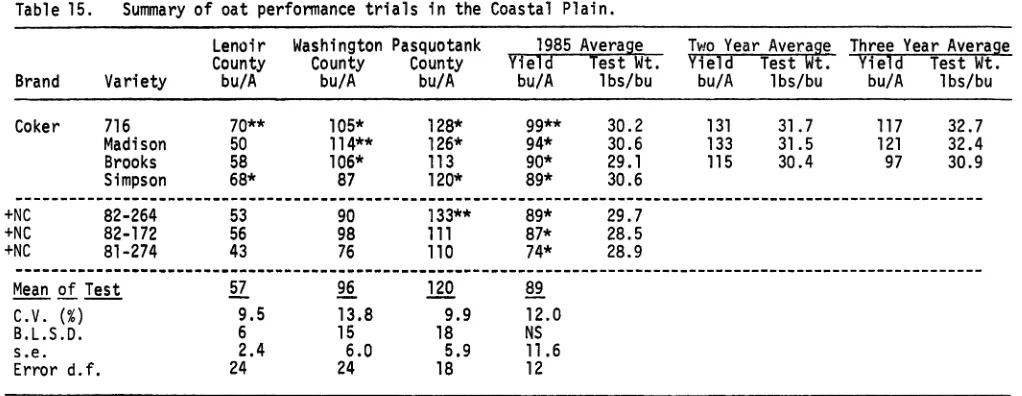
Oats
Oat yields were below average across the state in 1985
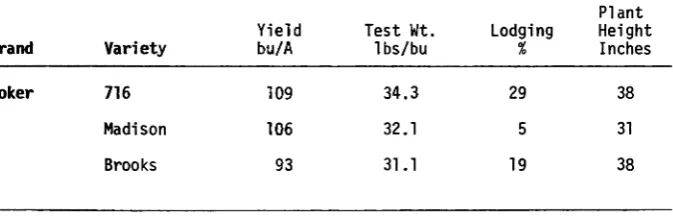
(Talbe 11). Coker 716 continues to outyield all other
varieties across the state for 1985 and the past two and
three years (Table 11, 12, 13, respectively). Although
lodging percentages may appear high, after harvest losses
due to lodging were negligible.
In the Piedmont, Simpson, a new oat variety out of
16
group (Table 14). In the Coastal Plain, Coker 716 yielded
99 bushels per acre across all three locations (Table 15)
while Madison is the two and three-year yield leader in
this region.
Wheat
An experimental, NC 81-58, was the highest wheat
yielder across the state for 1985 while six others did not
yield significantly less (Table 16). Test weights were low
and plant height was low; both were a result of the
environment. All varieties had matured by the end of May at
the Granville County location and would have been ready to
harvest by June 7 depending on the shower activity. Many
varieties which appeared to have resistance to powdery
mildew in the past were rated to be susceptible or even very
susceptible this year. Protein levels were extremely high
to the point of being unusable for the cracker and cookie
industry; this may not be characteristic of the soft red
winter wheat crop as a whole across North Carolina.
Table 17 and 18 show two and three-year averages,
respectively, statewide. Plant height, date 50% headed, and
date mature will be more typical of an average year rather
than anyone year such as 1985 in these tables.
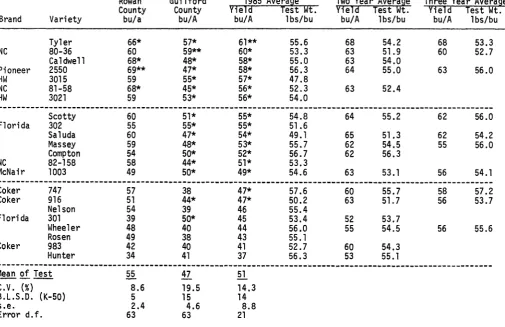
Across the Piedmont, Tyler continues to lead the group
in yield primarily because it is a later-maturing variety
(Table 19). An experimental, NC 80-36, also performed well
17
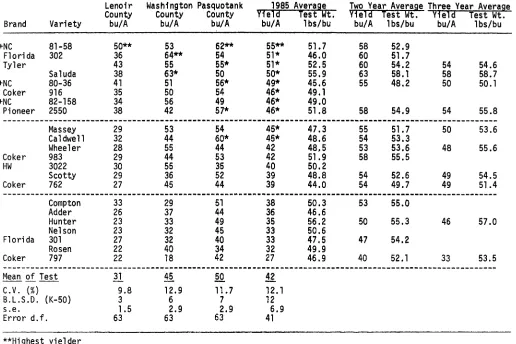
An experimental, NC 81-58, yielded four more bushels
per acre than Florida 3~2 and Tyler across the Coastal Plain
in 1985 to lead the wheat varieties, although it must be
pointed out that this was not a significant yield increase
(Table 20). Saluda leads the two and three year average for
Table 6. Summary of barley performance trials across the state.
Test Plant Date!!
Date!! Yield weight Lodging Ht. 50%
Brand Variety BulA lbslbu % in. Headed Mature
Anson 70** 38.8 50 23 4-15 5-19
Milton 70** 36.2 16 22 4-13 5-21
+NC 82-34 63 37.0 10 23 4-15 5-17
+VA 83-42-63 60 39.2 34 19 4-13 5-17
+NC 80-1 57 39.3 6 20 4-14 5-18
Boone 56 35.8 22 20 4-14 5-18
+NC 81-4 55 38.5 27 23 4-14 5-17
....
00Clayton 54 37.1 39 22 4-13 5-17
+NC 82-22 51 36.3 25 21 4-15 5-15
Sussex 51 36.7 15 22 4-10 5-17
Redhill 37 37.0 8 21 4-10 5-17
Mean 57
C.V. (%) 9 . 4
B.L.S.D. (K-50) 19
sve , 7.2
Error d.f. 30
!/Data taken from Granville County Test. Date mature indicates 18% moisture; grain should be dry for harvest approximately 7 days after this date.
19
Table 7. Two year average barley performance across the state.
Plant Date
Yield Test ~It. Lodging Height 50% Date Brand Variety bu/A 1bs/bu % Inches Headed r~ature
Milton 79 33.1 42 32 4-20 5-25
Boone 70 36.0 48 29 4-20 5-26
Sussex 69 37.3 37 30 4-13 5-25
+NC 80-1 69 38.6 37 31 4-21 5-25
---~---~-~p~~~--~---~~---~---~-~p-~--~.---Anson 68 37.6 56 32 4-23 5... 27
+NC 81-4 65 37.2 51 32 4-20 5-24
Clayton 63 36.8 53 32 4-20 5-24 Redhill 60 36.9 33 31 4-18 5-24
+Experi menta 1.
Table 8. Three year average barley performance across the state.
Brand
+NC
Plant
Yield Test Wt. Lodging Height Date Variety bu/A 1bs/bu % Inches Mature
Milton 68 34.6 33 33 5-30
Boone 66 38.1 34 33 5-30
80-1 66 40.0 26 34 5-29
Anson 65 38.5 39 36 5-31
Table 9.
Summary of barley performance trials in the Piedmont.
Rowan
Catawba
1985 Average
Two Year Average
Three Year Average
County
County
Yield
Test Wt.
Yield
Test Wt.
Yield
Test Wt.
Brand
Variety
bu/A
bu/A
bu/A
1bs/bu
bu/A
lbs/bu
bulA
1bs/bu
Anson
81**
93**
86**
39.5
75
37.1
75
32.8
Milton
77*
89*
82*
38.1
84
32.4
77
36.0
+VA
83-42-63
78*
82
80*
40.8
+NC
82-34
71
83
76
38.9
Boone
63
85
73
39.0
77
36.5
76
39.4
~
-C1 ayton
66
77
71
37.6
71
36.7
74
39.1
+NC
81-4
59
85
71
38.5
72
37.0
N+NC
80-1
62
77
69
40.5
73
37.7
73
40.5
a+NC
82-22
62
73
67
38.5
Sussex
60
63
61
39.1
74
38.8
62
39.5
Redhi11
36
55
44
40.2
63
37.2
49
37.5
~
-Mean of Test
65
78-
71
C.V.
(%)9.5
6.7
8.1
B. L.S.0. (K-50 )
6
6
9
s.e.
2.8
2.6
7.2
Error d.f.
40
30
10
**Highest yielder in test.
Table 10.
Summary of barley performance trials in the Coastal Plain.
Lenoir
Washington
1985 Average
Two Year Average
Three Year Average
County
County
Yield
Test Wt.
Yield
Test Wt.
Yield
Test Wt.
Brand
Variety
bu/A
bu/A
bu/A
1bs/bu
hulA
1bs/bu
hulA
1bs/bu
Milton
53**
65**
59**
34.3
73
33.1
61
33.5
Anson
48
60*
54*
38.1
60
37.8
57
38.2
+NC
82-34
51*
51
51*
35.1
+NC
80-1
45
48
47*
38.2
64
39.0
60
39.6
+VA
83-42-63
28
56
42*
37.5
~ ~ ~
-Sussex
25
58
42*
34.3
64
35.9
54
37.3
NBoone
40
41
41*
32.6
62
35.2
-'
+NC
81-4
32
49
40*
38.4
58
37.3
Clayton
38
41
40*
36.6
56
36.8
52
37.6
+NC
82-22
37
39
38*
34.1
Redhi11
21
38
29*
33.8
56
36.1
46
37.4
---Mean of Test
38
50
44
-C.v.
(%)7.9
12.6
11.2
B.l.S.D.
(K-50)
3 6 NSs.e.
1.3
2.8
12.4
Error d.f.
40
40
10
**Highest yielder
22
Table 11. Summary of oat performance trials across the state.
Plant Date1' WinterY Yield Test Wt. Lodging Height 50% Kill Brand Variety bu/A 1bs/bu % In.ches Headed %
Coker 716 89** 30.0 21 28 4-24 13
Simpson 82* 31 .1 28 28 4-24 14
Brooks 82* 28.9 11 28 4-23 71
Madison 80* 30.1 10 22 4-23 60
---~---~---~---+NC 82-172 80* 29.3 28 28 4-23 73
+NC 82-264 78* 30.3 10 26 4-24 71
+NC 81-274 64 28.6 71 29 4-23 64
Mean of Test 79
C.V. (%) 13.5
B.l.S.D. (K-50) 14
s .e , 10.1
Error d.f. 18
lI
Dat a taken from Granville County location.~Data
taken from Sampson County.23
Table 12. Two year average oat performance across the state.
Plant DateY Yield Test Wt. Lodging Height 50% Brand Variety bu/A 1bs/bu % Inches Headed
Coker 716 118 32.2 44 36 5-1
Madison 112 31.4 7 30 5-1
Brooks 106 30.7 25 37 5-1
lI
Dat a taken from Granville County test.Table 13. Three year average oat perfonmance across the state
Plant Yield Test Wt. Lodging Height
Brand Variety bu/A 1bs/bu % Inches
Coker 716 109 34.3 29 38
Madison 106 32.1 5 31
Table 14.
Summary of oat performance trials in the Piedmont.
Brand
Variety
Guilford County
Yield
Test
Wt.
bu/A
1bs/bu
Two Year Average Three Year Average
Yield Test
Wt.
Yield Test
Wt.
bu/A
1bs/bu
bu/A
lbs/bu
+NC
Coker
Simpson
82-172
716
Brooks
56**
55*
53*
52*
32.7
31 .8
29.4
28,.2
92
87
32.3
30.7
95
86
33.2
31 •1
-~~~---~---~---~---~~---~~---~---+NC
+NC
82-264
81-274
Madison
39
31
28
32.1
27.8
28.7
72
30.8
75
31 .1
N
~
---.-~~---~---~---~---Mean of Test
C.V.
(%)
B.L.S. D. (K-50)
s.e.
Error d.f.
45
24.2
14
5.4
18
**Highest yielder.
*Not
significantly different from highest yielder.
Table 15. Summary of oat performance trials in the Coastal Plain.
Lenoir Washington Pasquotank 1985 Average Two Year Average Three Year Average County County County Yield Test Wt. Yield Test Wt. Yield Test Wt. Brand Variety bu/A bu/A bu/A bu/A 1bs/bu bu/A lbs/bu bu/A 1bs/bu
Coker 716 70** 105* 128* 99** 30.2 131 31.7 117 32.7
Madison 50 114** 126* 94* 30.6 133 31.5 121 32.4
Brooks 58 106* 113 90* 29.1 115 30.4 97 30.9
Simpson 68* 87 120* 89* 30.6
+NC +NC +NC
82-264 82-172 81-274
53 56 43
90 98 76
133** 111 110
89* 87* 74*
29.7 28.5 28.9
N (J'1
Mean of Test
E
96ill
89c.v.
(%) 9.5 13.8 9.9 12.0B.l.S.D. 6 15 18 NS
s.e. 2.4 6.0 5.9 11 .6
Error d. f. 24 24 18 12
**Highest yielder in test.
Table
16.Summary of wheat performance trials across the state.
Plant
Date1!
Date
ll
Powdery£!
Yield
Test Wt.
Lodging
Height
50%Mildew
Protein
Brand
Variety
bu/A
1bs/bu
%Inches
Headed
Mature
Rating
%+NC
81-58 56** 51.9 15 25 4-24 5-31MS
16.7Tyler
55* 53.7 0 25 4-19 5..30MS
16.1+NC
80-36 53* 48.7 8 24 4-18 5-28MS
14.3Florida
302 53* 48.2 19 27 4-17 5-29R
17.5Saluda
51* 53.2 0 23 4...14 5-27VS
18.0Pioneer
2550 51* 53.6 33 23 4-23 5-30S
16.5
---.~---~---~---_._-_.~---.~---Caldwell
50* 51.2 36 23 4-19 5-28MS
16.2Massey
48 50.7 16 23 4-14 5-27MR
16.4+NC
82-158 48 50.7 19 28 4-17 5-28MS
17.0Coker
916 47 49.5 17 23 4-14 5-27 R 17.5Scotty
46 51.2 10 24 4-18 5-28S
17.8Compton
43 52.9 12 24 4-18 5-28S
16.0 N0'\ ---~---~---
Wheeler
43 51.5 5 27 4-17 5-27S
17.4Coker
983 42 52.2 0 22 4-14 5-27R
15.8Nelson
38 52.5 10 23 4-17 5-28S
17.4Florida
301 38 49.9 10 24 4-13 5-26 R 14.5Rosen
37 52.0 10 22 4-15 5-26VS
14.9Hunter
36 56.3 10 19 4-13 5-26MR
16.6~ ~ . ~ ~
-Mean of Test
~iC.V.
(s) 13.4B. L.S.0• (K-
50) 7s.e.
5.5Error d.f.
68!l
oat a taken from Granville County test. Date mature indicates
18%moisture.
~R
=
Resistant, MR
=
Moderately Resistant. MS
~
Moderately susceptible, S
=
Susceptible, VS
=
Very Susceptible.
**Highest yielder.
27
Table 17.
Two year average wheat perfonmance across the state.
Plant
Date
Yield
Test Wt.
Lodging Height
50%
Date
Brand
Variety
-bu/A
lbs/bu
%
Inches
Headed
Mature
Saluda
64
54.8
7
31
4-24
6-3
Tyler
64
54.0
6
34
4-28
6-7
+NC
81-58
61
52.6
10
32
5-3
6-8
Pioneer
2550
61
54.6
21
32
4-30
6-5
Massey
59
52.7
13
32
4-23
6-4
Scotty
59
53.6
7
32
4-27
6-5
Coker
983
59
54.7
1
30
4-23
6-4
~~~~~
-+NC
80-36
58
49.7
6
31
4-26
6-3
Caldwell
58
53.2
34
31
4-27
6-4
Compton
57
55.2
9
31
4-26
6-4
Wheeler
55
53.5
1135
4-25
6-3
Hunter
51
55.2
8
28
4-22
6-3
Florida
301
49
53.4
18
36
4-22
6-2
+Experimenta1•
Table 18.
Three year average wheat perfonnance across the state.
Plant
Yield
Test Wt.
lodging
Height
Date
Brand
Variety
bu/A
lbs/bu
SInches
Mature
Saluda
60
56.5
5
33
6-8
Tyler
59
53.9
4
38
6-11
Pioneer
2550
57
55.7
14
34
6-9
Scotty
55
55.1
5
34
6-9~~~~
-+NC
80-36
54
51.1
4
34
6-7
Massey
52
54.4
8
35
6-8
Wheeler
51
55.2
7
36
6-6
Hunter
47
57.0
5
31
Table 19. Summary of wheat performance trials in the Piedmont.
Rowan Guilford 1985 Average Two Year Average Three Year Average County County yield fest Wt. yield fest
Wt.
Yield Test Wt. Brand Variety bu/a bu/A bu/A lbs/bu bu/A lbs/bu bu/A lbs/buTyler 66* 57* 61** 55.6 68 54.2 68 53.3
+NC 80-36 60 59** 60* 53.3 63 51.9 60 52.7
Caldwell 68* 48* 58* 55.0 63 54.0
Pioneer 2550 69** 47* 58* 56.3 64 55.0 63 56.0
HW
3015 59 55* 57* 47.8+NC 81-58 68* 45* 56* 52.3 63 52.4
HW
3021 59 53* 56* 54.0---~---~---~---~---~---Scotty
60 51* 55* 54.8 64 55.2 62 56.0
Florida 302 55 55* 55* 51 .6
Saluda 60 47* 54* 49.1 65 51 .3 62 54.2
Massey 59 48* 53* 55.7 62 54.5 55 56.0
Compton 54 50· 52* 56.7 62 56.3
+NC 82-158 58 44* 51* 53.3 N
(X)
McNair 1003 49 50* 49* 54.6 63 53.1 56 54.1
---~---~---~---~---~---~---~---~--~
Coker 747 57 38 47* 57.6 60 55.7 58 57.2
Coker 916 51 44* 47* 50.2 63 51.7 56 53.7
Nelson 54 39 46 55.4
Florida 301 39 50· 45 53.4 52 53.7
Wheeler 48 40 44 56.0 55 54.5 56 55.6
Rosen 49 38 43 55.1
Coker 983 42 40 41 52.7 60 54.3
Hunter 34 41 37 56.3 53 55.1
~ ~ ~ ~
-Mean of Test 55 47 51
C.V. (%) 8.6 19.5 14,3
B.L.S.D. (K-50) 5 15 14
s.e. 2.4 4.6 8.8
Error d.f. 63 63 21
**Highest yielder.
Table 20.
Summary of wheat performance trials in the Coastal Plain.
Lenoir
Washington Pasquotank
1985 Average
Two Year Average Three Year Average
County
County
County
yield
Test
Wt.
Yield Test
Wt.
yield
Test Wt.
Brand
Variety
bu/A
bu/A
bu/A
bu/A
1bs/bu
bu/A
1bs/bu
bu/A
1bs/bu
+NC
81-58
50**
53
62**
55**
51 .7
58
52.9
Flori da
302
36
64**
54
51*
46.0
60
51.7
Tyler
43
55
55*
51*
52.5
60
54.2
54
54.6
Saluda
38
63*
50
50*
55.9
63
58.1
58
58.7
+NC
80-36
41
51
56*
49*
45.6
55
48.2
50
50.1
Coker
916
35
50
54
46*
49.1
+NC
82-158
34
56
49
46*
49.0
Pioneer
2550
38
42
57*
46*
51.8
58
54.9
54
55.8
---~---~---~
Massey
29
53
54
45*
47.3
55
51.7
50
53.6
Caldwell
32
44
60*
45*
48.6
54
53.3
Wheeler
28
55
44
42
48,5
53
53.6
48
55.6
Coker
983
29
44
5342
51.9
58
55.5
NHW
3022
30
55
35
40
50.2
~Scotty
29
36
52
39
48.8
54
52.6
49
54.5
Coker
762
27
45
44
39
44.0
54
49.7
49
51.4
_._ ~ ~
-Compton
33
29
51
38
50.3
53
55.0
Adder
26
37
44
36
46.6
Hunter
23
33
49
35
56.2
50
55.3
46
57.0
Nelson
23
32
45
33
50.6
Flori da
301
27
32
40
33
47.5
47
54.2
Rosen
22
40
34
32
49.9
Coker
797
22
1842
27
46.9
40
52.1
33
53.5
~~