July, 1965
Measured Crop Performance
SMALL GRAIN
1965
GUY L.JONES, Professor JOHN C. RICE, Professor
R. WALTON MOZINGO, Research Assistant E. L.JONES, Agricultural Research Supervisor G. C. OLIVER, Agricultural Research Assistant
Department of Crop Science North Carolina State University
TABLE OF CONTENTS
Page
INTRODUCTION •...•...•.•••••..•.• · . · • · · · • · · ••• · . · • · · • · . . • . . . . • . 3
EXPERI11ENT~ PROCEDURE... 4
Agencies Sponsoring Entries... 4
Test Locations... 4
Cultural Practices... 6
Seasonal Conditions... 7
RESULTS AN'D DISCUSSION... 9
Barley.... . . . .. . . . .. . . ...••. .•. . ••. . .. ..•. . 9
Oats. . . 10
Wheat. . . .. . . ... . . .. . ..• ...• . . . .. .. .. . . .... ... . .. 11
TABLES AN'D FIGURES Location of t e s t s . . . 5
Cultural practices... 12
Characteristics of varieties . . . • • . . . 13
Barley performance in the Piedmont . . • . . . • . . . 15
Barley performance in the Coastal Plain • . . . . • . . . 16
Oat performance in the Piedmont ...•...••••.•... 17
Oat performance in the Coastal Plain •••.••...•••••....••.•• 18
Wheat performance in the Piedmont ••••.•••••..•••••.•••.•••. 19
Wheat performance in the Coastal Plain •••.•••••...••.•••• 20
PERFORMANCE OF SMALL GRAIN VARIETIES IN NORTH CAROLINA
Guy L. Jones, John C. Rice, R. W. Mozingo, E. L. Jones, G. C. Oliver
!/
INTRODUCTIONEach year evaluation trials are located throughout the small grain producing area of the state. These tests are conducted to determine the value and suitability of commercially available and prospective varieties of wheat, oats, and barley for planting in North Carolina. The results of these tests are intended to aid the growers and agricultural workers in the selection of a variety best suited for their area of the state.
The results of varietal performance are presented from seven test locations in the state, four in the Piedmont and three in the Coastal Plain area. In comparing the performance of varieties, data from the area which most nearly represents the growers' con-ditions should be used. Due to variation in seasonal conditions from year to year, varieties should be evaluated on the basis of performance over several years rather than the present year's data.
All available data
1/
were used in determining the pathologic and agronomic characteristics of the varieties.1/
Professor in Charge of Variety Testing, Professor, Research Assistant, Agricultural Research Supervisor and Agricultural Re-search Assistant, Department of Crop Science, North Carolina State University at Raleigh, respectively.4
EXPERIMENTAL PROCEDURE
Commercial varieties and experimental lines developed by public and private agencies are included in these tests. Any individual or firm may make application for having entries included by writing the Department of Crop Science, North Carolina State University at Raleigh. A fee is charged on an entry basis for all private entries. Personnel of the testing program may include entries about which further infor-mation is desired.
Agencies Sponsoring Entries Coker's Pedigreed Seed Company
Georgia Agricultural Experiment Sta. Indiana Agricultural Experiment Sta. North Carolina Agricultural Experiment Sta. South Carolina Agricultural Experiment Sta. Virginia Agricultural Experiment Sta.
Test Locations
Hartsville, S. C. Experiment, Ga. Lafayette, Ind. Raleigh, N. C. Clemson, S. C. Blacksburg, Va.
Seven locations were used in 1965 with four in the Piedmont and three in the Coastal Plain as shown in Figure 1. All tests were lo-cated on private farms.
1/
A randomized block design with four repli-cations was used at eachlocation.~/
1/
The cooperative spirit and civic-minded service rendered by the farmers who provided land and the necessary cultural practices for these trials and the cooperation of the county agents are gratefully acknowledged.FIGURE 1
LOCATION OF SMALL GRAIN PERFORMANCE TRIALS
• Signifies Official Variety Ted Location.
CO-OPERATORS
PIEDMONT
Davidson County: C. A. Smith, Route 7, Lexington, N. C. County Extension Chairman, C. E. Barnhardt.
Gaston County: Wade Harris, Route 2, Bessemer City, N. C. County Extension Chairman, Max Erwin.
Randolph County: Homer Lanier, Route 3, Denton, N. C. County Extension Chairman, B. P. Jenkins, Jr.
Guilford County: Paul &Carson Ingle, Route 1, Burlington, N. C. County Extension Chairman, W. H. Kimrey.
COASTAL PLAIN
Edgecombe County: Jesse Summerlin, Route 1, Tarboro, N. C. County Extension Chairman, J. C. Powell.
Lenoir County: Herman Spence, Jr., Route 1, Kinston, N. C. County Extension Chairman, F. J. Koonce.
Cultural Practices
Cultural practices, such as seed bed preparation, date of planting, fertilization and topdressing were in accord with good farming practices and were uniform for all entries at a given lo-cation, Table 1.
All test were seeded in a small furrow with a Planet Jr. planter at the rate of one gram of seed per food of row. The rows were spaced one foot apart. Each plot consisted of seven rows twelve feet long with the two outside rows used as borders. The border rows were removed prior to harvest and only the five
center rows were harvested.
7
Seasonal Conditions
The 1965 variety tests were considered to be good. All loca-tions had a good seed bed and were planted according to the recom-mended planting dates. (See table 1 page 12 for specific planting dates). There was very little winter kill as compared to previous years.
The Guilford County test had an excellent stand with good growth and color. This test had the best growth of any of the Piedmont tests. After heading a severe wind storm resulted in considerable lodging on some varieties of oats, wheat and barley.
A heavy rain soon after planting in the Gaston County test caused soil to harden and a hard crust formed. This resulted in some plots having irregular stands with differences in emergence. Later in the season this condition improved, but three experimental varieties of wheat were omitted from the data because of stand count. One replication of the barley also was omitted due to a weaker stand and some washing in these plots.
was especially severe on some entries, but it was not positively identified by the plant pathologists. Thus, the wheat data at this location was not used. One replication of barley at the Randolph location was not used due to a weak stand.
The weather conditions in the Coastal Plain were about normal. All locations had a good stand with vigorous growth and good color.
The Edgecombe County test had no cold damage but some water damage was noticed on one replication in March. Excessive rains at harvest time delayed harvesting approximately one week.
The Robeson County test was planted under good conditions and a good stand with good growth followed. Extra nitrogen applied by the farmer did not cause excess lodging. This was a uniform test.
The Lenoir County test had some early damage from aphids. The low soil pH. at this location resulted in poor growth on all barley plots. The barley entries at this location were not harvested.
In general the growing conditions for the entire state were conductive to producing good yields. Rains at harvest time delayed the harvest on the Guilford and Edgecombe tests. Other locations were harvested on time. The tests, in general, were very good and
RESULTS AND DISCUSSION
The performance of the 1965 tests along with the previous four years are presented by crop and area in a tabular form in this report. Since the genetic expression of a variety is in-fluenced greatly by the environment, it is best to have several years' data from which to draw conclusions. For example, if a variety appears in the two-year average but not in the three-year average, then it must be compared only within the two years and not with the data in the three-year average, since it is possible that the third year could have been extremely good or poor and not comparable.
The 1965 data presented in this report have been analyzed statistically and the least significant difference (L.S.D.), in terms of bushels per acre and pounds per bushel is given. Unless the difference between two varieties is greater than the L.S.D., the varieties should not be considered as being any different statistically.
Barley
Rogers also showed the highest test weight average of 45.2 lbs/bushel for the five-year period. Wade also had a high test weight of 43.9 pounds per bushel for the five-year period.
In the Coastal Plain area, Table 6 there was no statistical difference variation in yield between the varieties. The breeding line SC 59-1018 had the top yield of 58.6 bushels per acre. Roger and Colonial 2 yielded better than 53.7 bushels per acre. The line SC 60-3239 had the highest test weight of 46.8 pounds per bushel followed by Harrison and SC 59-1018 with 43.6 pounds per bushel.
Over the five-year average Wade and Colonial 2 showed the higher yields while Wade and Rogers had the top test weights.
Oats
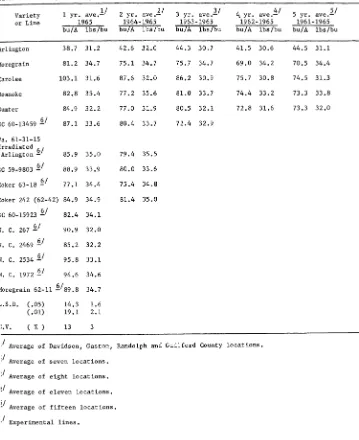
Data from the oat trials in the Piedmont are presented in Table 7. All oats yielded well except the variety Arlington which was considerably below the other entries for 1965. All other entries yielded in excess of 77 bushels per acre with Carolee having the highest yield of 103.1 bushels. The test weights were generally good with Roanoke having a top of 35.4 pounds per bushel.
Over the five-year average Carolee, Roanoke and Sumter are all showing high consistent yields. Moregrain showed the highest test weight for the five-year average.
11
950 7 bushels. The test weights were good with Moregrain 62-11
having the highest of 37.5 lbs/bushels followed very closely by Coker 63-18 and Moregrain with a weight of 37.2 lbs/bushel. Over the five-year average Sumter has the highest average of 82.9 bushels Moregrain has the top test weight of 35.3 for five years.
Wheat
Data on the wheat trials in the Piedmont are presented in Table 9. The yields were good with all entries yielding above 39 bushels per acre for 1965. The line N.C. 4672 showed a very high yield of 55.0 bushels followed by Knox 62 with a yield of 48.1 bushels per acre. The test weights ranged from 60.3 pounds per bushel for Knox 62 to 56.6 for N.Co 4672. Ga. 1123 led the five-year average with 46.4 bushels per acre. Knox had the highest test weight for the five year period.
Area and Fertilizer Topdress
1.1
Date of Date of cooperator lbs/A 1bs/A and date planting harvesting---Piedmont Area
Davidson Co. 500 40 N Oct. 14 June 10 C. A. Smith 4-12-12 Feb. 23
Gaston Co. 800 65 N Oct. 15 June 7 Wade Harris 5-10-10 Feb. 23
Randolph Co. 500 50 N Oct. 14 June 7 Homer Lanier 5-10-10 Feb. 26
Guilford Co. 450 SO N Oct. 29 June 19
Paul &Carson Ingle 5-10-10 Feb. 23 t-'
N
Coastal Plain Area
Edgecombe Co. 500 50 N Nov. 3 June 21 Jesse Summerlin 5-10-10 March 1
Lenoir Co. 500 60 N Oct. 27 June 11 Herman Spence, Jr. 5-10-10 March 1
Robeson Co. 500 50 N Oct. 28 June 4 Klyne Lowery 5-10-10 March 8
60 N April 3
1/
All test sprayed with 1 pt./Acre of 2, 4-D for weed control at the time of topdressing with liquid* Table 2. Characteristics of barley varieties.
Loose Mildew Leaf Scalk Lodging
Test
smut rust Winter
Variety resist- resist- resist- resist- resist- Hardiness Maturity Weight
ance ance ance lb/bu.
ance ance
Davie Poor Poor Excellent Fair Fair Fair Early Med.
Rogers Poor Excellent Fair Fair Good Good Late High
Early Marconee Poor Fair Poor Poor Poor Fair Very
early Med.
Wade Poor Poor Excellent Fair Excellent Fair Early High
Ga-Jet Good Fair Poor Fair Fair Fair Very
early Med.
Colonial 2 Poor Poor Poor Poor Fair Fair Early Med.
Harrison Poor Good Fair Fair Excellent Good Early High
I-l
w
ok
Table 3. Characteristics of oat varieties.
Crown
Smut Blight Mosaic Winter Lodging Amount Test
rust
resist- resist- resist- Maturity hardi- resist- of Weight
res ist- ance ance ance ness ance Straw
lb/bu. ance
Arlington Fair Good Poor Good Late Good Poor Tall Med.
Sumter Fair Good Good Good Med. Good Good Med. Med.
Moregrain BRS Good Good Good Fair Early Fair Good Short High
Roanoke Fair Poor Good Fair Late Good Fair Tall Med.
,;h'(
Good
Carolee Fair Good Fair Med. Good Good Med. Med.
Suregrain BRS Good Excellent Good Poor Early Poor Good IShort High
Coker 242 (62-42) Good Good Good Fair Med. Fair Good Med. High
';'( These characteristics based upon all available observations.
*
Table 4. Characteristics of wheat varieties.
Leaf Mildew Mosaic Lodging Height Test Soft rust res ist- resist- Maturity Winter resistance of Weight Wheat Variety resist- ance ance Hardiness Straw lb/bu. Milling
ance Quality
Knox Good Fair Good Early Good Poor Med. High Good Thorne Poor Poor Good Late Excellent Poor Tall Med. Good Wakeland Fair Good Poor Early Fair Good Short Med. Fair Coker 47-27 Fair Poor Poor Med. Fair Good Tall High Fair Coker Hadden Good Excellent Poor Early Fair Good Short Med. Fair Knox 62 ~h~ Good Fair Good Early Good Poor Medo High Good
~
Ga. 1123 Fair Poor Good Med. Fair Good Tall Med. Fair +' Coker 61-19 Poor Poor Good Late Good Good Tall Med. Good
*
These characterizations based upon all available observations.15
able 5. Summary of barley performance trials in the Piedmont.
Variety 1 yr. ave.:!./ 2 yr. ave.];.! 3 yr. ave.1.1 4 yr. ave.!!:./ 5 yr. ave.2/
or Line 1965 1964-1965 1963-1965 1962-1965 1961-1965
bu/A 1bs/bu belA 1bs/bu bu/A 1bs/bu bu/A 1bs/bu bu/A 1bs/bu
lvie 51.6 39.8 50.2 40.9 45.0 40.3 42.7 39.5 43.8 40.0
igers 66.8 43.1 66.8 44.3 55.9 45.1 51.4 44.9 53.8 45.2
ide 62.0 42.8 61.2 43.6 51.3 44.2 47.8 43.7 50.6 43.9
.Icn Lal, 2 58.7 39.7 58.5 40.6 49.1 39.4 46.0 38.9 48.7 39.5
irlyMarconee 59.6 42.1 55.9 4~.0 47.9 41.4 46.6 40.7 45.7 40.8
: 59-1018~/ 62.4 44.0 62.2 44.2 58.0 45.1 53.5 44.3
c. 29002./ 52.7 41.0 55.9 41.9
c. 15992./ 53.6 41.2 50.6 41.4
.rrison 73.0 44.8 74.1 46.0
: 60-3239 2./ 58.7 45.4
c. 19072./ 59.2 43.4
c. 25242./ 56.7 38.7
c. 21162./ 60.1 42.8
L-Jet 55.1 38.7
,S.D. (.05) N.S. 2.0
( .01) N.S. 2.7
,V. ( % ) 15 4
Average of Davidson, Randolph, Gaston and Guilford County locations.
Average of eight locations.
Average of ten locations.
Average of thirteen locations.
Average of seventeen locations.
Table 6. Summary of barley performance trials in the Coastal Plain.
Variety or Line
1 yr. ave.'l.! 1965 bu/A 1bs/bu
2 yr. ave.3..1 1964-1965 bu/A 1bs/bu
3 yr. ave.'i/ 1963-1965 bu/A 1bs/bu
4 yr. ave.!:!:./ 1962-1965 bu/A 1bs/bu
5 yr. ave)..! 1961-1965 bu/A 1bs/bu
Davie 41.4 39.0 51.4 41.0 49.5 40.2 44.3 39.8 47.2 39.9
Rogers 54.4 42.3 56.8 44.3 45.7 44.1 43.7 44.6 46.0 44.0
Wade 51.4 42.3 59.6 44.2 54.9 44.3 49.8 44.4 52.6 43.9
Colonial 53.7 40.0 57.2 41.2 53.6 40.4 48.9 40.0 51.9 39.8
Early Marconee 50.1 40.8 53.0 42.9 47.1 42.0 42.0 41.6 43.7 4104
Ga-Jet 48.0 37.9 48.1 40.4 45.6 39.3 42.8 38.6 44.4 38.5
SC59-1018§j 58.6 43.6 62.8 44.8 60.5 45.3 53.9 45.0
SC 60-3239 ~/ 46.5 46.8 41.4
Harrison 45.8 43.6 53.2 45.0
N. C. 2900 ~/ 46.3 41.8 53.2 43.0
No C. 1599 ~/ 48.8 39.2 53.0 41.5
N. C. 1907~/ 53.1 43.2
N. C. 2524 ~/ 49.2 38.9
N. C. 2116 ~/ 52.8 40.7
L.S.D. (.05) N.S. N.S.
(.01) N.S. N.S.
C.V. ( % ) 12 4
!/ Average of Edgecombe and Robeson County locations.
J:./ Average of five locations.
'if Average of eight locations.
1::./ Average of eleven locations.
17
Table 7. Summary of oat performance trials in the Piedmont.
Variety 1 yr. ave.!/ 2 yr. ave.!:./ 3 yr. ave.1./ 4. yr. ave.!!:./ 5 yr. ave.~j
''It' or Line 1965 1964-1965 1963-1965 1962-1965 1961-1965
~ bu/A 1bs/bu bu/A 1bs/bu bu/A 1bs/bu bu/A 1bs/bu bu/A 1bs/bu
H:
--Arlington 38.7 31.2 42.6 32.0 44.3 30.7 41.5 30.6 44.5 31.1
Jl':~oregrain 81.2 34.7 75.1 34.7 75.7 34.7 69.0 34.2 70.5 34.4
Caro1ee 103.1 31.6 87.6 32.0 86.2 30.9 75.7 30.8 74.5 31.3
I],:Ro anoke 82.8 35.4 77.2 35.6 81.0 33.7 74.4 33.2 73.3 33.8
Jl':,umter 84.9 32.2 77.0 31.9 80.5 32.1 72.8 31.6 73.3 32.0
\:",C 60-13459 f!../ 87.1 33.6 80.4 33.7 72.4 32.9
ltva•61-31-15 IrradLated 6/
85.9 35.0 79.4 35.5
Arlington
-)C 59-9803 §../ 88.9 33.9 80.0 33.6
~oker63-18f!../ 77.1 34.4 75.4 34.8 loker 242 (62-42) 84.9 34.9 81.4 35.0
iC60-15923&./ 82.4 34.1
l. C. 267 §../ 90.9 32.0
L C. 2469 §../ 85.2 32.2
~
.
C. 2534 §../ 95.8 33.1~. C. 1972 §../ 94.6 34.6
10regrain 62-11 §../89.8 34.7
•. S.D. (.05) 14.3 1.6
( .01) 19.1 2.1
:.V. ( % ) 13
:/ Average of Davidson, Gaston, Randolph and Guilford County locations.
:/
. Average of seven locations.
:IAverage of eight locations.
~/ Average of eleven locations. if
- Average of fifteen locations •
Table 8. Summary of oat performance trials in the Coastal Plain.
Variety or Line
1 yr. ave.1/ 1965 bu/A 1bs/bu
2 yr. ave.!) 1964-1965 bu/A 1bs/bu
3 yr. ave.'}..! 1963-1965 bu/A 1bs/bu
4 yr. ave.3:/ 1962-1965 bu/A 1bs/bu
5 yr. ave.1/ 1961-1965 bu/A 1bs/bu
Moregrain 82.2 37.2 78.9 36.4 72.9 35.2 68.4 35.4 71.5 35.3
Caro1ee 87.2 33.2 72.0 34.6 68.3 33.3 68.6 33.4 71.3 33.2
Suregrain 74.5 35.1 73.4 34.7 70.3 33.5 68.0 33.9 72.4 34.0
Roanoke 64.5 33.9 56.8 35.7 55.2 33.9 56.8 33.9 61.1 33.8
Sumter 85.3 34.2 80.8 34.2 79.3 33.7 79.6 33.6 82.9 33.7
SC 60-13459 ~/ 75.2 34.9 74.1 34.7 70.7 33.9
v«, 61-31-15 Irradiated 6/
70.3 34.9 6604 36.2
Arlington
-Coker 63-18 ~/ 79.6 37.2 77.4 36.7
Coker 242 (62-42) 84.9 36.1 83.3 35.6
SC 59-9803~/ 95.7 34.8 87.0 35.2
SC 60-15923 ~/ 69.2 34.3
N. C. 267~/ 90.4 33.9
N. C. 2469~/ 77.1 33.4
N. C. 2534 ~/ 85.1 34.8
N. C. 1972§j 78.3 35.6
Moregrain 62-11 ~/86.0 37.5
L.S.D. (.05) N.S. 2.1
(.01) N.S. 2.8
C. V. ( % ) 11 2
1/ Average of Lenoir, Robeson and Edgecombe County locations. l/ Average of six locations.
1/ Average of nine locations.
~/ Average of twelve locations.
19
~ab1e9. Summary of wheat performance trials in the Piedmont.
1;1,: Variety 1 yr. 1/ 2 yr. 2/ 3 yr. ave
.1.1
4 yr. ave.!!:./ 5 yr..:»
or Line ave.-
ave.-l'li; 1965 1964-1965 1963-1965 1962-1965 1961-1965
~ bu/A 1bs/bu bu/A 1bs/bu bu/A 1bs/bu bu/A 1bs/bu bu/A 1bs/bu
II,i:nox 39.4 60.1 43.1 59.8 42.7 60.3 41.0 59.6 41.4 59.2
Il,l rake1and 39.9 58.4 39.9 58.3 41.6 58.5 40.0 57.9 41.2 57.8
I~,(Iadden BRS 41.3 58.2 39.7 58.3 39.5 58.3 37.8 57.8 39.0 57.8
Il,:a. 1123 46.8 59.2 48.2 58.7 46.8 58.5 44.8 57.7 46.4 57.5
lJ,l:nox 62 48.1 60.3 46.0 59.4 45.4 60.0 41.8 59.4
oke r 61-19 45.2 56.9 44.2 58.0
• C. 4672 ~/ 55.0 56.6 54.9 56.6
C60-9149 ~/ 42.4 59.9
urdue 6/
52l0B9-l2-l-l2 - 44.1 60.1
.V. ( .05) ( .01)
( % )
9.0
N.S.
11 2.5
N.S.
/ Average of Gaston, Guilford and Randolph County locations •
.IAverage of six locations •
.IAverage of eight locations.
/ Average of eleven locations.
/ Average of fifteen locations.
Table 10. Summary of wheat performance trials in the Coastal Plain.
Variety or Line
1 yr. ave
.1.1
1965 bu/A 1bs/bu2 yr. ave.]) 1964-1965 bu/A1bs/bu
3 yr. ave
.1.1
1963-1965 bu/A 1bs/bu4 yr. ave.!!./ 1962-1965 bu/A 1bs/bu
5 yr. ave.'ll
1961-1965 bu/A 1bs/bu
Wakeland 47.8 58.7 45.5 57.8 44.8 58.2 43.3 57.8 41.7 57.8
Hadden BRS 47.8 58.4 46.9 57.8 45.8 58.3 43.6 58.0 41.5 57.9
Ga. 1123 46.4 57.5 46.5 56.8 46.0 57.4 45.0 57.3 43.4 57.0
Knox 40.0 58.9 39.0 58.0 36.0 58.7
Knox 62 39.2 59.2 38.0 58.1 34.3 58.8
Coker 61-19 35.8 58.7 42.2 58.2
N. C. 4761 §./ 40.6 56.4 44.3 55.8
N. C. 4672 §./ 54.0 560 2 55.8 55.8
N. C. 4662 §./ 39.9 53.6
N. C. 3831 §./ 40.1 52.0
SC 60-9149 §./ 40.1 58.8
Purdue 6/
5210B9-12-1-12 - 32.4 58.4
L.S.D. (.05) ( .01)
C. V. ( % )
10.6 1.4 N.S. 1.8
1/ Average of Lenoir, Robeson and Edgecombe County locations.
l:./ Average of six locat ions.
1/ Average of nine locations.
~/ Average of twelve locations.
1/ Average of fifteen locations.
21 Table 11. Lodging Data - 1965
Variety or Line Barley
1.1
Early Marconee SC 60-3239 N.C. 2900 N.C. 1907 N.C. 2524 N.C. 2116 N.C. 1599 Davie Rogers Wade Colonial 2 Ga-Jet Harrison SC 59-1018 Oats ];.1 SC 60-13459 SC 60-15923 SC 59-9803 Sumter Va. 61-31-15 Irradiated Arlington N.C. 267 N.C. 2469 N.C. 2534 N.C. 1972 Moregrain BRS Moregrain 62-11 Coker 242(62-42) Coker 63-18 Carolee Roanoke Suregrain Arlington Wheat11
sc 60-9149 N.C. 4761 N.Co 4672N.C. 4662 N.C. 3831 Hadden BRS Coker 61-19 Knox Wakeland Ga. 1123 Knox 62 Purdue 5210B9-12-1-l2
II
21
Average of four locations.31 Average of six locations. - Average of three locations.
Lodging Per Cent