Spectrogram Analysis of Genomes
David Sussillo
Department of Electrical Engineering, Columbia University, NY 10027, USA Email:[email protected]
Anshul Kundaje
Department of Electrical Engineering, Columbia University, NY 10027, USA Email:[email protected]
Dimitris Anastassiou
Department of Electrical Engineering, Center for Computational Biology and Bioinformatics (C2B2) and Columbia Genome Center, Columbia University, NY 10027, USA
Email:[email protected]
Received 28 February 2003; Revised 22 July 2003
We perform frequency-domain analysis in the genomes of various organisms using tricolor spectrograms, identifying several types of distinct visual patterns characterizing specific DNA regions. We relate patterns and their frequency characteristics to the sequence characteristics of the DNA. At times, the spectrogram patterns can be related to the structure of the corresponding protein region by using various public databases such as GenBank. Some patterns are explained from the biological nature of the corresponding regions, which relate to chromosome structure and protein coding, and some patterns have yet unknown biological significance. We found biologically meaningful patterns, on the scale of millions of base pairs, to a few hundred base pairs. Chromosome-wide patterns include periodicities ranging from 2 to 300. The color of the spectrogram depends on the nucleotide content at specific frequencies, and therefore can be used as a local indicator of CG content and other measures of relative base content. Several smaller-scale patterns are found to represent different types of domains made up of various tandem repeats.
Keywords and phrases:DNA spectrograms, frequency-domain analysis, genome analysis.
1. INTRODUCTION
Color spectrograms of biomolecular sequences were intro-duced in [1,2] as visualization tools providing information about the local nature of DNA stretches. These spectrograms give a simultaneous view of the local frequency throughout the nucleotide sequence, as well as the local nucleotide con-tent indicated by the color of the spectrogram. They are help-ful not only for the identification of genes and other regions of known biological significance, but also for the discovery of yet unknown regions of potential significance, character-ized by distinct visual patterns in the spectrogram that are not easily detectable by character string analysis. Further, they have been found to give global information about whole chromosomes as well.
In this paper, we discuss the features and patterns that such spectrograms reveal. We applied a slightly modified version (described below) of the spectrogram development tool introduced in [1,2] that provides a more direct man-ifestation of the local relative nucleotide content in the color of the spectrogram, and explored the patterns
char-acteristic in the genomes of various organisms. We created color spectrograms of various frequency bandwidths and se-quence lengths. Although the genomes of these organisms vary greatly in size, chromosome number, and complexity, we found many interesting features, some of which are com-mon to all organisms and some are unique to a particular or-ganism. Some of the uncovered patterns relate to the overall chromosome structure or to protein coding. On some occa-sions, the specific function of a protein could be understood by visual comparison to other proteins.
We analyzed some parts of the genomes from E. coli,
M. tuberculosis, S. cerevisiae, P. falciparum, C. elegans, D.
melanogaster, and H. sapiens, viewing chromosomes and
and sequence resolutions so that the prominent frequencies were accurately highlighted and thus we were able to view different features of the chromosome with great precision. When possible, we referenced the subsequence from which the pattern was created with various public databases to fur-ther ascertain the function of the region. We then annotated the patterns with the type of pattern, prominent periodici-ties, position in the chromosomal DNA sequence, and cor-responding position in the protein sequence if the DNA was coding. Thus, we related pattern shape and color to signifi-cant structural and functional elements in the genome. Most of our searches were exhaustive, and the patterns shown in this paper are exemplary of myriad patterns in the various genomes.
The spectrograms were developed using the short-time Fourier transform, that is, by applying theN-point discrete Fourier transform (DFT) over a sliding window of size N. The difficulty in creating DNA spectrograms results from the fact that DNA sequences are defined by character strings rather than numerical sequences. This problem can be solved by considering thebinary indicator sequences uA[n],uT[n], uC[n], anduG[n], taking the value of either one or zero
de-pending on whether or not the corresponding character ex-ists at locationn. These four sequences form a redundant set because they add to 1 for alln. Therefore, any three of these sequences are sufficient to determine the character string. In [1,2], color spectrograms are defined by creating RGB super-position, using the colors red, green, and blue, of the spectro-grams for the numerical sequences
xr[n]=aruA[n] +truT[n] +cruC[n] +gruG[n], xg[n]=aguA[n] +tguT[n] +cguC[n] +gguG[n], xb[n]=abuA[n] +tbuT[n] +cbuC[n] +gbuG[n],
(1)
in which, to enhance the discriminating power of the visual-ization, the coefficients in the above equations are chosen by assigning each of the four letters to a vertex of a regular tetra-hedron in the three-dimensional space. In the present im-plementation, we further improve the discriminating power by ensuring that all points in the tetrahedron have different absolute values with respect to any axis using the following choice of coefficients:
ar=0, ag=0, ab=1,
tr=0.911, tg= −0.244, tb= −0.333, cr=0.244, cg=0.911, cb= −0.333, gr= −0.817, gg= −0.471, gb= −0.471.
(2)
To illustrate, we first consider three examples that demon-strate both the use of color and periodicity in the spectro-gram. The horizontal axis indicates the location in the DNA sequence measured in base pairs (bp) from the origin and the vertical axis indicates the discrete frequency of the DFT measured in cycles per STFT window size. The correspond-ing period is equal toN/k, wherekis the discrete frequency andNis the STFT window size.
Unlike the traditional spectrograms that employ pseudo-color to achieve greater contrast, the spectrograms that are used to visualize DNA sequences contain useful information
Random 1 60000 60 K 10000 500 1 500 50
Figure 1: Spectrogram of a random DNA sequence of length 60 kbp. No obvious patterns are discernable. Spectrogram titles are annotated with a helpful name or accession tag, sequence-start in-dex, sequence-end inin-dex, approximate sequence length, DFT win-dow size, winwin-dow overlap, lowest frequency shown in image, and highest frequency shown in image.
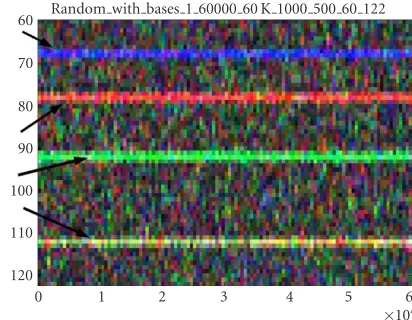
Random with bases 1 60000 60 K 1000 500 60 122 60
Figure2: Spectrogram of random DNA of length 60 kbp with bases A,T,C, andGwith periods 15, 13, 11, and 9, respectively. The nu-cleotideAis represented by the color blue,Tby red,Cby green, and Gby yellow. Arrows mark the different periodicities.
NC 000913 1 4639221 5 M 10000 0 1 5000
500
1000
1500
2000
2500
3000
3500
4000
4500
5000
0 0.5 1 1.5 2 2.5 3 3.5 4 4.5
×106
Figure3: Spectrogram of the entireE. coliK12 chromosome (about 4.6 Mbp). The line marking the 3-base periodicity of protein-coding regions extends without a visible break across the entire chromosome. There is a change in color going from higher frequencies (greenish) to lower frequencies (purplish).
so that every 15 nucleotides, there is an A; every 13 nu-cleotides, there is aT; every 11 nucleotides, there is aC; and every 9 nucleotides, there is aG. This figure demonstrates that even in complicated sequences,Ais mapped by the color blue,Tby red,Cby green, andGby yellow.
2. CHROMOSOME-WIDE PATTERNS
Distinguishing patterns by their size makes a simple cate-gorization. Those patterns composed of millions of bp are considered large; those that are composed of up to sev-eral hundred thousand nucleotides are medium; and those patterns consisting of up to several thousand bp are small. Typically, larger patterns represent structural elements and smaller patterns are useful in visualizing something about a protein-coding region. Here, we focus first on large patterns. In doing so, we focus on the general characteristics of the chromosome-wide spectrogram.
2.1. E. coli
Figure 3shows the spectrogram of the entire chromosome
for the bacteriaE. coliusing STFT window sizeN=10 000. The count among all nucleotides inE. coliis roughly equal (A=1142136,T=1140877,C=1179433,G=1176775) and the total number of nucleotides is over 4.6 Mbp. The most salient feature is the strong intensity with periodicity 3 (frequency 3333) that corresponds to protein-coding regions. The fact that protein-coding regions in DNA typically have a peak at the frequency of 3 periodicity in their Fourier spectra is
well known [3, 4,5,6]. The whiteness of this line shows that most of the bases are being used in protein coding, and this is clearly reflected by the continuity and intensity of the line with periodicity 3. Second, at regular intervals along the DNA sequence, there appear thin veins of purple, imply-ing AT rich areas intermittently placed along chromosome. Finally, there is a general shift in hue as the frequency de-creases. The larger frequencies are more greenish in hue and the lower frequencies are more purplish. The purplish hue extends over from about the 6.5-base periodicity and up-wards and shows that even while apparently coding for genes almost everywhere on the chromosome, the chromosome is also preserving higher periodicities involving the nucleotides AandT. This is particularly interesting considering that the total number of each of the four bases in the genome is nearly equal. The purplish hue in the lower frequencies may be re-lated to the twisting of the DNA molecule that leads to helical repeats.
2.2. C. elegans chromosome III
We now turn our attention to the multicellular organism
C. elegans.Figure 4 shows the DNA spectrogram of
chro-mosome III. The general hue of the spectrogram is darker than that ofE. coli. This relates directly to the relative num-ber of bases in chromosome III (A=4444502,T=4423430, C=2449072, G=2466240). The horizontal line of intensity marking the 3-base periodicity is much less pronounced
thanE. coliin that there are more gaps along the sequence.
C. elegansIII 1 13783268 14 M 10000 0 1 5000
500
1000
1500
2000
2500
3000
3500
4000
4500
5000
0 2 4 6 8 10 12 ×106
Figure4: Spectrogram of the chromosome III ofC. elegans(13.8 Mbp). The 3-base periodicity relating to protein coding is noted. A mini-satellite is noticeable at 7.4 Mbp (seeFigure 16). Various periodicities are noticeable, in particular, the purple 10+-base periodicity in both chromosome arms and coincident 8, 9-base and green 3.8-base periodicities in the right chromosome arms.
contains more noncoding DNA such as intergenic DNA and introns. In the middle of the spectrogram, there is a vertical bar that identifies a “minisatellite,” roughly 50 kbp in length. The details of minisatellites are explained inSection 3.1. On some regions, there are strong horizontal bands of intensity between the frequencies representing the 8-base periodicity and 9-base periodicity (at 8.7) and also just above 10 (at 10.2, which we call the “10+ periodicity”) throughout the en-tire chromosome. In the right part of the spectrogram, (close to 12 Mbp) there are strong periodicities involving the color green and thus the bases GC at 3.9.
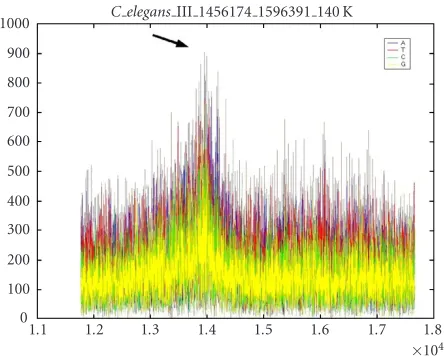
The 10+ periodicity appears to be of special importance.
Figure 5shows the magnitude plot of the DFT for the four
nucleotides in the subsequence 1456174−1596391. Each sep-arate base is plotted with a different color. The frequency range shown corresponds to periods 8 through 12. The pe-riodicities at 10+ are the strongest in the basesA&T(area indicated by arrow). This periodicity may relate to DNA he-lical structure, which has a periodicity of 10.4 bp on average [7,8,9,10]. The 10+ periodicity may also be related to fold-ing around nucleosomes, as the nucleotidesAandTare pre-ferred in the minor grove when binding to the nucleosome core. The DNA double helix kinks when wrapped around the nucleosome core, thus reducing its helical periodicity to 10.39±0.02 bp [9]. We found that the maximal intensity of this band has a 10.2-base periodicity.
We further searched chromosome III of C. elegans at much lower frequencies and found a 1.5 Mbp long (0.8 Mbp–
C elegansIII 1456174 1596391 140 K 1000
900 800 700 600 500 400 300 200 100 0
1.1 1.2 1.3 1.4 1.5 1.6 1.7 1.8 ×10⁴
Figure 5: DFT magnitude plot of 140 Kbp section ofC. elegans chromosome III showing higher values at period 10+ in all bases, but particularlyAandT. An arrow marks the peak in the periodic-ity range of 9.9–10.5.
2.6 Mbp subsequence) bubble centered on period 300. This was accomplished using a DFT window size of 40000.
Figure 6shows this spectrogram with the two bubbles
C elegansIII 787206 2600147 2 M 40000 32500 15 301
50
100
150
200
250
300
0.8 1 1.2 1.4 1.6 1.8 2 2.2 2.4 2.6 ×10⁶
Figure6: Spectrogram showing an intensity increase around a pe-riodicity of 300 in C. elegans chromosome III. The sequence is roughly 2 Mbp in length. Arrows mark two such areas.
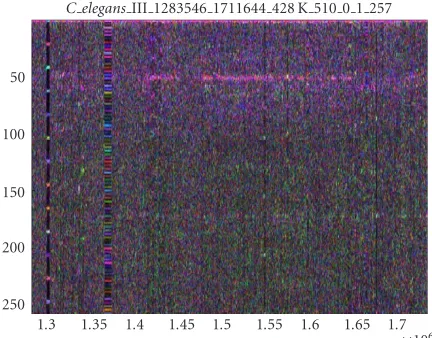
C elegansIII 1283546 1711644 428 K 510 0 1 257
50
100
150
200
250
1.3 1.35 1.4 1.45 1.5 1.55 1.6 1.65 1.7 ×10⁶
Figure7: Spectrogram showing a strong coincident 10+-base peri-odicity in the same DNA sequence shown inFigure 6(coincident with 300-base periodicity). This spectrogram corresponds to the rightmost arrow inFigure 6and is 428 Kbp in length.
shows the same area of the chromosome (1.4 Mbp–1.6 Mbp) at higher frequency resolution, thus showing smaller period-icities. There appears to be coincident intensity at 10+ period in exactly the same area of intensity in the 300-period bubble. In general, it appears that there are both “antago-nism” and “cooperation” between various periodicities in all the chromosomes that we analyzed. For example, the arms of C. elegans chromosome III show obvious cooper-ation among many periodicities appearing simultaneously
(Figure 7). Some cooperative periodicities are harmonics of
a fundamental periodicity, indicating a repeat region (see
Section 3.1). On the other hand, Figure 8, a subsection of
chromosome V ofC. elegans, shows an example of antago-nism between the 3-base periodicity and the 10+-base
pe-C elegansV 17794452 18103141 309 K 600 300 38 209 40
60 80 100 120 140 160 180 200
1.78 1.785 1.79 1.795 1.8 1.805 1.81 ×10⁷
Figure8: Spectrogram showing antagonism between 10+-base and 3-base periodicities inC. eleganschromosome III (300 Kbp). The 10+-base periodicity is at the top of the figure while the 3-base pe-riodicity is shown at the very bottom.
C elegansIII 11862447 12051402 189 K 990 790 56 366 18
12 8.5 6.8 5.6 4.8 4.2 3.7 3.3 3 2.8
1.188 1.192 1.196 1.2 1.204 ×10⁷
Figure9: Spectrogram of 189 Kbp section of the right arm ofC. ele-ganschromosome III. Note that the periodicity is shown on the ver-tical scale. The arrows point to sections of the spectrogram, show-ing a sshow-ingle instance of the highly dispersed repeat family. Varia-tions of the pattern can be seen throughout the spectrogram. A purple 8.75-base periodicity, as well as a green 3.9-base periodic-ity, identifies this family of strings. The harmonics between 3.9 and 8.75 (the beads of color between 3.9 and 8.75) change color from one repeat to another, indicating that they are different but related strings. These tandem repeats are non-protein-coding regions. The 10+-base periodicity is antagonistic with the repeat family. This pat-tern is found over 3 Mbp of the right arm of the chromosome.
riodicity. The brightest spots on the 3-base periodicity are the dimmest spots on 10+-base periodicity and vice versa. An explanation may be that in non-protein-coding regions, the periodicities due to structural constraints are more pro-nounced.
Human XXII 1 33821705 34 M 10000 0 1 5000
500
1000
1500
2000
2500
3000
3500
4000
4500
5000
0 0.5 1 1.5 2 2.5 3
×107
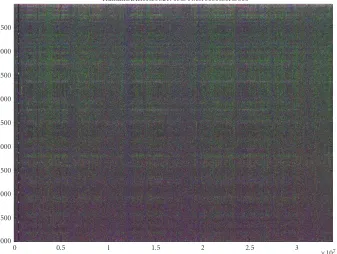
Figure10: Spectrogram of human chromosome 22. Noticeably absent is the line representing the 3-base periodicity relating to protein coding. The 800 or so genes located on chromosome 22 simply do not cover enough of the chromosome to make a visible line at the resolution of 34 Mbp. Many periodicities are visible across the entire length of the chromosome.
chromosome III (10–13 Mbp), it appears that the AT rich 8.75-base periodicity almost always coincides with the GC-rich 3.9-base periodicity (Figure 4). In fact, the pattern found in the right arm of chromosome III, which shows cooperative periodicities at the chromosome level, is composed of a fam-ily of strings that are repeated in a very haphazard fashion. These strings are both heavily mutated and heavily dispersed throughout the chromosome. Yet throughout the many vari-ations within the family, the 8.75-base and 3.9-base period-icities are always conserved. One instance of a repeat unit is “tttccggcaaattggcaagctgtcggaatttaaaa.”Figure 9shows how the family of strings manifests within the DNA. An instance of the family repeats for a hundred to a couple thousand bp, and these regions are interspersed among other DNA every 10 Kbp or so. Repeats of this family of mutated strings, un-believably, are responsible for the macroscopic character of the right arm (3 Mbp region) of chromosome III (Figure 4). It is unclear whether or not the conserved periodicities imply a conserved biological function for the string, or whether it is simply a mathematical or biological property of this fam-ily of strings that certain of its periodicities are more easfam-ily preserved against mutation.
2.3. Human chromosome 22
The last full chromosome we analyzed was human chromo-some 22. The actual sequence used was the correct reorder-ing of contigs found in hs chr22.fa from NCBI. This orderreorder-ing is: NT 011516.5, NT 028395.1, NT 011519.9, NT 011520.8,
NT 011521.1, NT 011522.3, NT 011523.8, NT 030872.1, NT 011525.4, NT 019197.3, and NT 011526.4. Figure 10
shows the 33 million-plus nucleotides of human chromo-some 22. A strong bar of intensity representing the 3-base periodicity is strikingly absent. Closer inspection shows that there are many genes along chromosome 22 but they are far enough apart so that there is no noticeable band. There are around 30 easily noticeable, different periodicities that span the entire length of the chromosome. The biological func-tion of these periodicities is unclear. Some periodicities may reflect higher periodicities in the form of harmonics.
NT 011520 8 1 23083944 23 M 40000 0 1 20000
150
200
250
300
350
400
450
0.2 0.4 0.6 0.8 1 1.2 1.4 1.6 1.8 2 2.2 ×10⁷
Figure 11: NT 011520.8 (23 Mbp in length) of human chromo-some 22. The two artificial black lines mark the 150-base and 200-base periodicities. This band of intensity may relate to the folding of DNA into nucleosomes.
Human XXII 1 33821705 34 M 10000 0 1 5000 500
1000 1500 2000 2500 3000 3500 4000 4500 5000
0 0.5 1 1.5 2 2.5 3
×107
Figure 12: Spectrogram of human chromosome 22 matched up with a part of the Giemsa-stained schematic of the same chromo-some. There is a visual agreement between AT-rich regions and dark bands of Giemsa staining.
viewed contig NT 011520.8 (23 Mbp in length) of chromo-some 22 with a very large DFT window in order to get high-frequency resolution.Figure 11shows contig NT 011520.8 in the frequency range to show the 200-base periodicity. Two dark lines mark the 150-base periodicity and the 200-base periodicity, indicating a band of increased intensity between these markers. This intensity band may represent periodici-ties involved in nucleosome-chromatin superstructure. This 150−200-base periodicity band was the only one found in our exploration of various chromosomes. The 150−200-base periodicity was the largest periodicity found in the human chromosome 22.
We found an interesting feature of human chromosome 22 in the variation of the CG versus AT rich regions. As
men-NT 011519 9 2894684 2896815 2 K 120 119 1 64
10
20
30
40
50
60
2.8948 2.8952 2.8956 2.896 2.8964 2.89 ×10⁶
Figure13: Spectrogram showing two CpG islands separated by a sequence very rich in the nucleotideA. Both islands yielded blast results showing T-box genes.
tioned earlier, the color of the DNA spectrogram reflects the ratio of different nucleotides in the sequence (Figures1and
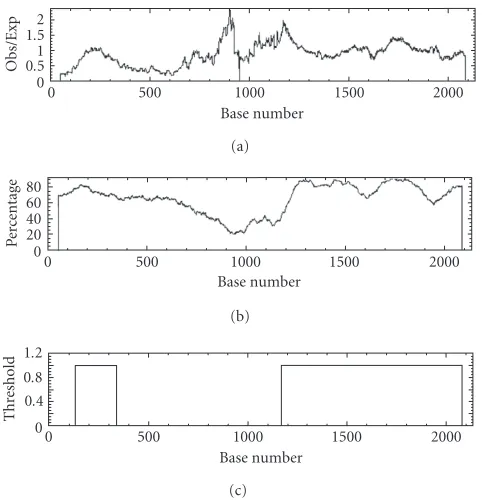
2). Different genomes vary greatly in the percentages of nu-cleotides that compose the sequence. As shown inFigure 10, a single chromosome can have long expanses of a single dis-tribution of bases.Figure 10shows clear boundaries between areas of high CG content and areas with lower GC content. The laboratory technique of Giemsa staining is correlated to the relative content of CG nucleotides. The GC-rich regions of DNA are responsible for the light bands in Giemsa stain-ing while GC-poor regions create the dark bands [12]. We matched up a schematic of human chromosome 22 marked by Giemsa staining with our DNA spectrogram and found a reasonable alignment between the dark bands of the Giemsa stained chromosome schematic and the darker, purplish AT regions of the spectrogram (Figure 12). The match was made by aligning the rightmost part of the spectrogram with the “bottom” of the chromosome, that is, contig NT 011526.4. Because the spectrogram encodes different colors for each different base, it is easy to get a feeling for the relative number of bases in a sequence.
0 0.15 1.5 2
O
b
s/Exp
0 500 1000 1500 2000
Base number (a)
0 20 40 60 80
Pe
rc
en
ta
ge
0 500 1000 1500 2000
Base number (b) 1.2
0.8 0.4 0
Thr
eshold
Base number
0 500 1000 1500 2000
(c)
Figure14: Graphs showing the results from the emboss CpGplot routine. (c) shows the predicted CpG islands (putative islands).
NT 011520 8 10200047 10347465 147 K 510 500 1 257 36
13 8.2 5.9 4.6 3.8 3.2 2.8 2.5 2.2 2
1.022 1.026 1.03 1.034 ×10⁷
Figure15: Spectrogram of a 147 Kbp section of human chromo-some 22. Periodicity is shown on vertical scale. Contrasted with Figure 9, this spectrogram shows that the chromosome-wide peri-odicities found in human chromosome 22 are qualitatively differ-ent from those found in the right arm of C. elegans chromosome III. The periodicities here are much more finely embedded in the DNA and do not represent any obvious family of strings discretely interspersed throughout the region. Arrows point out some of the chromosome-wide periodicities found inFigure 10.
share a common binding domain, called the T-box. Finding this gene is in keeping with the idea that CpG islands encode for housekeeping genes.
Finally, we wondered whether or not the chromosome-wide periodicities found in human chromosome 22 are caused by a highly dispersed repeat family similar to that
found in the right arm ofC. eleganschromosome III. This ap-pears not to be the case. The macroscopic appearance of peri-odicities inC. elegansis caused by widely placed repeats with such strong characteristics as shown at the macroscopic level. In the case of human chromosome 22, it appears as if the very fabric of intergenic DNA is woven with a string patterns that employs characteristic periodicities seen at the chromosome level (Figure 15). In other words, it appears as if the major-ity of intergenic DNA carries the periodicities found at the macroscopic level. Initial investigations show that these em-bedded periodicities are not found in chromosome 17 of the mouse.
3. SMALL PATTERNS
We now turn our attention to smaller subsequences of in-terest in various genomes. Color spectrograms can clearly identify, by their special signatures, several patterns includ-ing repetitive areas of biological significance such as particu-lar triplet repeats [14], GATA repeats [15], or other charac-teristic repeating motifs in protein structures [16].
C. elegansIII 7397884 7467608 70 K 510 400 1 258
50
100
150
200
250
7.4 7.41 7.42 7.43 7.44 7.45 7.46 ×10⁶
Figure 16: Spectrogram showing a minisatellite with repeat unit of length 95 bp in chromosome 3 of C. elegans. Slight variations in the basic repeat pattern can be seen as vertical lines that appear blurry. The minisatellite is interrupted by a small amount of nonre-peat DNA as well as an even simpler renonre-peat unit of length 5 kbp.
We used a number of public databases during our anal-ysis of DNA color spectrograms. The determination of whether or not a sequence was protein coding was accom-plished using the SGD and GenBank databases. We also noted structural and functional details of the correspond-ing protein. Domains and motifs correspondcorrespond-ing to the pro-tein region were discovered using PFAM, CYGD, and SWISS-PROT databases for yeast, WormPD forC. elegans, and Gen-Bank annotations for humans. Structural predictions were obtained using Pedant (CYGD) and GCG PepStruct (SGD). To test specifically the beta-helix supersecondary structure, the Betawrap program (Betawrap) was used.
At smaller length scales, the parameters of the STFT are very important in visualization; we initially experimented these parameters with different DFT window sizes for the spectrogram. It was found that using roughly 6 K nucleotides per spectrogram image with a DFT window size of 120 and an overlap of 119 gives the most optimal visualization of protein-coding regions. The choices of DFT window size and overlap were found to be particularly important in determin-ing the pattern shape.
3.1. Minisatellites
The genome has repetitive regions varying in range from 500 bp to 100 kbp in length. These regions are composed of a smaller repeat unit that varies in length. If the length of the repeat unit is below 100, then the overall repeat region is called a minisatellite or variable number of tandem repeats (VNTR). Minisatellites have been found to vary in the number of tandem repeats in different germ cells and thus, make useful genetic markers [17]. A minisatellite composed of roughly 30 kbp was found inC. eleganschromosome III
(Figure 16). It is also visible in the middle ofFigure 4. The
tandem repeat is composed of the 95 bp-long unit sequence “ttttgataattactgcctccagaaattgatgattttcccattgatttgtctacatagggca
NC 004354 15736949 15794106 57 K 990 500 2 497
50 100 150 200 250 300 350 400 450
1.574 1.575 1.576 1.577 1.578 1.579 ×10⁷
Figure17: Spectrogram showing 40 kbp minisatellite in chromo-some X ofD. melanogaster. The repeat length is 298 bp. Three strong interruptions can be seen as vertical lines just right of the center.
tcgaaaagcacccaatatttagagaacagaaga” and slight variants. Ac-cording to “WormBase,” this subsequence of chromosome III is completely unannotated. Another 40 kbp minisatellite was found in chromosome X ofD. melanogaster(seeFigure 17). The tandem repeat sequence is composed of the 298 bp-long unit sequence “ttcatttcaagaatccagtgcagaagaaaatcaaatgacagaa gtgccatggacactatcaacatcactttcccaatcaagttcaaaaacaaagaatatattt tcgagtcaaagtgtaaatgaagacaacatttctcaagaagatacaaggacaccatcaa tatctgtcccacaatcaagtacaacagcaaatagattacttacaggttcgggtgcagaa gagccaacagctcaagaggagacatcggaactttcaaaatccttacctcaattaacaa cagaagagagcagttcattt.” The GenBank file indicates that the location of the predicted gene CG32580 is in the region 15740143-15792683. Both minisatellites are large enough to be identifiable when viewed from a spectrogram of the entire chromosome.
Spectrogram visualization of DNA repetitive areas, in-cluding minisatellites, microsatellites, and the other smaller tandem repeats that we will discuss, gives an immediate in-dication of the repeat length T. If the DFT window sizeN is sufficiently large to capture the fundamental frequency k=N/T, then all the harmonics will appear as equally spaced horizontal lines at the integer multiples of N/T up to (and including if present) the “maximum” frequencyN/2. There-fore, the numberLof horizontal lines that appear in the spec-trogram (without counting the omnipresent DC frequency) will be the integer part of half the repeat lengthT. Conversely, the repeat length can be deduced by inspection of the spec-trogram as 2LifLis even, or 2L+ 1 ifLis odd. The color of each harmonic shows the contribution from the different bases.
Intergenic tandem repeats are interesting because of their mutagenic properties. It is known that there are large numbers of intergenic tandem repeats in the form of mi-crosatellites and minisatellites in higher organisms. InC.
el-egans, there are around 38 defined dispersed repeat
NC 001133 202523 208652 6 K 120 119 1 61
10
20
30
40
50
60
2.03 2.04 2.05 2.06 2.07 2.08 ×10⁵
Figure18: Spectrogram showing the quilt in protein FLO1 corre-sponding to the flocculin domain.
as mutagenic elements. Many of the dispersed repeat fami-lies have been found to be relics of transposon famifami-lies no longer active. Autosome arms tend to have high recombina-tion rates as compared to the central regions. We found that spectrogram analysis confirms that there are relatively large numbers of repeat patterns in the autosome arms. Some of these repeat clusters were also found in closely related genes. This suggests that these regions may be sites of random mu-tations and may be rapidly evolving to give rise to new genes and gene families.
3.2. Smaller tandem repeats—quilts, shafts, and bars
After detailed analysis of all the 16 nuclear chromosomes
of S. cerevisiae (GenBank accession numbers NC
001133-NC 001148) as well as sections of the C. elegans, D.
melanogaster, and human genomes, we identified three
ba-sic types of patterns, to which we refer as “quilts,” “shafts,” and “bars,” based on their appearance. All three patterns represent tandem repeats, but the repeat-unit length differs between them. These were not found to be exhaustive but merely illustrative of patterns in the various genomes. Many genes were found to be composites of these patterns. We dis-covered that quilts, shafts, and bars could be used to predict the homology, structure, and function of proteins. In yeast, most of these patterns were part of the protein-coding re-gions. However, in the higher organisms, the patterns were also found in the intergenic and intronic regions.
Quilts (Figure 18) are relatively rare patterns in the yeast genome. They appear as beating, repetitive patterns at al-most all frequencies over relatively long stretches of DNA. If present in the coding regions of genes, quilts represent pro-tein domains consisting of large tandem repeats. We found quilts representing repeats of up to 45 amino acids (135 bp). Bars (Figures 20 and 21) and shafts (Figure 22) show strong periodicities uniformly over a stretch of coding DNA. Shafts differ from bars in that they are thin and have few dominant periodicities, causing black areas along most of the other frequencies in the spectrograms. In other words,
FLO1
(a)
FLO5
(b)
FLO9
(c)
FLO10
(d)
Figure19: Four spectrograms of FLO genes 1, 5, 9, and 10. Quilts can be seen in all four genes. Close inspection of (a) and (b) shows that (b) is a subsection of (a). FLO9 (c) shows the same coloration as the other three upon reverse complementation.
the basic repeat sequence is smaller in shafts than bars. Bars and quilts with similar appearances, having similar frequency patterns and colors, were found to be homologous as con-firmed by BLAST alignment scores, database annotations, and literature.
It should be noted that a quilt appears as a quilt and not as a bar because the DFT window size (typically 120 for view-ing proteins) used to create these spectrograms is smaller than the base repeat unit length (135 bp in this case). Al-though the distinction between quilts and bars is artificial, we found the distinction to be useful since we could diff eren-tiate high complexity repeats from lower complexity repeats while still maintaining an appropriate sequence resolution for viewing protein-coding regions.
3.2.1. Quilts—yeast flocculation genes
NC 001146 153 6371 6 K 240 220 1 124
20
40
60
80
100
120
1000 2000 3000 4000 5000 6000
Figure20: Spectrogram of the YRF1-6 gene. The bar region cor-responds to a highly conserved domain in Y-helicase subtelomeric open reading frames.
YRF1-1
(a)
YRF1-2
(b)
YRF1-3
(c)
YRF1-4 and YRF1-6
(d)
Figure 21: Four spectrograms showing similarity between YRF1 genes 1, 2, 3, 4, and 5. The genes have very similar spectrograms.
dependent on the length of the repeated sequences which are thought to act as spacers to expose a reacting domain at the cell surface. The flocculin repeats that endow the protein with a crucial part of its function are directly visible in the color spectrogram.
Other cell wall proteins whose DNA sequences show quilts are FIT1 (cell wall iron transport) and DAN4 (cell wall mannoprotein). The human MUC2 protein encoded in chro-mosome 11 of the human genome also shows a large quilt spanning several thousands of nucleotides. This protein is found to have a high BLAST alignment score with FLO1. It is a secreted surface protein that coats the epithelia of
in-testines, airways, and other mucus membrane containing or-gans. A common feature is that these proteins have their lo-calization in and around the cellular membrane. Thus, it is possible that the domains represented by quilts cause their proteins to have particular conformations and/or binding sites that function along the cell surface or lead to cell sur-face localization.
3.2.2. Bars—the Y-helicases
A large number of bars were found in all genomes, includ-ing the yeast genome. We found bars correspondinclud-ing to pro-tein domains of low complexity tandem repeat units. These repeat units are much simpler, compared to quilts or min-isatellites.
The yeast Y-element is a highly polymorphic repeti-tive sequence present in the subtelomeric regions of many yeast telomeres [19]. It has been reported that survivors aris-ing from yeast mutants deficient in telomerase compensate for telomere loss by the amplification of Y-elements. Many of the sequences were found to contain long open-reading frames that potentially encode helicase. Thus, the repetitive patterns in these genes might have a dual role to play. They could function similar to telomeric repeats in extending the life of a cell line. They could also function as important pro-tein domains that are responsible for the helicase function. The Y-elements contain some highly conserved domains of repeats. One which such domain identified as Pfam-B 59 in the PFAM database shows a unique bar (Figure 20) com-pared to the other Y-elements. The helicases that showed bars are
Chromosome 4: YRF1-1/YDR543W (Bar: 1530000–1530500 bp) Chromosome 5: YRF1-2/YER190W
(Bar: 574900–575400 bp) Chromosome 7: YRF1-3/YGR296W
(Bar: 1089000–1089400 bp) Chromosome 12: YRF1-4/YLR466W
(Bar: 1069500–1070000 bp) Chromosome 12: YRF1-5/YLR467W
(Bar: 1076250–1076750 bp) Chromosome 14: YRF1-6/YNL339C
(Bar: 1600–2000 bp) Chromosome 16: YRF1-7/YPL283C
(Bar: 1500–2000 bp).
Figure 21shows helicases YRF1-1, YRF1-2, YRF1-3, YRF1-4,
NC 001136 1502813 1505060 2 K 180 170 1 93 10
20 30 40 50 60 70 80 90
1.503 1.5034 1.5038 1.5042 1.5046 1.505 ×10⁶
Figure 22: Spectrogram showing shaft in FIT1 gene. The arrow highlights period 18, showing an intensity corresponding to a re-peat of 6 amino acids.
A number of yeast cell wall glycoproteins such as PIR1, PIR3, HSP150, and TIR1 are characterized by the presence of tandem repeats of a region of 18 to 19 residues. The core re-gion is highly conserved and has a consensus pattern of “SQ [IV] [STGNH] DSQ [LIV] Q [AIV] [STA].” The genomic DNA sequences of these proteins show prominent and char-acteristic bars whose frequency pattern represents the dom-inant periodicities. These bars are visually distinct in color and frequency pattern from the Y-elements.
Some bars show the structural significance of protein in the cell. In yeast, the protein HKR1 coded on chromosome 4 is a cell surface protein that may regulate cell wall beta-glucan synthesis. A region of the gene shows strong bars at a number of relevant frequencies reflecting corresponding periodicities in the protein as well as the DNA sequences. The domain in the protein sequence is made up of 12 re-peats of a 28 amino acid sequence, namely, “S [AV] [P] VAVSSTYTSSPSAPAAISSTYTSSP.” It was predicted to have a beta-helix supersecondary structure with a high score by the Betawrap algorithm. The gene YIL169C inS. cerevisiaeshows strong bars that correspond to a serine-rich domain in the protein. This domain extends through amino acids 92–154 and is identified as a potential T-SNARE coiled-coil domain.
3.2.3. Shafts and their structural significance
The shaft shown inFigure 22is part of the FIT1 gene. It cor-responds to a domain of repeats of 6 amino acids, namely, “SSAVET.” The shaft shows a bright band at frequency 11, marked by an arrow. The remaining bars are all harmon-ics of this fundamental periodicity. As the DFT window size was 180 for this spectrogram, a frequency of 11 corresponds to a periodicity of 18 in the DNA sequence and a period-icity of 6 in the protein sequence. This protein domain is predicted with high probability as a large alpha helix by GCG-Pepstruct. Spectrogram analysis of genes CYC8 and GAL11 also show shafts with a prominent periodicity of 6 nucleotides. This translates to a periodicity of 2 amino acids
I-shaft
(a)
NC 001144 1064747 1065495 748 120 119 1 61
(b)
Telomeric DNA
(c)
Telomeric DNA
(d)
Figure23: Four spectrograms showing very simple regions. (a) and (b) correspond to simple (1 and 3 bp) repeats in intergenic regions, while (c) and (d) show subtelomeric DNA found at the end of chro-mosomes.
in the protein. Rightly so, they represent QA repeats that form large alpha helices in both proteins.
Many shafts also represent low complexity, high flexibil-ity regions made of GOR turns in the respective proteins. Gene YLR114C has a DENN (differentially expressed in neo-plastic versus normal cells) domain. Part of this domain is a high flexibility region ofDrepeats. This region corresponds to a shaft.
Finally, found in the yeast genome were the simplest pat-terns possible. Some examples of very simple patpat-terns are shown in Figure 23. Very simple repeats of a single to a few nucleotides create simple spectrograms with bright and dark regions. The simplest pattern possible is a dark ver-tical bar corresponding to a constant nucleotide sequence (e.g., TTTTTTT. . .). These patterns may correspond to sub-telomeric DNA or to simple structures in protein-coding re-gions. Very simple patterns are useful because they serve as visual markers when navigating the genome.
3.2.4. An unannotated pattern
We observed a bar (with many strong periodicities) and a shaft in the region of 12500–13000 nucleotides ofS. cerevisiae
NC 001133 11496 13684 2 K 120 119 1 61
Figure24: Spectrogram showing an unannotated pattern believed to correspond to a gene or pseudogene. The left arrow marks the end of a predicted gene. The right arrow marks the beginning of another predicted gene.
4. DISCUSSION AND CONCLUSIONS
We employed the short time Fourier transform (STFT) to create color spectrograms of the genomes of various organ-isms after developing a software tool allowing for easy vi-sual navigation of the genomes via the spectrogram. Spectro-grams were created for many different organisms of varying complexity, and we believe that the method can effectively identify any unusual patterns in any genome. Various struc-tures and periodicities were found along all lengths of the chromosome, from a single gene to an entire chromosome. Important periodicities ranged from 0 to 300. We learned that there were no complex patterns in the phage genome and the number of complex patterns increased in frequency with the complexity of the organism. The higher organisms also showed more complex patterns per gene.
Periodicities from 0 to 300 were located and highlighted. We found periodicities relevant to the structure of DNA as well as periodicities involved in protein coding. Periodicities relevant to DNA structure included those concerning telom-ere structure, protein coding in DNA, DNA helical fold-ing, DNA nucleosome bindfold-ing, and DNA nucleosome su-perstructure. One of the characteristics of spectrogram color was that it correlated to Giemsa staining in human chro-mosomes, thus providing visual information regarding rela-tive nucleotide content, including GC content. Minisatellites were easily visualized as well as the complexity of their con-stituent repeat pattern.
Patterns of quilts, bars, and shafts were also found on the sequence scale of individual genes. Although bars and shafts were restricted to protein-coding regions in the yeast genome, the same was not true for the higher organisms. In
C. elegansand humans, some patterns extended into the
in-trons of genes and many were also present in intergenic re-gions. Patterns were useful in associating homology between various proteins. They were also found to have biological
sig-nificance, particularly in describing the structure of cell sur-face proteins. Many classes of cell sursur-face proteins are known and within these classes, there also exist many variants. Cell surface proteins are involved in pathology, pharmacology, and cell signaling. Spectrogram analysis seems particularly well suited for the analysis of this important class of proteins. A significant challenge in bioinformatics is finding sen-sible ways to manage the quantity and complexity of infor-mation in the genome. Spectrogram analysis of genomes ex-poses both sequence and frequency information on many scales of magnitude and therefore provides an almost unique visualization of DNA on any magnitude scale. We believe that, based on visual similarity of pattern type such as promi-nent periodicities and color, this method of frequency analy-sis is useful as a visualization tool. We found the tool to be particularly useful when used along with public databases and genome browsers. Spectrogram visualization gives a re-gion of DNA a unique visual signature that is useful in quickly recognizing an area of interest. Though spectrograms are much more dynamic, they provide a road map similar to cytological maps used with the fruit fly. Further, this unique visual signature can also be used as a heuristic method of classifying domains in DNA protein-coding regions. Finally, the spectrogram gives insight regarding the physical struc-ture of DNA in which a sequence of interest is embedded. Thus, DNA color spectrograms place sequences of interest in a much-needed larger context.
In summary, we used DNA color spectrograms to find biologically relevant patterns in the genomes of various or-ganisms, some of which relate to DNA structure or protein coding. Similar patterns in different parts of various genomes were found to have similar functions. Various patterns in-cluded strong genome-wide periodicities and structures such as microsatellites, minisatellites, quilts, bars, and shafts. We believe that spectrogram analysis will be a useful tool in un-derstanding the DNA structure, identifying protein domains, and predicting function and structure, as well as a discov-ery tool for novel DNA regions of potential biological signif-icance.
ACKNOWLEDGMENT
Appreciation is expressed to Rick Thompson who introduced the terms “quilts,” “shafts,” and “bars,” and to Chris Fidyk who wrote the original software, implementing spectrogram development.
REFERENCES
[1] D. Anastassiou, “Frequency-domain analysis of biomolecular sequences,” Bioinformatics, vol. 16, no. 12, pp. 1073–1081, 2000.
[2] D. Anastassiou, “Genomic signal processing,” IEEE Signal Processing Magazine, vol. 18, no. 4, pp. 8–20, 2001.
[3] J. C. Shepherd, “Periodic correlations in DNA sequences and evidence suggesting their evolutionary origin in a comma-less genetic code,”J. Mol. Evol., vol. 17, no. 2, pp. 94–102, 1981. [4] J. C. Shepherd, “Method to determine the reading frame of
its possible evolutionary justification,” Proc. Natl. Acad. Sci. USA, vol. 78, no. 3, pp. 1596–1600, 1981.
[5] J. C. Shepherd, “From primeval message to present-day gene,” Cold Spring Harb. Symp. Quant. Biol., vol. 47, Pt 2, pp. 1099– 1108, 1983.
[6] J. W. Fickett, “Recognition of protein coding regions in DNA sequences,”Nucl. Acids. Res., vol. 10, pp. 5303–5318, 1982. [7] D. Rhodes and A. Klug, “Helical periodicity of DNA
deter-mined by enzyme digestion,” Nature (London), vol. 286, pp. 573–578, August 1980.
[8] G. P. Lomonossoff, P. J. Butler, and A. Klug, “Sequence-dependent variation in the conformation of DNA,” J. Mol. Biol., vol. 149, pp. 745–760, July 1981.
[9] A. Klug, L. C. Lutter, and D. Rhodes, “Helical periodicity of DNA on and offthe nucleosome as probed by nucleases,”Cold Spring Harb. Symp. Quant. Biol., vol. 47, pp. 285–292, 1983. [10] L. J. Peck and J. C. Wang, “Sequence dependence of the helical
repeat of DNA in solution,”Nature, vol. 292, pp. 375–378, July 1981.
[11] B. Alberts, A. Johnson, J. Lewis, M. Raff, K. Roberts, and P. Walter, Molecular Biology of the Cell, Garland Publishing, New York, USA, 4th edition, Chapter 4, 2002.
[12] Y. Niimura and T. Gogobori, “In silicochromosome stain-ing: Reconstruction of Giemsa bands from the whole human genome sequence,” Proc. Natl. Acad. Sci. USA, vol. 99, no. 2, pp. 797–802, 2002.
[13] A. Bird, “CpG islands as gene markers in the vertebrate nu-cleus,”Trends in Genetics, vol. 3, pp. 342–347, 1987.
[14] S. Subramanian, V. M. Madgula, R. George, et al., “Triplet repeats in human genome: distribution and their association with genes and other genomic regions,” Bioinformatics, vol. 19, no. 5, pp. 549–552, 2003.
[15] S. Subramanian, R. K. Mishra, and L. Singh, “Genome-wide analysis of Bkm sequences (GATA repeats): predominant as-sociation with sex chromosomes and potential role in chro-matin organization and function,”Bioinformatics, vol. 19, no. 6, pp. 681–685, 2003.
[16] K. B. Murray, D. Gorse, and J. Thornton, “Wavelet transforms for the characterization and detection of repeating motifs,”J. Mol. Biol., vol. 316, no. 2, pp. 341–363, 2002.
[17] Y. Nakamura, M. Leppert, P. O’Connell, et al., “Variable num-ber of tandem repeat (VNTR) markers for human gene map-ping science,”Science, vol. 235, no. 4796, pp. 1616–1622, 1987. [18] M. Bony, D. Thines-Sempoux, P. Barre, and B. Blondin, “Lo-calization and cell surface anchoring of the Saccharomyces cerevisiae flocculation protein Flo1p,”Journal of Bacteriology, vol. 179, no. 15, pp. 4929–4936, 1997.
[19] M. Yamada, N. Hayatsu, A. Matsuura, and F. Ishikawa, “Y -Help1, a DNA helicase encoded by the yeast subtelomeric Y element, is induced in survivors defective for telomerase,” J. Biol. Chem., vol. 273, no. 50, pp. 33360–33366, 1998.
David Sussillo received his B.S. degree in computer science from Carnegie Mellon University in 1999 and his M.S. degree in electrical engineering from Columbia Uni-versity in 2003. He is currently pursuing his Ph.D. degree in the Doctoral Program for Neurobiology and Behavior at Columbia University. His current research interests in-clude signal processing of genomic signals, vision processing in the primary visual
cor-tex, and computer applications in biomedical research.
Anshul Kundaje received his B.S. degree from Veermata Jijabai Technological Insti-tute (VJTI), the University of Mumbai in 2001 and M.S. degree from Columbia Uni-versity in 2002, both in electrical engineer-ing. Presently, he is pursuing a Ph.D. degree in computer science at Columbia Univer-sity. His research focus is computational bi-ology, specifically applying machine learn-ing and signal processlearn-ing techniques to
solving hard biological problems. His prime interest is in reverse engineering of genetic and protein networks using multiple sources of biological data such as mRNA expression, time-series, sequence, and protein data.
Dimitris Anastassiouis a Professor and Di-rector of Columbia’s Genomic Information Systems Laboratory at Columbia University. He received the Ph.D. degree in electrical engineering from the University of Califor-nia, Berkeley, in 1979. From 1979 to 1983, he was a research staffmember at the IBM Thomas J. Watson Research Center, York-town Heights, NY. Since 1983, he has been with the Department of Electrical