©IJRASET: All Rights are Reserved
680
Structural Analysis of Weld Joints using FEA and
Response Surface Optimization
Kshitij Kumar Sahu1, Prof. Sankalp Verma2
1, 2
Department of Mechanical Engineering., S.S.G.I. Bhilai
Abstract: Analysis of welded structures is still remains a challenge for the designer to produce desired output results. The research analysis the effect of different design parameters on strength and fatigue life of weld joint. The CAD model of weld joint is developed using Creo 2.0 software and FEA analysis is conducted using ANSYS software. Response Surface Method is used to analyse the sensitivities and effect of different design parameters on strength and life of weld joint.
Keywords: Weld Joints, Finite Element Analysis, Fatigue life, FEA, ANSYS
I. INTRODUCTION
Welding is a process in which two or more parts are joined permanently at their touching surfaces by a suitable application of heat and/or pressure. Often a filler material is added to facilitate coalescence. The assembled parts that are joined by welding are called a weldment. Welding is primarily used in metal parts and their alloys. Welding processes are classified into two major groups:
1) Fusion Welding: In this process, base metal is melted by means of heat. Often, in fusion welding operations, a filler metal is added to the molten pool to facilitate the process and provide bulk and strength to the joint. Commonly used fusion welding processes are: arc welding, resistance welding, oxyfuel welding, electron beam welding and laser beam welding.
2) Solid-state Welding: In this process, joining of parts takes place by application of pressure alone or a combination of heat and pressure. No filler metal is used. Commonly used solid-state welding processes are: diffusion welding, friction welding, ultrasonic welding.
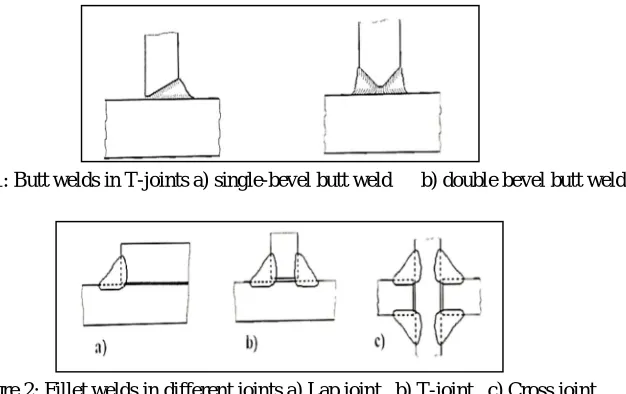
[image:1.612.166.479.455.652.2]There are several different types of welds, where fillet weld and butt weld are the most common. The butt weld is used for parts which are nearly parallel and do not overlap. It can be used for parts that are not in the same plane, but then chamfering is often performed in one of the sheets. The fillet weld is used to join two or more pieces which are perpendicular or at an angle, in Figure 1 some examples are represented.
Figure 1: Butt welds in T-joints a) single-bevel butt weld b) double bevel butt weld
Figure 2: Fillet welds in different joints a) Lap joint b) T-joint c) Cross joint
[image:1.612.191.424.565.641.2]©IJRASET: All Rights are Reserved
681
II. LITERATUREREVIEW
T. Ninh Nguyen and M. A. Wahab[1] suggested that the misalignments in weld joints are of two types: eccentricity and angular distortion. Due to this misalignment in weld joint the force transmitted by the misalignment weld joint in axial loading can be split into an axial and bending component .
Kyungwoo Lee[2] investigated that the large deflection of a cantilever beam made of Ludwick type material under a combined loading . The problem involves both material and geometrical non-linearity and a closed-form solution to such problem cannot be obtained. He stated that, numerical solution was obtained by using Butcher’s 1fifth order Runge-Kutta method. Equation can be used for not only the combined load consisting of a uniformly distributed load and one vertical concentrated load at the free end but also the general loading condition.
According to Robb C Wilcox[3] there are several different theoretical approaches available for the design of fillet weld. Conventional design treats all fillet welds as if load was oriented in the weakest direction (longitudinally). The result obtained by his method was an over sizing of fillet welds loaded transversely since transverse loaded welds are stronger than welds loaded longitudinally
Mahapatra et al. [4] investigated the use of constraint in one-side fillet welding to see its effect on angular distortion . Strategically placed tack welds were used to counter the effect of the welding process. Results of the experiment showed that applying constraints at the proper position could indeed counter the distortion from welding. However, no study of residual stress was included in this investigation.
Kumose et al. [5] looked into prediction of angular distortion in one-pass fillet welding. Pre-straining to eliminate distortion in welding was researched. Pre-straining involves either plastic or elastic straining in the direction opposite to distortion before welding is done. Kumose found that the magnitude of plastic pre-strain to avoid distortion was comparatively smaller than that of free angular distortion when the flange thickness is comparatively greater than the weld leg length. Free angular distortion in this research is referring to angular distortion that is free from external forces and only affected by the experimental parameters. When applying elastic pre-strain to a welded component, Kumose found that it was only necessary to consider applied skin stress and nothing else to find suitable values to avoid distortion, meaning that skin stress is directly related to amount of distortion.
III. OBJECTIVE
The objective of the research is to analyse effects of geometric parameters on weld stress generated using ANSYS software. The response surface method is used to analyze the effect of design parameter on stresses.
IV. RESEARCHMETHODOLOGY
The static structural analysis of weld joint is conducted using techniques of Finite Element Analysis. The Finite Element Method involves basically three stages.
A. Preprocessing stage involves CAD modeling, meshing into elements and nodes (discretization), assigning loads and boundary
conditions.
B. Solution stage involves matrix formulations, matrix inversions and multiplication, assemblage of element stiffness matrix, global stiffness matrix.
C. Postprocessing stage involves viewing results, contour plots, vector plots and optimization of input parameters
The CAD model is developed ANSYS design modeler. The CAD modelling involves 2 extrude features placed perpendicular to each other. The parameters are assigned in design modeler.
[image:2.612.196.419.628.723.2]
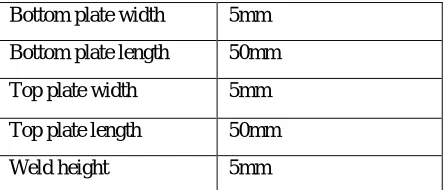
Table 1: Dimensions of Weld Joint
Bottom plate width 5mm
Bottom plate length 50mm
Top plate width 5mm
Top plate length 50mm
©IJRASET: All Rights are Reserved
682
Figure 3: Sketching in ANSYS
The perpendicular feature modelled is shown in figure 4 below.
Figure 4: Perpendicular feature modelling
Three different geometric parameters are defined i.e. bottom plate width, top plate width and weld size as shown in figure 5 below.
Figure 5: Weld analysis parameters
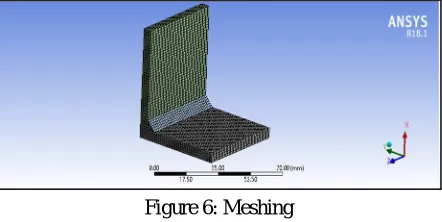
[image:3.612.197.418.440.551.2]The CAD model developed is meshed using brick elements. The size function is set to adaptive and sizing is set to fine and inflation set to normal, transition is set to normal. Number of nodes generated is 62860 and number of elements generated is 12675.
Figure 6: Meshing
[image:3.612.193.416.591.690.2]After meshing horizontal load of 5000N is applied on side surface of vertical feature and base surface bottom is applied with fixed support as shown in figure 7 below.
Figure 7: Loads and Boundary Condition
©IJRASET: All Rights are Reserved
683
V. RESULTSANDDISCUSSION
[image:4.612.200.416.119.256.2]After conducting structural analysis using ANSYS software equivalent stress and deformation plots generated are shown in figure 8 below. Total deformation plot shows maximum deformation value at .64 mm at top portion of vertical feature.
Figure 8: Total Deformation
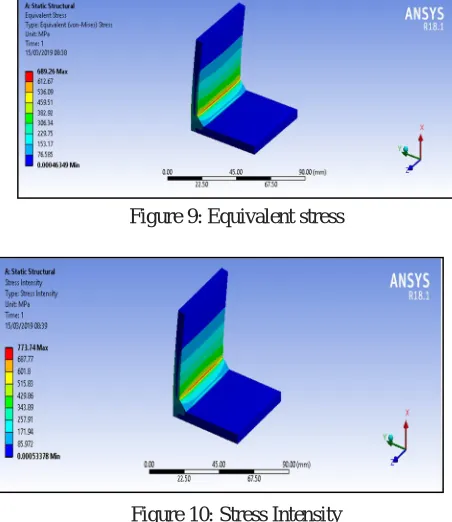
[image:4.612.188.414.299.560.2]The equivalent stress generated is shown in figure 9 below. The maximum value of stress is 689.26MPa at the intersection of vertical feature and horizontal feature. The stress value decreases as we move away from intersection
Figure 9: Equivalent stress
.
Figure 10: Stress Intensity
[image:4.612.196.418.604.713.2]The stress intensity is maximum value of 773.74MPa at the intersection of vertical and flat face. The fatigue life determined from ANSYS software is shown in figure 11 below. The fatigue life obtained is 626.15 cycles.
©IJRASET: All Rights are Reserved
684
The fatigue life is minimum at joints and reduces on moving away from joints. The minimum is of 626 cycles and portion susceptible to crack is along line of intersection as shown in figure 12 above. After conducting structural analysis, the optimization is performed using response surface method. The first step in optimization method is design of experiments done using ANSYS software. The 3 optimization parameters with different ranges are optimized and results are generated for fatigue life, equivalent stress and stress intensity. [image:5.612.183.433.515.672.2]Figure 12: Design points generated using DOE
Figure 12 above shows design points generated by parameters bottom plate width, top plate width and weld size. The fatigue life, equivalent stress and stress intensity are generated at these design points.
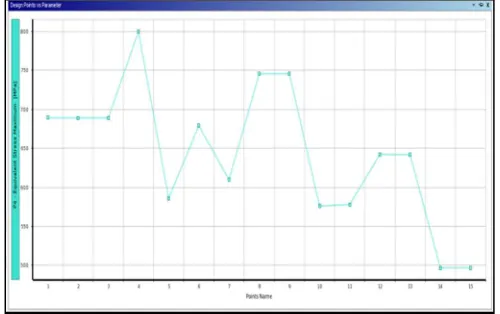
Figure 13: Fatigue life at different design points
From figure 13 above shows the minimum value of fatigue life at design point number 4 and maximum value of fatigue life at design point number 15.
Figure 14: Maximum equivalent stress at different design points
©IJRASET: All Rights are Reserved
685
Figure 15: Response surface for fatigue life (top plate width and weld size parameters)The 3D response surface generated for fatigue life as shown in figure 15 above shows maximum value of fatigue life at top plate width ranging from 5.4mm to 5.5mm and weld size also ranging from 5.4 to 5.5mm shown by dark red colour zone. The minimum fatigue life is obtained for weld size ranging from 4.7mm to 4.9mm and top plate width ranging from 4.5mm to 4.6mm.
Figure 16: Response surface for fatigue life (top plate width and bottom plate width as parameters)
The 3D response surface generated for fatigue life as shown in figure 16 above shows maximum value of fatigue life at top plate width ranging from 5.4mm to 5.5mm and bottom plate ranging from 4.5mm to 4.7mm and also at 5.4mm to 5.5mm shown by dark red colour zones. The minimum fatigue life is obtained for top plate width ranging from 4.5mm to 4.6mm and bottom plate width ranging from 4.5mm to 5.5mm.
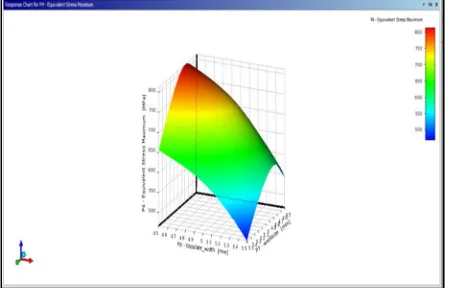
Figure 17: Response surface for equivalent stress (top plate and weld size parameters)
©IJRASET: All Rights are Reserved
686
[image:7.612.180.401.79.196.2]
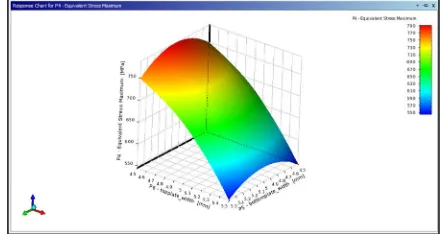
Figure 18: Response surface for equivalent stress (top plate and bottom plate parameters)
[image:7.612.186.404.453.601.2]The 3D response surface generated for equivalent stress as shown in figure 18 above shows maximum value of equivalent stress at bottom plate width ranging from 4.6mm to 5.3mm and top plate width ranging from 4.5mm to 4.7mm. The minimum equivalent stress is obtained for top plate width ranging from 5.3mm to 5.5mm and bottom plate ranging from 4.5 mm to 5.4mm.
Figure 19: Response surface for stress intensity
The 3D response surface generated for stress intensity as shown in figure 19 above shows maximum value of stress intensity at top plate width ranging from 4.5 mm to 4.6mm and weld size ranging from 4.8 mm to 5.1 mm. The minimum stress intensity is obtained for top plate width ranging from 5.4mm to 5.5mm and weld size ranging from 5.3 mm to 5.4mm.
Figure 20: Sensitivity plot of different parameters
The sensitivity plot of different parameters on fatigue life, equivalent stress and stress intensity is shown in figure 20 above. The sensitivity plot shows positive and negative sensitivities. The positive sensitivity signifies increase in parameter will increase the output while negative sensitivity signifies increase in parameter will decrease output. The details are given below:
A. Fatigue Life
1) For fatigue life bottom plate width shows negative sensitivity with local sensitivity percentage of 4.76%.
2) For fatigue life top plate width shows positive sensitivity with local sensitivity percentage of 32.93%.
©IJRASET: All Rights are Reserved
687
B. Equivalent Stress
1) For equivalent stress bottom plate width shows positive sensitivity with local sensitivity percentage of 10.49%.
2) For equivalent stress top plate width shows negative sensitivity with local sensitivity percentage of 56.17%.
3) For equivalent stress weld size shows negative sensitivity with local sensitivity percentage of 38.29%.
C. Stress Intensity
1) For Stress Intensity bottom plate width shows negative sensitivity with local sensitivity percentage of .103%.
2) For Stress Intensity top plate width shows negative sensitivity with local sensitivity percentage of 63.148%.
3) For Stress Intensity weld size shows negative sensitivity with local sensitivity percentage of 39.65%.
Figure 21: Maximum and minimum values of different parameters
From response surface optimization the maximum and minimum values of different parameters are obtained. The maximum fatigue life is 2008.7 cycles and minimum fatigue life obtained is 418.2 cycles. The maximum equivalent stress obtained is 434.73 cycles and minimum equivalent stress obtained is 811.94 cycles. The stress intensity maximum obtained is 519.24 MPa and minimum stress intensity is 8984.49 MPa.
Figure 22: Maximum and minimum values of different parameters
The goodness of fit curve is generated as shown in figure 22 above. Goodness of fit curve shows deviation of observed values from expected values. In this case except for certain design points equivalent stress and fatigue life doesn’t show much deviation from expected values as shown by red colour box for equivalent stress and blue colour boxes for total deformation.
VI. CONCLUSION
FEA analysis of weld joints are conducted to determine the weld stresses and fatigue life of welded joint using ANSYS software. Using techniques of Response Surface method sensitivities of different parameters of interest (weld thickness, Top Plate width and bottom plate width) on output parameters (equivalent stress, fatigue life and stress intensity) are determined.
The detailed conclusion are as follows:
A. Using FEA analysis it is found that maximum stress is obtained at joint of horizontal and vertical members.
B. The crack initiation and fatigue life of weld joint is determined from line of intersection of weld and surface on which load is applied.
C. Response surface method is effective method to determine sensitivities and other responses of different parameters.
D. For fatigue life bottom plate width shows negative sensitivity with local sensitivity percentage of 4.76%.
E. For fatigue life top plate width shows positive sensitivity with local sensitivity percentage of 32.93%.
F. For fatigue life weld size shows positive sensitivity with local sensitivity percentage of 22.654%.
©IJRASET: All Rights are Reserved
688
H. For equivalent stress top plate width shows negative sensitivity with local sensitivity percentage of 56.17%.
I. For equivalent stress weld size shows negative sensitivity with local sensitivity percentage of 38.29%.
J. For Stress Intensity bottom plate width shows negative sensitivity with local sensitivity percentage of .103%.
K. For Stress Intensity top plate width shows negative sensitivity with local sensitivity percentage of 63.148%.
L. For Stress Intensity weld size shows negative sensitivity with local sensitivity percentage of 39.65%.
REFERENCES
[1] T. Ninh Nguyen and M. A. Wahab, “The effect of weld geometry and residual stresses on the fatigue of welded joint under combine
[2] Kyungwoo Lee, “ Large deflections of cantilever beams of nonlinear elastic material under a combined loading,” International Journal of Non-Linear Mechanics 37 (2002) 439–443.
[3] Robb C. Wilcox, “The effect of weld penetration on tensile strength of fillet welded joints”,B.S., Naval Architecture and Marine engineering, U.S. coast guard acadamy, 1991
[4] Mahapatra, M., G. L. Datta, B. Pradhan, and N. R. Mandal. “Modelling the effects of constraints and single axis welding process parameters on angular distortions in one-side fillet welds.” Proc. IMechE 221 Part B: 397-407.