Abstract—This research implements the well-known six
sigma approach define-measure-analyze-improve-control (DMAIC) to improve the performance of direct compression process with two quality responses; tablet’s weight and hardness. At current factor settings, the x and s charts are judged in-control for both responses. However, the process was found capable for hardness but incapable for weight. Three process factors are investigated, including machine speed (S), compression force (F), and filling depth (D). The Taguchi’s L27 array is adopted to investigate the effects of the three process factors concurrently. Then, the grey relational analysis based ranking is implemented to determine the combination of optimal factor levels, which is found as S1F3D1. Initially, the process capability values for hardness and weight are 1.5 and are 0.587, respectively. The multivariate capability index, MCpk, is calculated and found
0.938. After process improvement, the process capability values are found equals to 3.31 and 0.848. The MCpk is
enhanced to 1.68. In conclusion, the DMAIC approach is found effective for improving the performance of direct compression process with tablet’s weight and hardness.
Index Terms—Direct compression, Grey analysis, Process
capability, Taguchi method
I. INTRODUCTION
T
he pharmaceutical industry has invested large amount of resources in improving the performance of direct compression process [1]. Tablet defects result in huge business losses due to their influence on human health. Among the key quality responses are tablet hardness and weight. Variation in these two responses leads to rejection of tremendous tablet quantities.Among the proven approaches for improving quality and productivity is the define-measure-analyze-improve control (DMAIC) approach, which has been implemented widely to improve performance in many industrial applications [2,3].
Manuscript received Nov., 2012; revised Jan., 2013. This work was supported by the University of Jordan, Amman.
A. Al-Refaie is with the Department of Industrial Engineering, University of Jordan, Amman, 11942, Jordan (e-mail: [email protected]).
M. H. Li is with the Department of Industrial Engineering and Systems Management, Feng Chia University, Taichung, Taiwan (e-mail: [email protected]).
Issam Jalham is with the Department of Industrial Engineering, University of Jordan, Amman, Jordan. E-mail: [email protected]
N. Bata is with the Department of Industrial Engineering, University of Jordan, Amman, 11942, Jordan.
K. Al-Hmaideen is with the Department of Industrial Engineering, University of Jordan, Amman, 11942, Jordan.
The Taguchi method is widely applied because of its proven success in improving the quality of manufactured products in many business applications. Nevertheless, it has been only found efficient for optimizing a single quality response Nevertheless, it has been only found efficient for optimizing a single quality response [4-6]. In contrast, the grey relational analysis based on the grey system theory [7] can be utilized for solving complicated interrelationships among multiple quality responses [8, 9]. Therefore, this research utilizes DMAIC methodology to enhance the performance of the tablets’ direct compression process utilizing grey relation analysis. This paper is organized as follows. Section two presents the DMAIC approach. Section three summarizes research results. Finally, section four summarizes conclusions.
II. IMPLEMENTING DMAICAPPROACH
The DMAIC approach is implemented as presented in the following subsections.
A. Define the importance quality responses
The direct compression of tablets is illustrated in Fig.1.
Fig.1. Process mapping.
The Tablet quality depends on two main quality responses including hardness and weight. The hardness lower and upper specifications limits of the AM-tablets are 20 and 60 measured by Newton (N), respectively. It is required that tablet hardness to be the larger the better within these specifications. The second important quality response is the tablet weight. The upper and lower specification limits of the tablet average weight are 75.0 ± 4.5 mg. The tablet hardness and weight are considered the larger-the-better (LTB) and nominal-the-best (NTB) quality types, respectively.
B. Measuring the performance of tablet’s production line
A control chart is one of the primary techniques of statistical process control. The chart has a centre line (CL) and the upper and lower control limits represented by UCL and LCL, respectively. The CL represents where this process characteristic should fall. A widely implemented control charts for monitoring response mean and variability are the xand s charts. Twenty five samples, each sample
Improving Performance of Tableting Process
Using DMAIC and Grey Relation Analysis
with sample size of ten tablets, are taken after the process is stable. The x and s control charts for hardness are constructed then depicted in Fig. 2. The LCL, CL, and UCL for xchart are calculated 31.434, 34.497, and 37.560, respectively. While, the LCL, CL, and UCL for the s chart are estimated 0.891, 3.140, and 5.390, respectively. Similarly, the x and s control charts for the unit average weight are established as shown in Fig. 3. The LCL, CL, and UCL for x chart are found equal to 74.841, 76.476, and 78.111, respectively. While, the LCL, CL, and UCL for the s chart are of values 0.476, 1.676, and 2.877, respectively. Observing Figs. 2 and 3, nor points fall outside the control limits neither significant pattern is found. Consequently, the process is concluded operating in a statistical control state for the two measured values. A vital part of an overall quality-improvement program is process capability analysis by which the capability of a manufacturing process can be measured and assessed. In practice, the process standard deviation,
, is unknown and frequently estimated by:
4
s c
(1)
where c4 is a constant related to sample size, while
s
is the CL value in s chart. The estimator of Cpk, ˆCpk, isexpressed mathematically by: ˆ ˆ
ˆ ,
3 3
pk
USL LS
C min L
(2)
For larger-the-better response, the ˆC pk is calculated as: ˆ
ˆ 3
pk
SL
C L
(3)
where
ˆ is the estimated mean, which is the equals tox
; the CL value ofx
chart. In this research, the recommended minimum value of the process capability ratio is 1.45, due to safety, strength, or critical parameter for an existing process [10]. In this research, the minimal required process capability values for hardness and weight are 1.45 and 1.00, respectively. From Fig. 2, thes
value for average hardness is calculated 3.140 and the c value for a sample size of 10 is 0.9727. Substitutings
andc
4values in Eq. (1), the ˆis equal to 3.2281. Introducingx
of 34.497 in Eq. (3), the Cˆpkis calculated and found equals 1.5. Compared with the recommended minimum value (= 1.45), it is concluded that process is almost capable for average tablet’s hardness. Similarly, the process capability is estimated for average unit weight. From Fig.3, thes
value is calculated 1.676. Then, ˆ is calculated and found equals 1.723. Using Eq. (2), the Cˆpkis 0.587, which is much less than the minimum value (=1.00) and hence indicates that the process is incapable.A criterion for selecting an optimal design is developed and called MCpk to be used as a capability measure for a process having multiple performance measures [11]. In this research, the MCpk is calculated as:
Sample
Sa
m
pl
e
M
ea
n
25 23 21 19 17 15 13 11 9 7 5 3 1 38
36
34
32
_ _ X=34.497 U C L=37.560
LC L=31.434
Sample
Sa
m
pl
e
S
tD
e
v
25 23 21 19 17 15 13 11 9 7 5 3 1 5
4
3
2
1
_ S =3.140 U C L=5.390
LC L=0.891
Fig. 2. The x- s control charts for hardness.
Sample
Sa
m
pl
e
M
e
a
n
25 23 21 19 17 15 13 11 9 7 5 3 1 78
77
76
75
_ _ X=76.476 U C L=78.111
LC L=74.841
Sample
Sa
m
pl
e
St
D
e
v
25 23 21 19 17 15 13 11 9 7 5 3 1 3
2
1
_ S =1.676 U C L=2.877
LC L=0.476
[image:2.612.96.482.331.722.2]
1
2 2
1 pk i
MCpk
C (4)Utilizing the obtained process capabilities for averages of hardness and weight (
1
ˆ pk
C =1.4969;
2 ˆ
pk
C = 0.587), the MCpk is calculated and found 0.938. Typically, the MCpk value larger than one indicates capable process with multiple responses. Accordingly, the tablet compression process is concluded incapable.
C. Analyzing and improving the performance of tablet’s production process
C.1. Analyzing process performance
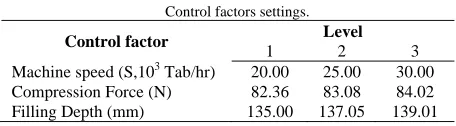
[image:3.612.71.299.378.441.2]Based on previous studies [12-14] and process knowledge, the most important controllable factors are: compression force (N), filling depth (mm), and machine speed (stroke/hr). Process experts recommend that each factor is assigned three-physical value levels as shown in Table I. In this method, an orthogonal array (OA) is utilized to investigate several process factors concurrently at permissible reliability and at low cost. For compression process under study, the appropriate Taguchi’s OA for investigating three factors with their corresponding two-way interactions is the L27 array.
Table I Control factors settings.
Control factor Level
1 2 3 Machine speed (S,103 Tab/hr) 20.00 25.00 30.00
Compression Force (N) 82.36 83.08 84.02 Filling Depth (mm) 135.00 137.05 139.01
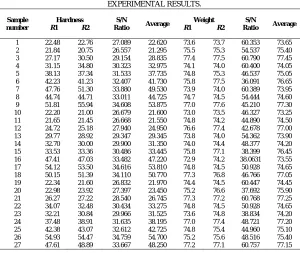
The designed experiments were carried out on a high capacity rotary press machine of the type Manesty with the known properties of the tablet’s formulation powder mixture. Two repetitions were performed for each experiment. Each repetition consists of 10 tablets. The hardness and weight tests were carried out using Unit Tester PTB 311 Pharma Test instrument and Mettler Toledo balance Model PR 503DR, respectively. The experimental results of the tablet hardness and weight of the two replicates, R1andR2, respectively, are displayed in Table II.
C.2. Improving process performance
The grey relational analysis is adopted for improving the performance of tablet’s direct compression process with two quality response; the averages of tablet hardness and weight, as described in the following steps:
Step 1: The Taguchi method employs a signal-to-noise ratio (SNR) to measure the present variation. The definition of SNR differs according to the quality response type. Typically, larger SNR indicates better performance. The SNR for the averages of hardness and weight,
1i and2
i , respectively, are estimated as follows2 1
1
1 1
10 log( ) , =1,2,..., 27
k
r ir
i i
k y
(5)2
2 1 0 lo g 2 , = 1 ,2 ,..., 2 7 i
i i
y
i s
(6) where k represents the number of replicates. To avoid the effect of adopting different units of the two quality responses, the 1i and
2iare normalized. Let 1*iand* 2i
denote the normalized 1i and 2i , respectively. Calculated respectively as:
1 1
1
1 1
*
, 1, 2, ... , 27
i i
i
i i
min
i max min
(7)
2 2
2
2 2
* min
, 1, 2, ... , 27
max min
i i
i
i i
i
(8)
where min{1i} and max {1i } are the smallest and the largest value of 1i , respectively. Similarly, the min {2i} and max {2i} are the smallest and the largest value 2i and 2i , respectively, from all 27 experiments for each response.
Step 2: Calculate the grey relational coefficient, *
1i
(
o1,
1i)
and
2i(
o2,
*2i)
, respectively as follows:* min max
1 1 1
1 max
( , ) , = 1,2,... , 27 ( )
i o i
o
i i
(9)
Similarly:
* min max
2 2 2
2 max
( , ) , = 1,2,... , 27 ( )
i o i
o
i i
(10) where ξ is the distinguishing coefficient, which defined in
the range of zero and one and it is commonly set 0.5. The 1( )
o i
and o2( )i are the absolute deviations of the
1*i and
2*i from the reference sequences
01and
02 of the averages of tablet hardness and weight, calculated respectively using:*
1( ) 1 1 , =1,2, ..., 27
o i
o
i i (11) and
*
2( ) 2 2 , =1,2, ..., 27
o i
o
i i (12) The min and max represent the smallest oj( )i and the largest oj( )i for all the 27 experiments from both quality responses, respectively.
Step 3: Generate the average grey relational grade, i,
using 2
1
1
, = 1 ,2 ,... , 2 7 2 j ji
i i
(13)decide the optimal level for each factor f as the level that maximizes lf for this factor. In some cases, the optimal
factor levels are close to each that makes level selection not be easily determined based on lf . In this case, the ordinal value is to rank the i values in an ascending order, where the lowest ireceives a rank of one. Identify the combination of optimal factor levels utilizing the ordinal values. Let SOVfl be the sum of the ordinal values for level l of factor f. The higher the SOVfl implies better process performance.
Then the optimal factor level, l*, of factor f is the level that maximizes the value of SOVfl , that is,
l*
lmaxl
SOVfl
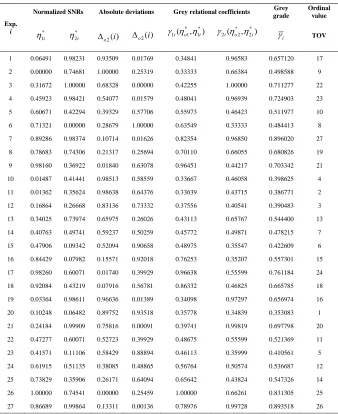
, f (14) Applying the above procedure, the results of grey relationalcoefficients and grades are displayed in Table III. The
lf
values are calculated then summarized in Table IV. Observing the lf values of the filling depth factor, it is
noted that the 1Dand 3Dvalues are almost equal. Hence,
the SOVfl values are calculated then also shown in Table
III. The SOVfl values are finally adopted to identify optimal
factor levels. In Table IV, it is found that the combination of the optimal factor levels is S1P3D1. Given the c4value for a sample size of 10 is 0.9727. The
ˆ
values for hardness and weight are calculated 2.901 and 1.392, respectively. The corresponding ˆCpkvalues are found equals to 3.31 and 0.848. The corresponding MCpk equals 1.68, which indicates great savings in manufacturing and quality costs.D. Control process performance
Confirmation experiments are conducted at S1P3D1 to check the achieved improvement. Figs. 4 and 5 depict the confirmation x -s charts for the average hardness and weight, respectively. The two control charts are in statistical control and thus can be used for monitoring and controlling the future production batches. Fig. 4 also depicts the x and s control charts for average hardness from confirmation experiments. It is noted that the UCL, CL, and LCL for xchart are calculated 51.574, 48.821, and 46.068, respectively. While, the UCL, CL, and LCL for the s chart are estimated 4.844, 2.822, and 0.801, respectively. On the other hand, the x and s control charts for the weight are established as shown in Fig. 5. The UCL, CL, and LCL for x chart are found equal to 75.361, 74.04, and 72.719, respectively. While, the UCL, CL, and LCL for the s chart are of values 2.324, 1.354, and 0.384, respectively.
III.CONCLUSIONS
This research aims at improving the performance of tableting process with these two quality responses using
six-sigma and grey relational analysis. Initially, the
x
and s charts are found in-control for both responses. But, the process was found capable for hardness but incapable for weight. To improve the performance of this process, this research aims at improving the performance of direct compression process by adopting DMAIC methodology. The main factors studied are machine speed (S), compression force (F), and filling depth (D) using the27
L
array. Then, the grey relational analysis based ranking is employed to identify the combination of optimal factor levels, which is found as S1F3D1. Initially, the Cˆpkvalue forhardness is improved from 1.5 to 3.31. While, the
ˆ pk
C value for weight is enhance from 0.587 to 0.848. Further, the MCpk index is improved from 0.938 to 1.68. In conclusion, DMAIC approach including grey relational analysis is found effective for improving the performance of direct compression with tablet’s weight and hardness.
REFERENCES
[1] Banker S., and Rhodes T., “Modern Pharmaceutics”, (4th ed.) New York: Marcel Dekker, Inc., 2002.
[2] Li M.H., Al-Refaie A., and Cheng.Y., “DMAIC approach to improve the capability of SMT solders printing process”, IEEE Transactions on electronics packaging Manufacturing, Vol. 31, No. 3, pp: 126-133, 2008.
[3] Li M.H. and Al-Refaie A. ,” Improving wooden parts quality by adopting DMAIC procedure”, Quality and Reliability Engineering International, Vol. 24, pp: 351-360, 2008.
[4] Al-Refaie, A., “Optimizing SMT performance using comparisons of Efficiency between different systems technique in DEA”, IEEE Transactions on Electronics Packaging Manufacturing, Vol. 32, No. 4, pp: 256-264, 2009.
[5] Al-Refaie, A., Wu, T.H., and Li, M.H.C., ” DEA approaches for solving the multi-response problem in Taguchi method”, Artificial Intelligence for Engineering Design, Analysis and Manufacturing, Vol. 23, pp: 159-173, 2009.
[6] Al-Refaie A. and Li M.H., “Optimizing the performance of plastic injection molding using weighted additive model in goal programming”, International Journal of Fuzzy System Applications, Vol. 1, No. 2), pp: 42-53, 2011.
[7] Deng L., “Introduction to grey system theory. Journal of Grey Systems”, Vol. 1, No. 1, pp: 1, 1989.
[8] Al-Refaie, A. , “Optimizing correlated QCHs using principal components analysis and DEA techniques”, Production Planning and Control, pp: 1-14, 2010.
[9] Al-Refaie A., Li M.H., and T. K-C., “ Optimizing SUS 304 wire drawing process by grey relational analysis utilizing Taguchi method”, Journal of University of Science and Technology Beijing, Vol. 15, pp: 714-722, 2008.
[10] Montgomery C., “Introduction to Statistical Quality Control”, (6th ed.), USA: John Wiley, 2005.
[11] Plante D., “Process capability: a criterion for optimizing multiple response product and process design,” IIE Transactions, 33, 497-509, 2001.
[12] Sinka C., Motazedian F., and Cocks F., Pitt G., “The effect of processing parameters on pharmaceutical tablet properties”, Powder Technology, 189, pp: 276–284, 2009.
[13] Mendez R., Muzzio F., and Velazquez C., “ Study of the effects of feed frames on powder blend properties during the filling of tablet press dies”, Powder Technology, Vol. 200, pp:105–116, 2010.
Sample
Sa
m
pl
e
M
ean
19 17 15 13 11 9 7 5 3 1 52
50
48
46
_ _ X=48.821 U C L=51.574
LC L=46.068
Sample
Sa
m
pl
e
St
D
ev
19 17 15 13 11 9 7 5 3 1 5
4
3
2
1
_ S =2.822 U C L=4.844
LC L=0.801
Fig. 4. The
x
-s charts for hardness improvement.
Sa mple
Sa
m
pl
e
M
ea
n
19 17 15 13 11 9 7 5 3 1 75
74
73
_ _ X=74.04 U C L=75.361
LC L=72.719
Sa mple
Sa
m
pl
e
St
D
ev
19 17 15 13 11 9 7 5 3 1 2.5
2.0
1.5
1.0
0.5
_ S =1.354 U C L=2.324
LC L=0.384
[image:5.612.148.497.45.370.2] [image:5.612.146.495.49.194.2]Fig. 5. The
x
-s chart for weight improvement.Table II
EXPERIMENTAL RESULTS.
Sample number
Hardness
R1 R2
S/N
Ratio Average
Weight
R1 R2
S/N Ratio Average
[image:5.612.160.460.402.655.2]TABLE III
RESULTS OF GREY ANALYSIS
Exp.
i
Normalized SNRs Absolute deviations Grey relational coefficients Grey grade
Ordinal value
* 1i
*
2i
o2( )i o2( )i
* *
1i( o1, 1i)
* *
2i( o2, 2i)
i
TOV
[image:6.612.142.480.72.486.2]1 0.06491 0.98231 0.93509 0.01769 0.34841 0.96583 0.657120 17 2 0.00000 0.74681 1.00000 0.25319 0.33333 0.66384 0.498588 9 3 0.31672 1.00000 0.68328 0.00000 0.42255 1.00000 0.711277 22 4 0.45923 0.98421 0.54077 0.01579 0.48041 0.96939 0.724903 23 5 0.60671 0.42294 0.39329 0.57706 0.55973 0.46423 0.511977 10 6 0.71321 0.00000 0.28679 1.00000 0.63549 0.33333 0.484413 8 7 0.89286 0.98374 0.10714 0.01626 0.82354 0.96850 0.896020 27 8 0.78683 0.74306 0.21317 0.25694 0.70110 0.66055 0.680826 19 9 0.98160 0.36922 0.01840 0.63078 0.96451 0.44217 0.703342 21 10 0.01487 0.41441 0.98513 0.58559 0.33667 0.46058 0.398625 4 11 0.01362 0.35624 0.98638 0.64376 0.33639 0.43715 0.386771 2 12 0.16864 0.26668 0.83136 0.73332 0.37556 0.40541 0.390483 3 13 0.34025 0.73974 0.65975 0.26026 0.43113 0.65767 0.544400 13 14 0.40763 0.49741 0.59237 0.50259 0.45772 0.49871 0.478215 7 15 0.47906 0.09342 0.52094 0.90658 0.48975 0.35547 0.422609 6 16 0.84429 0.07982 0.15571 0.92018 0.76253 0.35207 0.557301 15 17 0.98260 0.60071 0.01740 0.39929 0.96638 0.55599 0.761184 24 18 0.92084 0.43219 0.07916 0.56781 0.86332 0.46825 0.665785 18 19 0.03364 0.98611 0.96636 0.01389 0.34098 0.97297 0.656974 16 20 0.10248 0.06482 0.89752 0.93518 0.35778 0.34839 0.353083 1 21 0.24184 0.99909 0.75816 0.00091 0.39741 0.99819 0.697798 20 22 0.47277 0.60071 0.52723 0.39929 0.48675 0.55599 0.521369 11 23 0.41571 0.11106 0.58429 0.88894 0.46113 0.35999 0.410561 5 24 0.61915 0.51135 0.38085 0.48865 0.56764 0.50574 0.536687 12 25 0.73829 0.35906 0.26171 0.64094 0.65642 0.43824 0.547326 14 26 1.00000 0.74541 0.00000 0.25459 1.00000 0.66261 0.831305 25 27 0.86689 0.99864 0.13311 0.00136 0.78976 0.99728 0.893518 26
TABLE IV OPTIMAL FACTOR LEVELS.
Control factor Level
*
1 2 3 Machine speed (S,103
Tab/hr) 0.6520 (156) 0.5117 (92) 0.6054 (130) Compression Force (N) 0.5278 (94) 0.5150 (95) 0.7262 (189) Filling Depth (mm) 0.6116 (140) 0.5458 (102) 0.6117 (136)
*