www.wjpr.net Vol 4, Issue 11, 2015.
803
STABILITY INDICATING RP-HPLC METHOD DEVELOPMENT AND
VALIDATION FOR ESTIMATION OF NICERGOLINE IN BULK AND
TABLET DOSAGE FORM.
*1B. Varsha, 1G. Naga Sowjanya, 1A. Ajitha, 1V. Uma Maheswara Rao,
2
Ramya Sri. Sura 1
Department of Pharmaceutical Analysis and Quality Assurance, CMR College of Pharmacy,
Kandlakoya (v), Medchal Road, Hyderabad – 501401, Telangana, India.
2
Sura Labs Pvt. Dilshuknagar, Hyderabad. Telangana India.
ABSTRACT
A Rapid and Precise Reverse Phase High Performance Liquid
Chromatographic method has been developed for the estimation of
Nicergoline, in its pure form as well as in its tablet dosage form.
Chromatography was carried out on a Phenomenex Gemini C18 (4.6 x
150mm, 5µm) column using a mixture of Methanol and Phosphate
buffer (pH 6, adjusted with potassium dihydrogen phosphate) in the
ratio of 70:30 v/v as the mobile phase at a flow rate of 1.0ml/min, the
detection was carried out at 289 nm. The retention time of the
Nicergoline was 2.212 min respectively. The method produced linear
responses in the concentration range of 10-50µg/ml of Nicergoline.
The method precision for the determination of assay was below 2.0%
RSD. The method is useful in the quality control of bulk and
pharmaceutical formulations. Stability indicating studies were also
carried out as per standard procedures.
KEYWORDS: Nicergoline, RP-HPLC, stability indicating studies, validation, Tablet dosage form.
INTRODUCTION
Nicergoline is chemically [(8β) – 10 – methoxy - 1,6 – dimethylergolin – 8 - yl]methyl
5-bromopyridine-3-carboxylate and it belongs to the dihydropyridine is an ergot derivative
used to treat senile dementia and other disorders with vascular origins. It has been found to
Volume 4, Issue 11, 803-813. Research Article ISSN 2277– 7105
Article Received on 12 Sep 2015,
Revised on 03 Oct 2015, Accepted on 26 Oct 2015
*Correspondence for Author B. Varsha Department of Pharmaceutical Analysis and Quality
www.wjpr.net Vol 4, Issue 11, 2015.
804
increase mental agility and enhance clarity and perception. It decreases vascular resistance
and increases arterial blood flow in the brain, improving the utilization of oxygen and glucose
by brain cells. It has similar vasoactive properties in other areas of the body, particularly the
lungs.
It is used for vascular disorders such as cerebral thrombosis and atherosclerosis, arterial
blockages in the limbs, Raynaud's disease, vascular migraines, and retinopathy. The
chemical formula for Nicergoline is C24H26BrN3O3. It is sparingly soluble in water. The
chemical structure for Nicergoline is following on figure-1, and literature survey revealed
that numerous methods have been reported for estimation of Nicergoline in pharmaceutical
formulations has been reported. The main objective of the work was to develop simple, fast,
inexpensive, sensitive and accurate methods which could be applied to analyse Nicergoline in
pure form and in pharmaceutical dosage form.
Fig.01: Chemical Structure of Nicergoline
MATERIALS AND METHODS Pharmaceutical formulation
Tablets contained cholergol labeled 30mg of Nicergoline per tablet.
Reagents and Materials
Methanol HPLC grade, HPLC grade water was obtained by double distillation and
purification through mille-Q water purification system.
Preparation of Standard solution
Standard stock solution of Nicergoline was prepared using methanol to get 1 mg/ml, further
dilution was made by diluting 1 ml to 10 ml with mobile phase to obtain 100 g/ml. For the
construction of calibration graph, the aliquots of stock solution of Nicergoline (1-5 ml of 100
g/ml) was diluted with mobile phase to get 10-50g/ml. The solutions were injected and
www.wjpr.net Vol 4, Issue 11, 2015.
805 Preparation of Sample solution
For analysis of tablet formulation, the tablet powder equivalent to 100 mg of Nicergoline was
taken in a clean dry volumetric flask and made up to 100 ml with methanol the solution was
sonicated for 10 min and filtered through Whatmann filter paper No.41. From clear solution,
further dilutions were made by diluting 10 ml to 100 ml with mobile phase to obtain 100
g/ml. 3.0 ml of test solution (30 g/ml) was taken in six 10 ml volumetric flasks and made
up to mark with mobile phase. The test solutions (10 g/ml) were injected and
chromatograms were recorded. For recovery studies, to the preanalysed formulation,
solutions of raw material containing different concentrations were added and the amount of
drug recovered was calculated. To each 3.0 ml of preanalysed formulation solution (30
g/ml) added 1, 2, 3ml of raw material stock solution 100 g/ml into 10 ml volumetric flasks
and made up with mobile phase. The procedure was repeated as per the analysis of
formulation. The amount of drug recovered was calculated by using slope and intercept
values from the calibration graph. Finally the method was validated as per ICH guide lines
for precision, accuracy, specificity, linearity, reproducibility, LOD and LOQ.
Chromatographic Conditions
Prepare a mixture of 700ml(70%) of HPLC methanol and 300ml of Phosphate buffer(30%)
sonicated to degasse and the solvents were pumped from the solvent reservoir in the ratio of
Methanol, Phosphate Buffer pH6 (70:30 v/v) into the column. The flow rate of mobile phase
was maintained at 1.0ml/min and detection wavelength was set at 289 nm with a run time of 20min. The volume of injection loop was 25μl prior to injection of the drug solution. The
column was equilibrated for at least 25min with the mobile phase flowing through the
system. The column and the HPLC system were kept in ambient temperature.
Table. 1: Optimized method parameters
Parameters Conditions
Mobile Phase Methanol: Phosphate Buffer pH6 (70:30 v/v) Column ( Stationary Phase ) Phenomenex Gemini C18 (4.6×250mm, 5µ) Flow rate ( ml/min) 1
www.wjpr.net Vol 4, Issue 11, 2015.
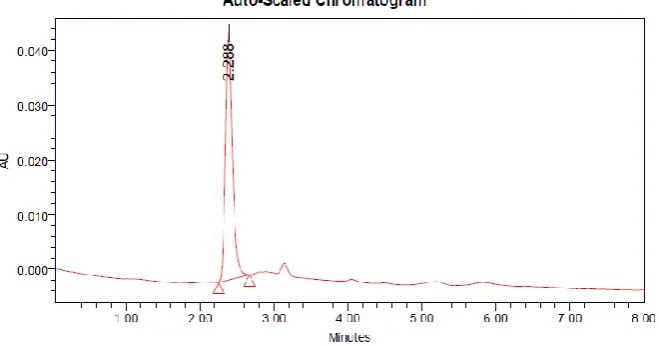
806 Figure.2: Optimized Chromatogram (Standard)
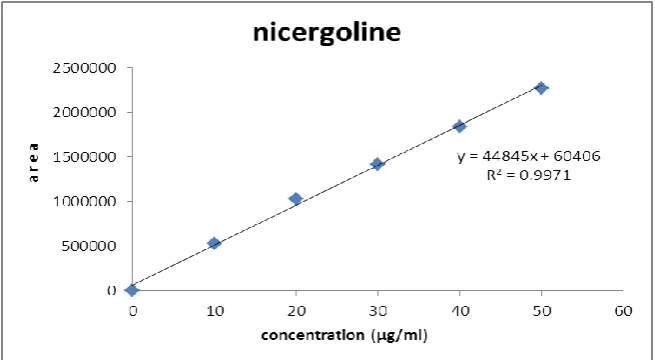
Calibration Curve
Appropriate aliquots of standard Nicergoline stock solution were taken in different
volumetric flasks and resultant solution was diluted up to the mark with mobile phase to
obtain final concentration of 10, 20, 30, 40,50μg/ml of Nicergoline. These solutions were
injected into chromatographic system, chromatograms were obtained and peak area ratio was
determined for each concentration of drug solution. Calibration curve of Nicergoline was
constructed by plotting peak area ratio versus applied concentration of Nicergoline and
regression equation was computed. Similarly the sample solution was chromatographed and
concentration of Nicergoline in tablet sample was found out using regression equation.(r2 = y
= 44845x + 60406).
Method Validation
The method was validated for accuracy, precision, linearity, specificity, limit of detection,
limit of quantitation and robustness by following procedures.
Accuracy
The accuracy of the method was determined by calculating recovery of Nicergoline by the
method of standard addition. Known amount of Nicergoline was added to a pre quantified
sample solution and the Amounts of Nicergoline are estimated by measuring the peak area
ratios and by fitting these values to the straight line equation of calibration curve (Table 1).
The recovery studies were carried out three times over the specified concentration range and
amount of Nicergoline was estimated by measuring the peak area ratios by fitting these
values to the straight line equation of calibration curve. From the above determination,
www.wjpr.net Vol 4, Issue 11, 2015.
[image:5.595.76.522.91.180.2]807 Table. 2: The Accuracy results for NICERGOLINE
%Concentration (at specification
Level)
Area
Amount Added
(ppm)
Amount Found (ppm)
% Recovery Mean Recovery
50% 735405 15 15.051 100.345
100.19% 100% 1414436 30 30.193 100.645
150% 2069957 45 44.811 99.580
Precision
The intra-day precision study of Nicergoline was carried out by estimating the correspondence responses six times on the same day with 100μg/ml concentration and
inter-day precision study of Nicergoline was carried out by estimating the correspondence responses six times next day with 100μg/ml concentration.
Linearity and range
The linearity of the method was determined at six concentration levels ranging from
10-50μg/ml for Nicergoline. Fig.3.
Fig. 3:Calibration curve for Nicergoline
Limit of detection-2.167µg/ml.
Limit of quantification-6.568 µg/ml
Stability
In order to demonstrate the stability of both standard and sample solutions during analysis,
both the solutions were analyzed over a period of 8 hours at room temperature
[image:5.595.134.462.384.564.2]www.wjpr.net Vol 4, Issue 11, 2015.
808
Robustness of the method was studied by Changing the flow rate of organic phase by ±1%
and the PH by ± 0.1, and also by observing the stability of the drugs for 24 hours at ambient
temperature in the mobile phase.
RESULTS AND DISCUSSION Selection of the detection wavelength
The UV spectra of Nicergoline in comprising mixture of buffer (pH 6, adjusted potassium
dihydrogen phosphate) Methanol: Phosphate Buffer in the ratio of 70:30 v/v, was scanned in
the region between 200 and 400nm and shows λmax at 289nm.
Optimization of the chromatographic conditions
Proper selection of the stationary phase depends upon the nature of the sample, molecular
Weight and solubility. The drug Nicergoline is polar. The mixture of methanol and phosphate
buffer was selected as mobile phase and the effect of composition of mobile phase on the
retention time of Nicergoline was thoroughly investigated. A short run time and the stability
of peak asymmetry were observed in the ratio of Phenomenex Gemini C18 (4.6×250mm,5µ)
column, with mobile phase comprising mixture of buffer (pH 6, adjusted potassium
dihydrogen phosphate) Methanol: Phosphate Buffer in the ratio of 70:30 v/v, at the flow rate
1ml/min. The detection was carried out at 289 nm. The retention time of Nicergoline was
found to be 2.212 min, which indicates a good baseline (Figure-3). The number of
Theoretical plates was found to be 6294. (USP) which indicates efficient performance of the
column. The calibration curve for Nicergoline was obtained by plotting the peak area ratio
versus the concentration of Nicergoline over the range of 10-50μg/ml, and it was found to be
linear with r2 = 0.999. The regression equation of Nicergoline concentration over its peak area
ratio was found to be y =100.00%, where x is the concentration of Nicergoline and Y is the
respective peak area. The data of regression analysis of the calibration curve was shown in
table. The RSD values for accuracy and precision studies obtained were less than 2% which
revealed that developed method was accurate and precise. The limit of detection and limit of
quantification for Nicergoline was Found to be 2.167µg/ml and 6.568 µg/ml, indicates the
sensitivity of the method. The system suitability and validation parameters were given in
(Table).The high percentage of recovery of Nicergoline was found to be 100.19% indicates
that the proposed method is highly accurate. The absence of additional peaks indicates no
interference of the recipients used in the tablets
www.wjpr.net Vol 4, Issue 11, 2015.
809 Acid degradation
Acid degradation
20 tablets of Nicergoline were taken, powdered and the average weight of one tablet was
calculated. From this powder of 100 mg equivalent weight of Nicergoline sample was taken
into a 100mL clean dry volumetric flask and add about 30mL of 0.1N Hcl and kept a side for
3hours and add 30mL of 0.1N NaOH solution to neutralize the solution and volume was
made up to mark by using Diluent and sonicated to dissolve it completely.
Further 0.15ml of Nicergoline above stock solution was pipetted out into a 10ml volumetric
[image:7.595.131.461.291.464.2]flask and diluted up to the mark with diluent. (Fig.4)
Figure 4: showing acid degradation for Nicergoline
Alkaline degradation
20 tablets of Nicergoline were taken, powdered and the average weight of one tablet was
calculated. From this powder of 100 mg equivalent weight of Nicergoline sample was taken
into a 100mL clean dry volumetric flask and add about 30mL of 0.1N NaOH and kept a side
for 3hours and add 30mL of 0.1N Hcl solution to neutralize the solution and volume was
made up to the mark by using Diluent and sonicated to dissolve it completely.
Further 0.15ml of Nicergoline above stock solution was pipetted out into a 10ml volumetric
www.wjpr.net Vol 4, Issue 11, 2015.
810 Figure.5: showing Alkaline degradation for Nicergoline
Thermal degradation
20 tablets of Nicergoline were taken, powdered and the average weight of one tablet was
calculated. From this powder of 100 mg equivalent weight of Nicergoline sample was taken
into a 100mL clean dry volumetric flask and expose to heat at 80-90ºc for 3hours and the
volume was made up to the mark by using Diluent and sonicated to dissolve it completely.
Further 0.15ml of Nicergoline above stock solution was pipetted out into a 10ml volumetric
flask and diluted up to the mark with diluent. Fig .6.
Figure.6: showing Thermal degradation for Nicergoline Peroxide degradation
20 tablets of Nicergoline were taken, powdered and the average weight of one tablet was
calculated. From this powder of 100 mg equivalent weight of Nicergoline sample was taken
into a 100mL clean dry volumetric flask and add about 30mL of Hydrogen peroxide solution
and kept a side for 3hours and volume was made up to the mark by using Diluent and
www.wjpr.net Vol 4, Issue 11, 2015.
811
Further 0.15ml of Nicergoline above stock solution was pipetted out into a 10ml volumetric
flask and diluted up to the mark with diluent. (Fig 7)
Figure.7: showing peroxide degradation for Nicergoline
Photolytic degradation
20 tablets of Nicergoline were taken, powdered and the average weight of one tablet was
calculated. From this powder of 100 mg equivalent weight of Nicergoline sample was taken
into a 100mL clean dry volumetric flask and expose to sunlight for 3hours and the volume
was made up to mark by using Diluent and sonicated to dissolve it completely.
Further 0.15ml of Nicergoline above stock solution was pipetted out into a 10ml volumetric
flask and diluted up to the mark with diluent. (Fig 8). The degradation values are shown in
the (Table 3).
www.wjpr.net Vol 4, Issue 11, 2015.
[image:10.595.69.534.362.511.2]812 Table.3 Results for degradation studies of Nicergoline
S. No Type of degradation Weight of sample
(µg/ml) Area of sample
Assay content(% w/w)
1 Acid (0.1N HCl) 30 29.832 99.441 2 Base (0.1N NaOH) 30 29.422 98.073 3 Peroxide (3% H202) 30 29.190 97.300
4 Thermal (at 600 c) 30 28.796 95.988 5 Photolytic (sunlight) 30 29.632 98.775
Summary
RP-HPLC method was developed for estimation of Nicergoline in bulk and its tablets dosage
form. Chromatographic separation was performed on Phenomenex Gemini C18
(4.6×250mm,5µ) column, with mobile phase comprising mixture of buffer (pH 6, adjusted
potassium dihydrogen phosphate) Methanol: Phosphate Buffer in the ratio of 70:30 v/v, at
the flow rate 1ml/min. The detection was carried out at 289 nm.
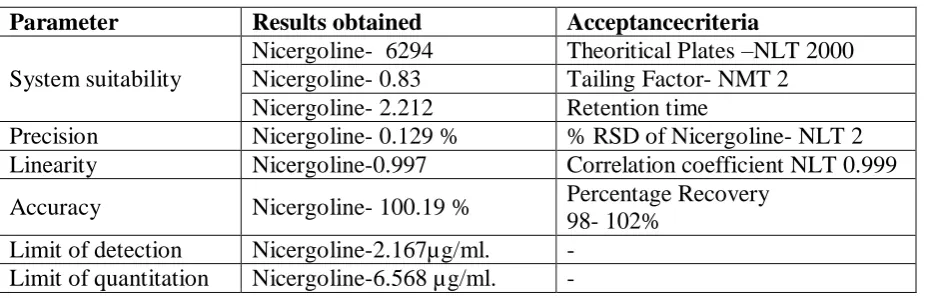
Table. 4 Summary for RP-HPLC Method
Parameter Results obtained Acceptancecriteria
System suitability
Nicergoline- 6294 Theoritical Plates –NLT 2000 Nicergoline- 0.83 Tailing Factor- NMT 2 Nicergoline- 2.212 Retention time
Precision Nicergoline- 0.129 % % RSD of Nicergoline- NLT 2 Linearity Nicergoline-0.997 Correlation coefficient NLT 0.999
Accuracy Nicergoline- 100.19 % Percentage Recovery 98- 102%
Limit of detection Nicergoline-2.167µg/ml. - Limit of quantitation Nicergoline-6.568 µg/ml. -
CONCLUSION
The proposed RP-HPLC method was found to be precise, specific, accurate, rapid and
economical for estimation of Nicergoline in tablet dosage form. The sample recoveries in all
formulations were in good agreement with their respective label claims and this method can
be used for routine analysis. It can be applied for routine analysis in laboratories and is
suitable for the quality control of the raw materials, formulations and in routine laboratories.
ACKNOWLEDGEMENTS
The authors wish to thankful to Sura Labs, Pvt, Dilshuknagar, Hyderabad for providing the
gift sample of Nicergoline. The authors are thankful to Chairman and Principal of CMR
www.wjpr.net Vol 4, Issue 11, 2015.
813 REFERENCES
1. Andrea Weston and Phyllisr. Brown (1997) HPLC Principle and Practice, 1st edition,
Academic press, Page. No 24-37.
2. BraithWait A and Smith FJ (1996) Chromatographic Methods, 5thedition, Kluwer
Academic publisher, Page. No 1-2.
3. Breaux J and Jones K (2003) Understanding and implementing efficient analytical
method development and validation. Journal ofPharmaceutical Technology, 5, Page. No
110-114.
4. Chromatography online available at http://en.wikipedia.org/wiki/chromatography.
5. Dan zhang, Rong Zheng, Yi-Hong Wu, De-xi Jiang (2012). Determination of metabolite
of nicergoline in human plasma by high-performance liquid chromatography and its
application in pharmacokinetic studies. Journal of Pharmaceutical analysis. 2(1) Page.
No. 62-66
6. Data elements required for assay validation, (online) Available at
http://www.labcompliance.com/tutorial/methods/default.aspx.
7. Drug profile of Nicergoline (online) Available at
http://www.drugsupdate.com/brand/showavailablebrands/342.
8. General HPLC Column care available at http://www.nestgrp.com/pdf/colcare.pdf
9. Introduction to analytical method validation (online), available at
http://www.standardbase.hu/tech/HPLC%20validation%20PE.pdf.