R E S E A R C H
Open Access
UAV positioning for throughput
maximization
Shams ur Rahman and You-Ze Cho
*Abstract
The throughput of a communication system depends on the offered traffic load and the available capacity to support that load. When an unmanned aerial verhicle (UAV) is responsible for providing the communication service to users within its transmission range, the position of the UAV determines how much capacity each user gets. The closer the UAV to a user, the greater the capacity that the user gets. For a given set of user traffic demands and user locations, it is possible to maximize the total throughput by optimally positioning the UAV. This paper presents two methods, a heuristic method and an approximation algorithm, for determining the UAV position that maximizes the overall system throughput. This paper also considers a related problem of keeping all users within the transmission range while determining the UAV position that maximizes throughput. The proposed schemes were evaluated with extensive simulations using MATLAB and the ns-2 simulator. The results show that significant throughput
enhancement is possible by optimally positioning the UAV when user positions are unevenly distributed and/or data rate demands are widely spread.
Keywords: Throughput, Maximization, Optimal, UAV, Positioning, Transmission range
1 Introduction
Recently, unmanned aerial vehicles (UAVs) have attracted increasing research and commercial interest [1]. In par-ticular, small-scale UAVs are being considered for a wide range of applications such as surveillance [2], search and rescue [3], forest fire monitoring [4], radiation monitoring [5], and sports [6]. Meanwhile, advancements in wireless and mobile communication technologies have changed all aspects of our lives. The demand for more bandwidth and the ability to communicate anytime and anywhere is increasing. Although the traditional infrastructure-based communication systems (such as cell tower-based LTE and access point-based Wi-Fi) have expanded to every corner in most countries, their lack of mobility hinders their adaptation to dynamic environments. Furthermore, their high cost and lengthy installation procedures make them unsuitable for deployment in remote locations and emergency scenarios. Therefore, non-traditional meth-ods, such as project loon [7] and Facebook drone project [8], have emerged. For more dynamic and ad hoc scenarios, small-scale UAVs are attractive for their
*Correspondence:[email protected]
School of Electronics Engineering, Kyungpook National University, Daegu, Korea
maneuverability, ease of deployment, hovering ability, and low cost. Small-scale UAVs are being considered to func-tion as wireless relays to enhance the performance of cellular networks [9,10] and satellite communication sys-tems [11]. Their ease of deployment and low cost makes UAV-based communication systems attractive for mobile crowds (handling site outage and overload conditions in cellular networks) [10,12] and emergency scenarios, such as natural or man-made disasters [13,14].
Positioning of UAVs affects various network perfor-mance metrics, such as throughput, coverage, connec-tivity, and revenue. Bor-Yaliniz and Yanikomeroglu [15] examined the positioning of drone base stations (BSs) for coverage and revenue maximization. Rasario et al. [16] proposed a mechanism for the placement of UAV relays to support the transmission of high-quality live videos. Zhan et al. [17] considered a communication system using a UAV as a relay between ground-based terminals and network BSs. They proposed an algorithm for the perfor-mance optimization of the ground-to-relay link by con-trolling the heading angle of the UAV. Dixon and Frew [18] proposed a mobility control algorithm for optimally
tioning a chain of UAVs acting as communication relays to achieve end-to-end communication. Guo et al. [10] derived a closed-form expression for determining the optimal locations for the relays. Although in [10], the opti-mal locations for UAVs were also discussed, the reported study was fundamentally different from our work. In our work, the UAV position is determined based on the traf-fic demands and positions of the users, whereas the study in [10] was concerned with obtaining the optimal relay position with respect to other relays. Furthermore, [10] is focused on theoretical analyses, whereas our work is focused on algorithms. Kalantari et al. [19] investigated the three-dimensional (3D) placement of drone BSs in 5G wireless networks constrained by the capacity of the back-haul link. Their objective was to maximize the number of served users and their total rate. In contrast with our work, the model in [19] considered only the physical layer characteristics. In our work, we consider both the physical (PHY) and media access control (MAC) layer character-istics to determine the UAV position that maximizes the throughput.
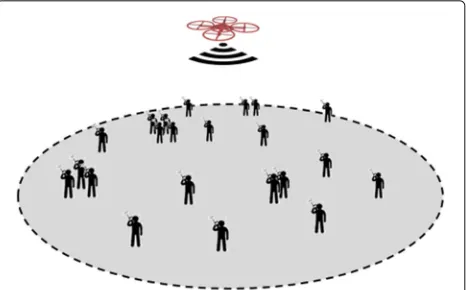
Throughput is an important network performance met-ric. It is defined as the actual rate at which informa-tion is transferred and is usually measured in bits per second (bps). The throughput of a link depends on the offered load and the link capacity. The link capac-ity depends on the channel bandwidth and the signal-to-interference-plus-noise ratio (SINR). SINR depends on the transmission power, the distance between the transmitter and receiver, and the propagation (channel) model. Therefore, SINR can be controlled by changing the transmitter/receiver distance. In traditional commu-nication systems, the position of the base transceiver stations (BTS) or access points (or any other device pro-viding communication access) is fixed and cannot be changed to improve the SINR. However, a UAV-based communication system offers the ability to adjust the position (of BTS or access point) according to user traf-fic demands and maximize throughput. We consider a scenario in which a UAV provides communication ser-vice to multiple users located within its transmission range, as shown in Fig. 1. For a given set of data rate demands and user positions, it is obvious that some UAV positions will produce more throughput than others.
In this paper, we address the issue of optimally posi-tioning a single UAV with respect to its associated users to maximize throughput. Our proposed solutions can be used in scenarios where UAVs function as single-hop com-munication relays. Such scenarios arise when the coverage extension of cellular communication is required. Similarly, such scenarios can arise in post-disaster communication systems. Moreover, the proposed solutions can be adapted for use in centralized multi-hop communication systems
Fig. 1A typical scenario. A UAV is providing communication service to some users within its transmission range. Throughput of individual users and the entire system depends on the position of the UAV
(e.g., software-defined networking-based systems) by con-sidering not only the UAV-to-user communication but also the UAV-to-UAV communication.
The contributions of this paper are summarized as follows:
• We provide a mathematical formulation of the problem: to maximize throughput, considering the characteristics of the PHY and MAC layers, by optimally positioning a UAV based on the data rate demands and positions of its associated users.
• We propose a heuristic method and an
approximation algorithm for determining the UAV position that maximizes throughput.
• This work also introduces a simple and
computationally efficient method for keeping all associated users within the transmission range of the UAV while determining a UAV position that maximizes throughput.
We performed extensive simulations using MATLAB and the ns-2 simulator to evaluate the performance of the proposed schemes for various levels of unevenness in user position distribution. Results show that when user positions are more non-uniformly distributed around the UAV, the potential for throughput maximization is high. Furthermore, data rate demands with various ranges of uniform distribution were generated and evaluated. Results show that when data demands are widely spread, the potential for throughput maximization is high. More-over, results clearly demonstrate that the approximation algorithm achieves considerably more improvement in throughput as compared to the heuristic method.
is described in Section3. The approximation algorithm is discussed in Section4. Section5presents the simulation results. Section6discusses some associated issues. Finally, Section7 presents the conclusions and discusses future work.
2 Background and problem formulation
This section first illustrates the context for our idea of throughput maximization and for the proposed schemes and then describes a formal formulation of the problem.
2.1 Background
2.1.1 Effect of transmitter/receiver distance on physical data rate
One of the main factors affecting the physical data rate, Cphy, of a wireless link is the signal-to-interference-plus-noise ratio (SINR). Moreover, because of path loss, the received signal power is proportional tod−α, wheredis the distance between the transmitter and receiver andαis the path loss exponent. In practical systems, some mod-ulation scheme is used to package bits into symbols for transmission over the wireless channel. For high SINR, modulation schemes package more bits in each symbol. For example, as shown in Table1, with 802.11a, 54 Mbps data rate can be used when SINR is at least 25 dB. Other-wise, a lower data rate must be used [20]. When the SINR degrades, the bit error rate increases as the receiver is not able to correctly decode the received symbols. There-fore, the modulation schemes resort to packaging fewer bits in each symbol as the SINR decreases. Thus, the data rate drops. Therefore, for any modulation scheme, as the SINR increases, the maximum achievable data rate increases and vice versa. A UAV-based network offers the advantage to move and position nodes as desired for performance improvement. The SINR for a user can be improved by positioning the UAV closer to that user. The problem is simple for a single user but becomes tricky when multiple users are communicating with the UAV.
Table 1SINR and received power requirements for IEEE802.11a
[20,26]
Physical rateCjphy(Mbps) SINR (dB) Min received power (dBm)
54 25 −40
48 24 −42
36 18 −52
24 17 −57
18 11 −66
12 9 −70
9 8 −73
6 6 −76
2.1.2 Throughput capacity at the MAC layer and above LetCjphy denote the physical data rate for userjandCj
denote the throughput capacity forj at the MAC layer. In practice, Cj is less than Cjphy because of the header
and protocol overheads. However, it is obvious that higher physical data rates produce higher throughput at MAC layer (layer 2) and above. For example, with IEEE802.11a, the maximum throughput at layer 2 mainly depends on the frame size and the physical rate [21].
Ifjis not sharing the channel with any other user, then Cj is also the effective capacity of the user. However, if
other users are also sharing the channel, then the effective throughput capacity,Ceffj , will be further reduced. IfSis the set of users sharing the channel andtjis the fraction of
time userj∈Sthat gets to use the channel, then
Cjeff=tjCj,∀j∈S (1)
j∈S
tj≤1,∀j∈S (2)
Equation (2) implies that no more than one user can use the channel at a time, which effectively eliminates the interference between the users inS. The time fraction,tj,
is referred to as the airtime of userj. It is important that each user gets a fair share of airtime; otherwise, the system cannot achieve its full throughput potential. This is partic-ularly the case for a multi-rate IEEE802.11 network. The DCF of IEEE802.11 suffers from the rate anomaly prob-lem, wherein the stations transmitting at a slower rate get more airtime as compared with stations transmitting at higher rates [22]. This results in throughput degradation for the faster transmitting stations. In our approximation algorithm, users are allocated airtime according to the max-min fair allocation policy.
2.1.3 Throughput depends on the offered load and the effective capacity
The throughput of a communication system depends on the data rate demands of the communicating users and the effective throughput capacity available to these users. Specifically, if Ratejis the data rate demand of userj, and
Ceffj is the effective throughput capacity available toj, then the maximum throughput achievable byjis
τj=min
Ratej,Cjeff
(3)
The total throughput,τ, of the system can be computed as follows:
τ =
j∈S
τj (4)
2.1.4 Keeping all associated users within the transmission range
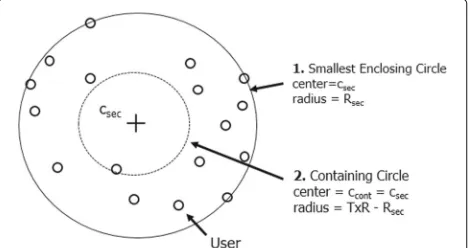
It is important to ensure that all users remain inside the transmission range,TxR, of the UAV while positioning it for throughput maximization. Therefore, the UAV can-not be allowed to move to any position. Thus, the UAV should be assigned a position in a certain region such that it can keep all the users within its transmission range. Let us call this region the containing region. The con-taining region is defined by the intersection of the circles centered at the positions of the users, with each cir-cle having radius TxR. Kratky [23] showed that the intersection region of n circles having the same radii can be derived from the intersection region of fewer circles; however, they did not provide any algorithm. Librino et al. [24] proposed an algorithm for com-puting the intersection of circles of arbitrary radii, but their algorithm is computationally expensive and, therefore, not suitable for our proposed application. Therefore, we propose a simple and computation-ally efficient method for approximating the containing region.
When the altitude and the transmission range of the UAV are fixed, we can determine a circular region that approximates the containing region. We call this circular regionthe containing circle. As long as the UAV remains within the containing circle, all users will be within its transmission range. The containing circle can be deter-mined using user positions as follows:
1. Determine the smallest enclosing circle for the user positions, as shown in Fig.2. Its center is denoted by csecand its radius byRsec. The smallest enclosing circle for a set of points is a circle with the smallest radius that encloses all the points [25].
2. Using information on the smallest enclosing circle, compute the containing circle. Its center is
ccont=csecand radius isRcont=TxR−Rsec. As long
Fig. 2Computingthe containing circle. At its fixed altitude, the UAV must remain inside the containing circle to keep all associated users inside itsTxrange
as the UAV remains inside the containing circle, no users will be outside its transmission range.
To show that all the users will be within the transmis-sion range if the UAV is positioned anywhere inside the containing circle, let distance(a,b) denote the distance between pointsaandb. By definition, we know that
distance(pj,csec)≤Rsec,∀j∈S (5)
wherepjdenotes the position of userjandSis the set of
users. Moreover,
distance(pj,p)≤Rsec+Rcont,∀p∈ContainingCircle,∀j∈S. (6)
SinceRcont=TxR−Rsec, therefore,
distance(pj,p)≤TxR,∀p∈ContainingCircle,∀j∈S.
(7)
Because the containing region is a convex polygon bounded by circular arcs, the containing circle pro-vides a reasonable approximation for the objective of our application.
2.2 Problem formulation
We consider a single UAVu. Assuming that the UAV flies at a fixed altitude, it has a fixed transmission range in the user plane, denoted byTxRinplane. For simplicity of nota-tion, in the rest of the paper, we will refer toTxRinplane asTxR. There is a set S of |S| users to which the UAV is providing communication service. All users are inside the TxR of the UAV. All users are located on a flat surface (ground) and are sharing the same channel. Let pu denote the position of the UAV and τ(p) represent
the total throughput when the UAV is positioned at p. That is,
τ(p)=
j∈S,pu=p
τj (8)
The objective is to determine a UAV position p∗ ∈ ContainingCircle such that τ(p∗) ≥ τ(p),∀p ∈ ContainingCircle.
maximize
pu
j∈S
tjCj (9a)
subject to
j∈S
tj≤1 (9b)
Ratej−tjCj≥0, ∀j∈S (9c)
(Ratej−tjCj)(tj−tk)≥0, ∀j∈S,∀k∈S−j
(9d)
distance(pu,ccont)≤Rcont (9e)
dj=distance(pu,pj), ∀j∈S (9f)
Cj=f(Pt,dj,Ij), ∀j∈S (9g)
Equation (9a) is the objective function, which implies that total throughput needs to be maximized by finding an optimal UAV position. Equation (9b) ensures that no more than one user transmits at a time. Equation (9c) ensures that the airtime allocated to a user is not more than the user needs. Equation (9d) ensures the max-min fairness of the airtime allocation among the users. Equation (9e) enforces that the UAV should remain inside the containing circle while finding the optimal position. Equation (9f) computes the distance between each user and the UAV. Equation (9g) shows that the throughput capacity is a function of the transmit power, distance between a user and the UAV, and interference experienced by the user. The throughput capacity also depends on the radio technology used. In Section4.2.1, we will describe how the throughput capacity can be computed for IEEE802.11a.
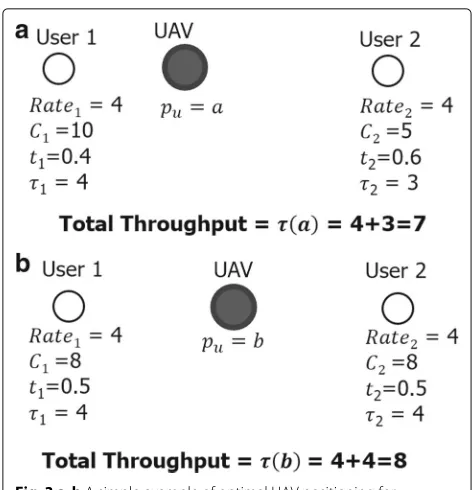
2.3 A simple example
Figure3 depicts a very simple scenario, which involves two users and a UAV. Initially, the UAV is positioned at point a, as shown in Fig. 3a. User 1 has a data rate demand, Rate1, of 4 units/s. The throughput capacity,
C1, for him/her is 10 units/s; therefore, an airtimet1 = 0.4 is sufficient to satisfy the data rate demand of user 1. Therefore, the maximum achievable throughput, τ1, between user 1 and the UAV is 4 units/s. User 2 has a data rate demand, Rate2, of 4 units/s, but his/her through-put capacity,C2, is 5 units/s. User 2 gets an airtimet2 = 0.6. Therefore, the maximum achievable throughput,τ2, between user 2 and the UAV is 3 units/s. Thus, the total throughput, τ(a), is 7 units/s. This throughput can be increased if the UAV is moved to position b (which is closer to user 2) as shown in Fig. 3b. Now, the throughput capacity, C1, for user 1 is 8 units/s. Meanwhile, the throughput capacity, C2, for user 2 has increased to 8 units/s. Thus, user 2 can now achieve a throughput, τ2, of 4 units/s. Therefore, the total throughput, τ(b), has increased from 7 units/s to 8 units/s.
Fig. 3 a,bA simple example of optimal UAV positioning for throughput maximization
3 Heuristic method for determining UAV position Heuristic methods do not guarantee to produce the opti-mal solution, but they are computationally inexpensive. In this section, we propose a heuristic method for com-puting the UAV position to maximize the throughput. This method involves computing weightwjfor each user
j∈Sand computing the desired UAV position,pu, using
Eq. (10).
pu=
j∈Swjpj
j∈Swj
(10)
Here,wjis the weight assigned to userjandpjis the
posi-tion of user j. This heuristic utilizes the user’s data rate demand to compute the weight for that user.
3.1 What is the effect of the weights?
Each user tries to pull the desired UAV position towards itself according to its relative weight value. The greater the relative weight value, the closer the desired UAV position to it.
3.2 Computing weights
the radio technology used. Here, we derive a mathemati-cal formula for computing these weights. First, we derive an expression for computing the weights without consid-ering the interference power. We subsequently extend that expression to incorporate the interference power.
Let Cjphy represent the physical data rate of the link between the UAV and its associated nodej. According to Shannon,
wherePr,jis the received signal power for a link betweenu
andj. For a propagation model with path loss exponentα,
Pr,j=PtGtGr
λ
4πdj
α
(12)
wherePtis the transmit power;GtandGrare the transmit
and receive antenna gains, respectively; λ is the wave-length of the radio frequency used; anddjis the
transmit-ter/receiver distance. Substituting forPr,jin Eq. (11), we
obtain
The parameterβ acts as a correction factor because the actual rate achieved by a practical system is less than the Shannon capacity. Therefore, it can be used to capture rel-evant characteristics of the radio technology used and the protocol overhead.
Therefore, using Eq. (16), the weight for each user can be computed and then Eq. (10) can be used to compute the desired UAV position. WhenPt,Gt,Gr, andλare similar
for all users, then Eq. (16) is simplified to
wj=
Equations (16) and (17) provide the expressions for com-puting the weights for each UAV in the absence of inter-ference. It is worth mentioning here that when a MAC protocol is used, the users associated with the UAV will not interfere with each other. For example, the use of RTS/CTS in IEEE802.11 networks ensures that no more than one user transmits at a time. However, if there are other sources of noise that are not part of the network, they might cause interference at the UAV and the users. Therefore, we extend the expression to incorporate the interference caused by sources outside the network. If user j and the UAV experience different levels of inter-ference, then the link between j and the UAV is asym-metrical; therefore, we compute weights for uplink,wj,u,
and downlink,wj,d, directions of the link and subsequently
compute the overall weightwj.
wj,u=
data rate demand ofjin the uplink direction. Similarly,
wj,d=
whereIjis the interference experienced byjandRatej,dis
the data rate demand ofjin the downlink direction. The overall weight,wj, iswj=wj,u+wj,d.
It is worth mentioning here that, in this paper, we used the large-scale path loss model to derive equations for computing weights; however, using the same procedure, such equations can be derived for other channel models.
3.2.1 Implementation of the heuristic method
Line 19 divides the un-normalized UAV position by the sum of weights to obtain the desired UAV positionpu. The
computational complexity of this heuristic is linear in the number of users. Specifically, it is O(|S|), where|S|is the number of users.
Procedure 1Heuristic
1: procedureHEURISTIC(S,Pusers,Rates,I)
2: SumOfWeights←0 3: UnNormalizedPu←0
4: if|I| = ∅then 5: forj∈Sdo
6: Determine wj based on Ratej ∈ Rates using
either Eq. (16) or Eq. (17).
7: UnNormalizedPu←UnNormalizedPu+wjpj
8: SumOfWeights←SumOfWeights+wj
9: end for 10: else
11: forj∈Sdo
12: Determinewj,ubased onRatej,u∈RatesandIu∈
Iusing Eq. (18).
13: Determinewj,dbased onRatej,d∈RatesandIj∈
Iusing Eq. (19). 14: wj←wj,u+wj,d
15: UnNormalizedPu←UnNormalizedPu+wjpj
16: SumOfWeights←SumOfWeights+wj
17: end for 18: end if
19: pu← UnNormalizedPSumOfWeightsu
20: return pu
21: end procedure
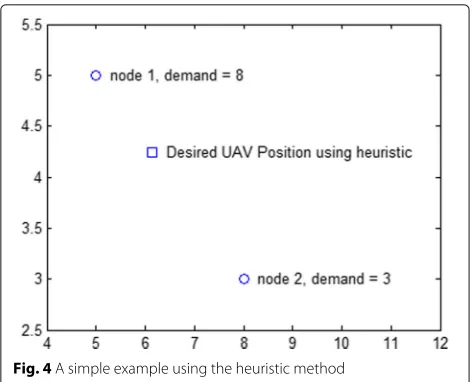
3.2.2 A simple example using the heuristic method
Suppose there are two users and a UAV. For simplicity, we ignore the UAV altitude in this example. The positions of users arep1 = (5, 5) andp2 = (8, 3), and their data
rate demands are Rate1 = 8 and Rate2 = 3. Comput-ing weights usComput-ing Eq. (17) and then substituting in10, we getpu=(6.1, 4.2). The positions of users and the desired
UAV position are displayed in Fig.4. The desired UAV position is nearer to user 1 because the data rate demand of user 1 is higher than that of user 2.
3.2.3 Ensuring that all associated users remain inside the transmission range
If the desired UAV position determined by the heuristic method is inside the containing circle, then it is guaran-teed that all users will be within the transmission range of the UAV. However, if it (the desired position) is outside the containing circle, then some users might be outside the transmission range. For example, as shown in Fig.5,
Fig. 4A simple example using the heuristic method
the users indicated by the black filled circles are left out-side the transmission range of the UAV. Therefore, the desired UAV position needs to be adjusted to keep all associated users within its transmission range. We explain the method for keeping all users in the TxR of the UAV while maximizing throughput using Fig.5. User positions are indicated by small circles.
1. Based on user traffic demands and user positions, compute the desired UAV position, indicated by
pdesired.
2. The desired UAV positionpdesiredis outside the
containing circle (as shown in Fig.5). Some users (indicated by the small filled circles) are outside the Tx range. Therefore, we need to adjust the desired position so that all users are inside theTx range of the UAV.
3. The adjusted desired positionpdesiredlies at the
intersection of the containing circle and the line segmentccontpdesired(that is, the line segment
joiningccontandpdesired.
4. When the UAV is moved topdesired, all users will be within theTx range. Therefore, a better throughput can be achieved while keeping all users in the transmission range of the UAV.
4 Approximation algorithm
The optimization problem defined in Eq. (9) is a non-convex optimization problem because the objective func-tion defined in Eq. (9a) can have local maxima (equiv-alently, the equivalent objective function, minimize
pu −
j∈StjCj, can have local minima) when the number of
Fig. 5Adjusting the desired UAV position, determined by the heuristic method, to keep all users inTxrange of the UAV
present an approximation algorithm for computing a UAV position that maximizes throughput. This algorithm esti-mates throughput at various positions inside the contain-ing circle and chooses the position that has the maximum estimated throughput.
The approximation algorithm can be conceptually described as follows:
1. Define a grid of points (candidate positions for the UAV) inside the containing circle.
2. Estimate the total throughput at each grid point. 3. Choose the grid point with the maximum estimated
throughput as the desired UAV position.
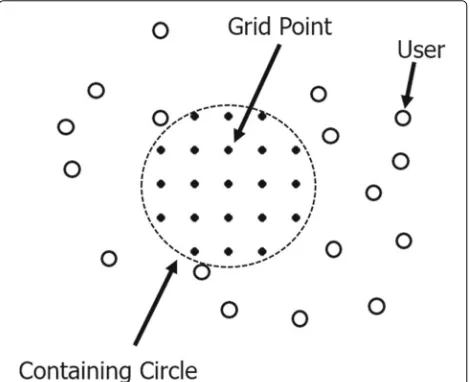
4.1 A grid of points inside the containing circle
As discussed in Section 2.1.4, as long as the UAV remains inside the containing circle, all its associated users will remain within its transmission range. By estimating throughput at various points inside the containing circle, it is possible to find a point that is approximately close to the point that produces the maximum throughput.
Given that it is practically impossible to evaluate the estimated throughput at each point inside the contain-ing circle (there are infinitely many points), therefore, we define a grid of points inside the circle as shown in Fig. 6. The resolution of the grid can be adjusted as needed.
4.2 Estimating throughput at a grid point
As discussed in Section 2.1.3, the throughput of a user depends on the user data rate demand and the available throughput capacity. The total throughput is obtained by adding the throughput of all users. Therefore, to estimate the total throughput at a grid point (as a UAV position),
we need to estimate the throughput for each user and then compute its total.
4.2.1 Estimating throughput capacity, Cj, for each user at a grid point
To estimate the throughput for users at a grid point, we need to estimate the physical data rate,Cjphy, for each user
j∈S. Based onCjphy, throughput capacity at MAC layer,Cj,
can be determined for each user.
Procedure2estimatesCjfor each user at a grid point.
It takes as input the set of users S, grid point pg, set of
positions of the usersPusers, channel model ChanModel,
transmit powerPt, and set of interference levels I. Line
2 initializes setC as empty. Lines 3 to 10 compute the throughput capacity for each user and add it to setC. Line 4 computes distance, dj, between a user j ∈ S and the
grid pointpg. Line 5 computes the received power,Pr,j,
for user j based on transmit powerPt, distancedj, and
channel modelChanModel.ChanModelcan be any chan-nel model applicable in the deployment environment. In our simulations, we used Friis free-space path loss model owing to its simplicity. Line 6 computes the SINR. Line 7 determines the appropriate physical data rate, Cjphy, according to the computed SINR, which also depends on the radio technology used. In our simulations, we choose Cphyj according to Table1. The minimum received power values have been derived based on the receiver sensitiv-ity requirements specified in IEEE802.11a standard [26] and the SINR values recommended in [20] for a bit error rate (BER) of 1e−5 or less. Line 8 determines through-put capacity at the MAC layer,Cj, which depends onCjphy
and the radio technology. There are analytical models, such as in [21], for computingCjfor IEEE802.11a.
How-ever, to ensure airtime fairness, for our simulations, we compiled theCjvalues for the various physical data rates
of IEEE802.11a listed in Table 2. Line 9 adds the esti-mated Cj to C. When the loop terminates, C contains
throughput capacities, Cj, for each user j ∈ S. Line 11
returns setC.
Procedure 2Compute throughput capacity,Cj, for each
user
1: procedureCOMPUTECAPACITIES(S,pg,Pusers,
ChanModel,Pt,I)
2: C← ∅ 3: forj∈Sdo
4: dj←distance(pg,pj∈Pusers)
5: Compute received power,Pr,j, based on transmit
power,Pt,dj, andChanModel
6: ComputeSINRbased onPr,j,Iand noise powerN.
7: Choose appropriate physical data rate,Cjphy, based onPr,j,SINRand the radio technology.
8: DetermineCjbased onCjphyand the radio
technol-ogy. 9: addCjtoC
10: end for 11: return C 12: end procedure
4.2.2 Estimating throughput based on Cjand Ratej
In Section 4.2.1, we saw how to compute throughput capacity Cj for each user. We will use these
through-put capacities and data rate demands Ratej to estimate
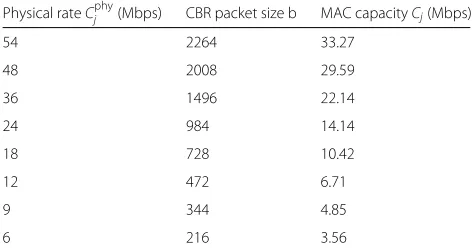
Table 2CBR packet size and MAC capacity for IEEE802.11a
physical rates
Physical rateCjphy(Mbps) CBR packet size b MAC capacityCj(Mbps)
54 2264 33.27
48 2008 29.59
36 1496 22.14
24 984 14.14
18 728 10.42
12 472 6.71
9 344 4.85
6 216 3.56
throughput for each user, which can then be used to compute total throughput at a grid point.
The throughput achievable by an individual userj ∈ S depends on the effective throughput capacity available to that user. The effective throughput capacity,Cjeff = tjCj,
for a userj∈Sdepends on the the airtime,tj, andCj. The
airtime of a user depends on the total number of users |S|, and their data rate demands Ratej,j∈ S. In our
algo-rithm, users are allotted airtime using max-min fairness. Airtime fairness means that each user gets to use the wire-less channel for approximately the same duration as every other user. However, if some users, due to lower data rate demand, do not fully use the channel for their share of time, other users with higher data rate demands may uti-lize that residue time, thereby increasing their effective throughput capacity.
lines 13 to 16 deal with the case when user’s demand is satisfied, whereas lines 17 to 20 deal with the case when it is not satisfied. For the case when the demand is sat-isfied, line 13 computes the exact airtime increment the user needs. Line 14 updates the airtime of the user (suf-ficient for its data rate demand). Line 15 decrements the TimeFractionAvailable by the amount allocated to the user in the current iteration. Line 16 removes the user from the set of contending users because its demand has been satisfied. For the case when the demand is not sat-isfied, line 18 increments the airtime of the user by an amount no less than any other user. Line 19 decrements the TimeFractionAvailable accordingly. Upon termination of the while loop, all the users have been allocated airtime in a max-min fair manner. Lines 23 to 25 compute the total throughput by summing the throughput of all users. Note that the airtime allocated to each user was not more than the user needed (tjCj ≤ Ratej); therefore, line 24 treats
the effective capacity,Cjeff =tjCj
, as the throughput for userj. Line 26 returns the total throughput.
Procedure 3Estimate throughputτ
1: procedureESTIMATETHROUGHPUT(S,Rates,C) 2: S ←S
3: TimeFractionAvailable←1 4: τ ←0
5: forj∈Sdo 6: tj←0
7: end for
8: whileS = ∅andTimeFractionAvailable>0 do 9: NoOfContendingUsers← |S|
10: TimeFractionPerUser ←
TimeFractionAvailable/NoOfContendingUsers 11: forj∈S do
12: if((tj+TimeFractionPerUser)Cj≥Ratej)then
13: FractionUsed←Ratej/Cj−tj
14: tj←Ratej/Cj
15: TimeFractionAvailable ←
TimeFractionAvailable−FractionUsed 16: RemovejfromS
17: else
18: tj←tj+TimerFractionPerUser
19: TimeFractionAvailable ←
TimeFractionAvailable−TimeFractionPerUser
20: end if
21: end for 22: end while 23: forj∈Sdo 24: τ ←τ+tjCj
25: end for 26: return τ 27: end procedure
4.3 Finding the grid point with maximum estimated throughput
In Section4.2, we described how to estimate throughput at a given grid point. To determine the grid point with the maximum estimated throughput, Procedure 4 iter-ates over all the grid points inside the containing circle. The procedure takes as input the set of users and their positions and data rate demands, channel model, transmit power, set of interference levels, and set of grid points.
Lines 2 and 3 initialize the variables τmax (maximum throughput value) andpmax(maximum throughput
posi-tion). Lines 4 to 11 loop over the grid points to determine the point with the maximum estimated throughput. Line 5 calls Procedure 2to compute the throughput capacity for each user at a grid point. Line 6 calls Procedure 3 to estimate the total throughput at a grid point. Lines 7 checks whether the throughput at the current grid point is more than the current maximum; if it is, then line 8 updates the maximum throughput value and lines 9 records the current grid point as the maximum through-put position. At the termination of the loop, the point with estimated maximum throughput, pmax, has been
determined.
4.4 Computational complexity of the approximation algorithm
Let Ngp represent the number of grid points for the
approximation algorithm. Procedure 4 makes one pass over all the grid points. For each grid point, it makes one call to Procedure2and one call to Procedure3. The computational complexity of Procedure 2 is O(|S|) and that of Procedure 3 is O(|S|2). Therefore, the compu-tational complexity of Procedure 4, that is the approx-imation algorithm, is ONgp|S|2
. The value of Ngp
depends on the grid resolution; the finer the grid res-olution, the greater the value of Ngp. Halving the
dis-tance between grid points increases the value of Ngp
quadratically.
5 Simulation results
Extensive simulations were carried out for performance evaluation using MATLAB and the ns-2 simulator. The performance was evaluated for various levels of unevenness in user position distribution. Similarly, uni-formly distributed traffic demands with various ranges were generated, and the performance of the proposed schemes was evaluated.
5.1 Simulation setup
Procedure 4Approximate optimal position
selected based on the SINR and received signal power according to Table 1. In our simulations, we assumed there were no sources of interference outside the net-work. With DumbAgent as routing protocol, we found that the frame size at MAC layer was 40 bytes larger than the CBR packet size. Therefore, to achieve airtime fairness, we used the CBR packet with different rates as shown in Table2. Given that the maximum MAC Service Data Unit (MSDU) size for IEEE802.11a is 2304 bytes, the maximum CBR packet size was chosen, so the packet size does not exceed the MSDU after the header over-head is added. Because in different environments (urban, suburban, and rural) different channel models are appli-cable and, in this work, we do not focus on any particular environment, we used Friis free-space propagation model owing to its simplicity. The transmission range was kept at 250 m, so when the UAV hovers at the height of 20 m, the transmission radius in the user plane is about 249 m. The values for MAC capacity against each physical rate in Table2were obtained experimentally using ns-2. Ini-tially, the UAV is positioned at coordinates (250,250,20) m. User positions were generated inside a circle of radius 249 m and centered at (250,250,0). For the heuristic method, β = 11 was used, which was experimentally determined.
5.2 Ensuring airtime fairness
In a multirate network, IEEE802.11 DCF suffers from a phenomenon called rate anomaly [22]. In rate anomaly, for a fixed packet size, stations transmitting at lower rates get more airtime (time to use wireless channel) than their peers transmitting at higher rates. As a result, faster stations are penalized as they are forced to wait longer for the slower station to complete their transmis-sions. For example, a packet (frame) of size 100 bytes
takes about 15 μs for a transmission rate of 54 Mbps whereas the same packet takes 133 μs when transmit-ted at 6 Mbps; the slower user occupies the channel for a duration 9 times longer than the faster user. Var-ious solutions have been proposed to achieve airtime fairness [27]. In our experiments, we achieve airtime fairness by adjusting the packet size according to the data rate.
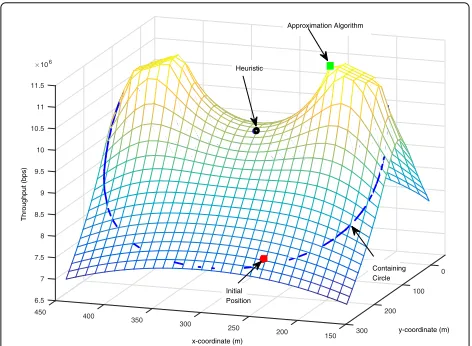
5.3 Estimated total throughput for various UAV positions Figure 7 shows a typical performance plot. The mesh plot shows the estimated total throughput against UAV positions in the x-y plane (altitude of the UAV is fixed at 20 m). User positions are not shown in this plot. It can be observed that the performance surface (objective function) is non-convex. The plot also shows the initial UAV position (250,250) and positions determined by both schemes. Positions determined by the heuristic meth-ods have a better estimated throughput than the initial position’s but not the maximum throughput. The approx-imation algorithm has determined the grid point that has the maximum estimated throughput. The improve-ment in throughput by the approximation algorithm is considerably larger than that of the heuristic method. By increasing the grid resolution, the position determined by the approximation algorithm can be made arbitrarily close the optimal position.
5.4 Effect of user position distribution on throughput In practice, user density around a UAV is highly likely to be distributed unevenly. For example, in a disaster scenario, more users will be concentrated around the area where the camp is setup whereas in the rest of the area, search and rescue workers will be scattered sparsely. Experiments for various levels unevenness (skewness) in user density were
0
a
b
c
d
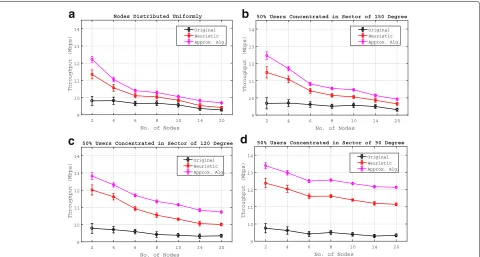
Fig. 8 a–dThroughput for various levels of unevenness in user position distributions. Data rate demands were uniformly distributed [7.4,7.6] Mbps
conducted. Various levels of unevenness were obtained by positioning 50% of the users in a sector of angle a and positioning the remaining 50% users in the remain-ing circle, that is 360 − a. By decreasing the angle a, the the level of unevenness is increased and vice versa. We carried out experiments fora = {90, 120, 150, 180}. Figure 8 shows the results for each of these distribu-tions. The curve of Original represents the throughput when the UAV is positioned at the initial position (that is, the coordinates (50,50,20) m). The increase in through-put is obtained when the UAV is moved to the position provided by the proposed schemes. The approximation algorithm produces more improvement than the heuris-tic method. For both schemes, it can be observed that the performance improvement is high when the number of
nodes (users) is small, and it decreases as the number of users increases. More precisely, the heuristic method and approximation algorithm produce a throughput improve-ment of 20.9 and 31.6%, respectively, when the number of users is 2, and it becomes 7.86 and 13.9%, respec-tively, when the number of users is 20. Figure 9 shows the percentage increases in throughput produced by the heuristic method and the approximation algorithm. The percentage increase in throughput (PIT) for a UAV posi-tion is computed with respect to the initial UAV posiposi-tion, that is (250,250,20) m. From Fig. 9, as the number of users increases, PIT decreases. However, as the uneven-ness in node distribution increases, the reduction in the PIT becomes less, as shown in Fig. 9a,b. For uniformly distributed user positions, the heuristic method produces
a b
an average throughput improvement of 5.4% whereas the approximation algorithm produces an average improve-ment of 9.4%. When the level of unevenness increases (to 50% users in sector of 90 degrees), the average improve-ment for the heuristic method and the approximation algorithm is 22.6 and 32.7%, respectively. From Fig.8a–d, it can be observed that as the unevenness in the node dis-tribution increases, more improvement in the throughput is achieved. The approximation algorithm outperforms the heuristic method. The position determined by the approximation algorithm can be made arbitrarily close to the optimal position by increasing the grid resolu-tion (more closely spaced grid points). However, increas-ing the grid resolution also increases the computation workload. In these experiments, grid resolution of 2 m was used.
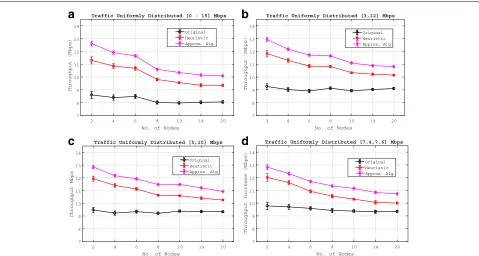
5.5 Effect of data rate demand distribution on throughput Although generally, user data rate demands are expo-nentially distributed [28], we, nevertheless, use uniform distribution because with uniform distribution, the rela-tionship between performance improvement and data rate demand spread can be more clearly established. Exper-iments for various ranges of uniformly distributed data rate demands were carried against different number of users. We define the range for uniform distribution as U − L, whereU and L are the upper and lower limits of the distribution, respectively. A larger range results in more widespread data rate demands. Figure10shows that more improvement in throughput is achieved when the number of users is small, and it declines as the number of users increases. More precisely, when the number of users is 2, the average throughput improvement is 21.57 and 30.6% for the heuristic method and the approxima-tion algorithm, respectively. However, when the number of users is 20, it becomes 9 and 15%, respectively.
Figure 11 also shows that as the range of data rate demand distribution increases, improvement in through-put increases for both schemes. For example, for ranges of [7.4,7.6] Mbps and [0,15] Mbps, the approximation algo-rithm produces an average throughput improvement of 21.4 and 34.2%, respectively. Similarly, for the heuristic method, the throughput improvement is 13.3 and 23.1%, respectively.
5.6 Running times of the approximation algorithm and the heuristic method
Table 3shows the running times for the approximation algorithm and the heuristic method. These results were obtained on MATLAB using only a single CPU of a Core i7 computer. The heuristic method’s running time remains below 1 ms even for 100 users. The running time of the approximation algorithm remains mostly below 1 s. It only takes more than 1 s when the number of grid points is
10,000 and the number of users is 60 or more. Even for 100 users, it takes less than 2 s. Although in practice, such high number of grid points will not be required, their run-ning time is still acceptable. Therefore, the approximation algorithm is suitable for deployment on UAV platforms.
6 Discussion
With the proposed scheme, the UAV’s position will be automatically adjusted according to the users’ mobility; therefore, if the users are moving in one particular direc-tion, for example, when people are evacuated to higher ground in a disaster scenario, the UAV will follow.
The proposed schemes require the UAV to know the data rate demands of the users. To achieve this, a simple way is that users communicate their data rate demands to the UAV. Alternatively, the UAV can estimate the data rate demands of users.
Although many applications have roughly stable data rate requirements, such as audio video calls and video conferencing. However, when data traffic demands fluc-tuate quickly, the UAV might be required to change its position frequently. In these conditions, the average data rate demands over some interval of time can be used instead of instantaneous data rate demands.
The approximation algorithm can be adapted for pro-viding quality of service (QoS), such as ensuring a certain level of throughput to some users or applications. More-over, the approximation algorithm can also be adapted for bandwidth fairness.
7 Conclusions
a
b
c
d
Fig. 10 a–dTotal throughput for various data rate demand distributions. User distribution unevenness was maintained at 50% in sector in 120°
a b
Fig. 11 a,bImprovement in throughput for various data rate demand distributions. User distribution unevenness was maintained at 50% in sector in 120°
Table 3Running times in seconds for the approximation algorithm and the heuristic method
No. of users Approximation algorithm Heuristic
No. of grid points
500 1000 2000 5000 10,000
20 0.026387 0.051593 0.101761 0.307311 0.624166 0.000281
40 0.038989 0.090803 0.165602 0.398023 0.860881 0.000305
60 0.051421 0.101151 0.211755 0.542757 1.119988 0.00033
80 0.064683 0.123208 0.254283 0.684712 1.369985 0.000358
proposed schemes. The approximation algorithm pro-duces more improvement in throughput than the heuristic method.
The proposed schemes can be adapted for QoS pro-visioning. As a future work, we plan to simulate the performance of the approximation algorithm for various environments, such as urban, suburban, and rural. More-over, we plan to adapt the approximation algorithm for QoS, such as smooth video streaming and low response time for interactive services.
Acknowledgements
This research was supported in part by the Basic Science Research Program through the National Research Foundation of Korea (NRF) funded by the Ministry of Education (2015R1D1A1A01059623) and by the Next-Generation Information Computing Development Program through the National Research Foundation of Korea (NRF) funded by the Ministry of Science and ICT (no. NRF 2017M3C4A7083676, 2017M3C4A7066010).
Authors’ contributions
This research was conducted by SuR under the supervision of Y-ZC. The manuscript was written by SuR under the supervision of Y-ZC. The organization of the manuscript was suggested by Y-ZC and he closely monitored the writing process for coherence, clarity, and consistency. All authors read and approved the final manuscript.
Competing interests
The authors declare that they have no competing interests.
Publishers Note
Springer Nature remains neutral with regard to jurisdictional claims in published maps and institutional affiliations.
Received: 4 July 2017 Accepted: 19 January 2018
References
1. G Cai, J Dias, L Seneviratne, A survey of small-scale unmanned aerial vehicles: recent advances and future development trends. Unmanned Syst.02(02), 175–199 (2014)
2. S Yahyanejad, D Wischounig-Strucl, M Quaritsch, B Rinner, in7th IEEE
International Conference on Advanced Video and Signal Based Surveillance.
Incremental mosaicking of images from autonomous, small-scale uavs (IEEE, 2010), pp. 329–336
3. S Waharte, N Trigoni, Supporting search and rescue operations with UAVs. IEEE Comput. Soc, 142–147 (2010)
4. L Merino, F Caballero, JR Martínez-de-Dios, I Maza, A Ollero, An unmanned aircraft system for automatic forest fire monitoring and measurement. J. Intell. Robot. Syst.65(1), 533–548 (2012)
5. PG Martin, S Kwong, NT Smith, Y Yamashiki, OD Payton, FS Russell-Pavier, JS Fardoulis, DA Richards, TB Scott, 3d unmanned aerial vehicle radiation mapping for assessing contaminant distribution and mobility. Int. J. Appl. Earth Observ. Geoinform.52, 12–19 (2016)
6. E Natalizio, R Surace, V Loscri, F Guerriero, T Melodia, Filming sport events with mobile camera drones: mathematical modeling and algorithms (2012).https://hal.inria.fr/hal-00801126
7. Loon Project - Baloon-powered Internet for everyone.https://x.company/ loon/. Accessed 24 April 2017
8. Flying Aquila: Early lessons from the first full-scale test flight and the path ahead. https://code.facebook.com/posts/268598690180189/flying- aquila-early-lessons-from-the-first-full-scale-test-flight-and-the-path-ahead/. Accessed 24 April 2017
9. W Guo, C Devine, S Wang, in9th International Symposium on
Communication Systems, Networks and Digital Sign (CSNDSP). Performance
analysis of micro unmanned airborne communication relays for cellular networks (IEEE, 2014), pp. 658–663
10. W Guo, TO Farrell, Relay deployment in cellular networks: planning and optimization. IEEE J. Sel. Areas Commun.31(8), 1597–1606 (2013) 11. T Akiyoshi, E Okamoto, H Tsuji, A Miura, Performance improvement of
satellite/terrestrial integrated mobile communication system using unmanned aerial vehicle cooperative communications, 417–422 (2017). https://doi.org/10.1109/ICOIN.2017.7899525
12. S Rohde, C Wietfeld, inIEEE Vehicular Technology Conference (VTC Fall). Interference aware positioning of aerial relays for cell overload and outage compensation (IEEE, 2012), pp. 1–5
13. G Tuna, B Nefzi, G Conte, Unmanned aerial vehicle-aided communications system for disaster recovery. J. Netw. Comput. Appl.41, 27–36 (2014) 14. A Valcarce, T Rasheed, KM Gomez, K Sithamparanathan, L Reynaud,
R Hermenier, A Munari, M Mohorcic, M Smolnikar, I Bucaille,Airborne base
stations for emergency and temporary events,vol. abs/1307.3158, (2013).
http://arxiv.org/abs/1307.3158
15. I Bor-Yaliniz, H Yanikomeroglu, The new frontier in ran heterogeneity: multi-tier drone-cells. Comm. Mag.54(11), 48–55 (2016).https://doi.org/ 10.1109/MCOM.2016.1600178CM
16. D Rosário, JA Filho, D do Rosário, A Santos, M Gerla, in16th Annual Mediterranean Ad Hoc Networking Workshop, Med-Hoc-Net 2017, Budva,
Montenegro, June 28-30, 2017. A relay placement mechanism based on
UAV mobility for satisfactory video transmissions (IEEE, Budva, 2017), pp. 1–8.https://doi.org/10.1109/MedHocNet.2017.8001638 17. P Zhan, K Yu, AL Swindlehurst, Wireless relay communications with
unmanned aerial vehicles: performance and optimization. IEEE Trans. Aerosp. Electron. Syst.47(3), 2068–2085 (2011)
18. C Dixon, EW Frew, Optimizing cascaded chains of unmanned aircraft acting as communication relays. IEEE J. Sel. Areas Commun.30(5), 883–898 (2012).https://doi.org/10.1109/JSAC.2012.120605 19. E Kalantari, MZ Shakir, H Yanikomeroglu, A Yongacoglu, in2017 IEEE
International Conference on Communications Workshops (ICC Workshops).
Backhaul-aware robust 3d drone placement in 5g+ wireless networks, (2017), pp. 109-114.https://doi.org/10.1109/ICCW.2017.7962642 20. J Yee, H Pezeshki-Esfahani,Understanding wireless LAN performance
trade-offs. (EE Times, 2002).http://www.eetimes.com/document.asp?
doc_id=1277804. Accessed 26 Apr 2017
21. J Jangeun, P Peddabachagari, M Sichitiu, inSecond IEEE International
Symposium on Network Computing and Applications, 2003. Theoretical
maximum throughput of ieee 802.11 and its applications (NCA, Cambridge, 2003), pp. 249–256
22. M Heusse, F Rousseau, G Berger-Sabbatel, A Duda, inIEEE INFOCOM 2003. Twenty-second Annual Joint Conference of the IEEE Computer and
Communications Societies (IEEE Cat. No.03CH37428). Performance anomaly
of 802.11b.vol. 2(IEEE, 2003), pp. 836–8432
23. KW Kratky, The area of intersection of n equal circular disks. J. Phys. A Math. General.11(6), 1017 (1978)
24. F Librino, M Levorato, M Zorzi, in7th International Symposium on Modeling
and Optimization in Mobile, Ad Hoc, and Wireless Networks. An algorithmic
solution for computing circle intersection areas and its applications to wireless communications, (2012), pp. 1–10.https://doi.org/10.1109/ WIOPT.2009.5291627
25. E Welzl,Smallest enclosing disks (balls and ellipsoids). (H Maurer, ed.) (Springer, Berlin, Heidelberg, 1991), pp. 359–370.https://doi.org/10.1007/ BFb0038202
26. IEEE Standard for Telecommunications and Information Exchange Between Systems - LAN/MAN Specific Requirements - Part 11: Wireless Medium Access Control (MAC) and physical layer (PHY) specifications: High Speed Physical Layer in the 5 GHz band. IEEE Std 802.11a-1999, 1–102 (1999).https://doi.org/10.1109/IEEESTD.1999.90606
27. T Joshi, A Mukherjee, Y Yoo, DP Agrawal, Airtime fairness for ieee 802.11 multirate networks. IEEE Trans. Mobile Comput.7(4), 513–527 (2008) 28. E Nan, C Xiaoli, G Weisi, Z Jie, in8th International Conference on
Communications and Networking in China (CHINACOM). User data traffic
![Table 1 SINR and received power requirements for IEEE802.11a[20, 26]](https://thumb-us.123doks.com/thumbv2/123dok_us/925152.1112185/3.595.57.290.606.733/table-sinr-received-power-requirements-ieee-a.webp)