Abstract—In the process of civil engineering supervision, the management such as personnel, materials, quality, safety, and schedule are complicated, and the data volume is large. There are many involved parties and timely coordination and feedback are difficult. This study guides the life cycle activities of civil engineering supervision through data-driven, analyzes the top-level data organization, supervision business process, interaction units and users, TDTM four elements, and proposes a description method for data integration of civil engineering supervision. We achieve the data integration of civil engineering supervision from the outside to the inside, from coarse to fine, and eliminate contradictions and redundancy, ensure data consistency. On this basis, the data entities of civil engineering supervision are determined. Then the data query and reporting of civil engineering supervision and data conversion are analyzed, and the functions of different supervision platforms are compared. The data-driven unified data platform of civil engineering supervision maintains the independence and extensibility of data, and it has more functions.
Index Terms—civil engineering supervision (CES), data-driven, data integration, entity.
I. INTRODUCTION
C
IVIL engineering is an important part of a national infrastructure. It is more important to improve the quality and efficiency of CES. CES means that the supervision unit is entrusted by the legal person and supervises and manages the construction of the project according to the legal construction documents, relevant laws, regulations and contracts. Its task is to control the investment, progress, safety and quality objectives of the project [1]. At present, there are manyproblems and deficiencies in the engineering quality, engineering progress, etc. of CES. Therefore, it is necessary
Manuscript received March 30, 2018; this Research is supported by The National Natural Science Fund of China (61303029), The Natural Science Foundation of Hubei Province, China(2015CFB525) and Hubei Provincial Natural Science Foundation of China (Grant No.2017CFA012).
Huazhu Song is with The School of Computer Science and Technology, Wuhan University of Technology, Wuhan (e-mail: [email protected].)
Ting Li (Communication author) is with The School of Computer Science and Technology, Wuhan University of Technology, Wuhan (phone:86-13297919535, e-mail: [email protected].)
Shifeng Wu is currently a Ph.D. candidate in Wuhan University of Technology, China. His research interests are big data analysis and BIM.
Xian Zhong (Communication author) received his PhD degree from Huazhong University of Science and Technology, He is with The School of Computer Science and Technology, Wuhan University of Technology, Wuhan (e-mail is [email protected].)
Xia Hongxia is professor of Wuhan University of Technology, China. Her research interest is big data analysis and application.
to integrate a large amount of data of CES. The data-driven is based on data. It makes full use of data to integrate the service mode, management mode and operation mode of the enterprise, and provides development and maintenance of all data, and thus reconstructs the data representation and business processes of the enterprise to improve the management of quality and efficiency.
In terms of progress control, X. Y. Li and others have a brief talk on progress control of construction supervision for project [2]. F. X. Xie analyze construction progress control
work in construction project [3]. In terms of safety control, D.
Hardison and other scholars proposed the important role and methods of construction supervision in effective site safety [4].
G. E. Gurcanli studied the risk assessment and safety cost estimation of construction projects [5]. Regarding data
processing and transformation, E. Alreshidi pointed out that cloud technology is expected to promote the current BIM governance solution [6], and S. Chien realized a BIM-based
cloud platform for high-performance building services [7]. In
terms of quality control, T. Fröbel et al. studied the quality evaluation of civil engineering projects [8], J. Y. Lou
researched construction quality control based on BIM [9], and
L. J. Chen studied BIM construction quality management modes and applications [10]. In addition, M. Niknam proposed
a shared ontology method for semantic representation of BIM data [11]. For data-driven, W. C. Lin and other scholars analyze
and study the common fault diagnosis methods for small faults from the data-driven perspective [12]. The data-driven
software security model and method studied by U. Erlingsson outlines the data-driven model of software security [13]. J. C.
Jiang and others improved the design of distributed systems through data-driven paradigms [14]. F. Pinelli proposed a
data-driven transport network design method [15]. Most of
these research results are used in the civil engineering construction process, and there are few studies on CES data. Although data-driven has been successfully applied in many fields, the existing CES systems are mostly based on function-driven. This article is based on this point of research. This paper takes CES as the research object and presents data integration methods throughout the life cycle of CES and CES entities by data-driven, as well as data processing related processes, to provide support for the optimization of BIM.
II.DATA INTEGRATION RESEARCH OF CES BASED ON
DATA-DRIVEN.
A. Data integration ideas of CES based on data-driven
CES data integration aims to provide a common data platform for all applications. It enables different users to access, deliver, and use data, guarantees data quality and its completeness, at the same time, it also has the flexibility to use different data combinations to represent various
Data Integration Method of Civil Engineering
Supervision Based on Data-driven
management scenarios. The integration of this paper starts from the top-level data organization, major business processes, supervision of interactive units, supervision users, and TDTM four elements, and implements top-down and coarse-to-fine data grooming.
Top data organization of CES
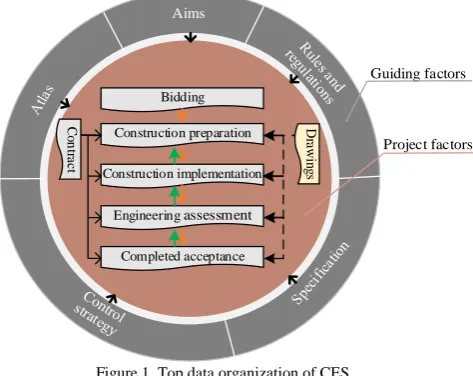
According to the problems in CES, combined with the actual supervision work content, the whole life cycle of CES based on data drive is analyzed, and the guiding factors and project-related factors of CES are determined. This article organizes CES data from top to bottom and establishes a top-level view of CES data, as shown in Figure1.
Project factors Bidding
Construction preparation
Construction implementation
Engineering assessment
Completed acceptance
Guiding factors
D
ra
w
in
gs
C
on
tra
ct
Aims
Figure 1. Top data organization of CES
In Figure 1, we describe the process of the top-level data organization in supervision, which is divided into two parts: guiding factors and various stages of project factors related to guiding factors. There is a time-series relationship between bidding and completion acceptance, and there is a staggered relationship between construction preparation and completion acceptance. It means that there is a time sequence relationship for the same type of work in the process of work, and there is a staggered relationship between different types of work. The contract and design drawings are related to the process from construction preparation to completion acceptance. They indicate that the construction process is controlled by these two factors. The design drawings are basically not changed during the construction process. And there is a connection relation between the guiding factors and the contract and the entire supervision business process.
Business process analysis of CES
On the basis of the above-mentioned top data organization for CES, a data-driven approach was adopted to classify and integrate CES data. The main processes and control methods for CES are shown in Figure 2.
Completed acceptance
Sub-item
Division-item
Pre-acceptance
Project acceptance
Bidding
Quality control
Schedule control
Cost control
Safety control
Personnel, contract control
Unit-item Bidding
letter E1
Construction preparation
[image:2.595.58.295.197.385.2]Construction implementation
Figure 2. Business process analysis of CES
In Figure 2, the main business processes of CES are bidding-construction preparation-construction implementation-construction acceptance. There is a time-series relationship between them, and there is a staggered relationship from construction preparation to completion acceptance. In the Construction implementation, each sub-project and sub-project are completed firstly, and then the work of each unit-item is completed, and there is a time-series and staggered relationship between them. In the completion acceptance, the pre-acceptance shall be performed first, and then the project acceptance, there is a time-series and staggered relationship between the two. The process after bidding includes quality control, schedule control, cost control, safety control, personnel control, contract control, and engineering change, etc. to achieve the standardized management of CES.
Analysis of interactive units and users of CES
CES relates different participant, including development organization, construction units, supervision units, urban construction archives, competent departments and design units, survey units, and quality supervision units. Data interaction takes place in the supervision unit and each unit. For the supervision unit, it reports and issues documents and data to the development unit and construction unit. There are also data and report exchanges between supervision units and urban construction archives, relevant competent departments, survey units, design units, and quality supervision units.
CES users include the chief supervision engineers, professional supervision engineers, supervisor (safety, the key stations), data clerks. The classification of users and their responsibilities are analyzed as follows:
(1) The chief supervision engineer take charge of the work conference, reviews the documents, supervises the personnel, prepares and issues reports and summary, planning, etc. and he is responsible for managing the daily work of the project supervision agency.
(2) The professional supervision engineer is responsible for the specific implementation of the professional supervision work, organize, inspect and supervise the work of the supervisor, examine and approve the sub-items and hidden projects, review the professional documents, and prepare the supervision log and monthly report. Check equipment materials and components, responsible for the professional engineering measurement.
(3) Supervisors inspect process and quality, inspect manpower, materials, major equipment and record, they go through on-site supervision work, fill in supervision log and the key stations report, and take charge of safety special record.
(4) Data clerks are in charge of data file management, meeting records, etc.
(5) The regulators are in charge of the supervision and management of project supervision agencies and management of documents.
Four-elements method TDTM
After analyzing the above-mentioned aspects of CES data, so as to analyze the important elements of the CES data in a fine-grained manner, we put forward the four-element method TDTM. The four-element method has analyzed the theme, dependency, the table, and the master data in order to obtain the themes and relationships of CES.
Theme
Progress report to review
Document archives
Quality inspection
records Claimant report to review Claimant
notice
Security check
Special rules Quality
report to review Staff planning
rules
Quality control Schedule
control Personnel
control
Contract control Cost control controlSafety
Document archives Material inspection
review Equipment
trial
Personnel assessment and
summary
Financial flows report
Accident record Planning
rules
Daily
Monthly reports
Meeting summary
Notice
Reply
Report to review
Inspection
records Material Personnel Equipment Drawings Atlas
Figure 3. Analysis of the four-element of CES
The theme is a comparatively independent part of the overall plan, such as schedule control, quality control, safety control, and cost control.
(2) Dependency
Dependencies explain the relationship between themes in CES. If a theme depends on other theme (such as personnel control depends on schedule control), then they have dependency relation.
(3) Table
The table is a data table established by related theme according to the types of reports that are actually compiled, modified, simulated, and approved.
(4) Master data
Some information items constantly applied in different tables are maintained as master data. It is easy to integrate data.
The CES data is analyzed through the four-element TDTM, as shown in Figure 3.
The four-element method extracts the themes of personnel control, schedule control, contract control, quality control, cost control, and safety control in CES, and determines their dependencies. The public information involved in the six major controls includes planning rules, design drawings, atlas, daily reports, monthly reports, notices, replies, meeting minutes, inspection records, materials, personnel, and equipment. For the description of dependency, such as schedule control, it depends on personnel control, quality control, cost control, security control, and contract control as shown.
B. Data integration of CES
Data integration description of CES
CES data integration methods include the generation of
CES data and relations, and then search for, add, and delete
them. The latter two need to verify data consistency, contradictions, and redundancy. The specific description is as follows.
Input: the direction, project, actor, interaction, control and Node Output: Node content of data elements of CES and their relationship, data processing and verification
Begin
Generate (direction, project, actor, interaction, control, node); locate(Node); // Find the node position, return the node //position L add(Node);
delete(Node);
output (direction, project, actor, interaction, control, all relationships);
Generate(Entity-Relation) {
1. direction←∅;
2. project←∅;
3. subdirectioni⊂ direction;
4. project: {{proj_static}, {proj_dynamic}};
Direction Collect (Direction component),
component∈{aims, rules and regulations,
specification, control strategy, atlas};
5. Proj Collect (Proj component),
component∈ {{contract, drawings}, {bidding,
construction preparation, construction implementation, engineering assessment, completed acceptance}};
6. proj_static: = {contract, drawings};
7. proj_dynamic: = {bidding, construction
preparation, construction implementation,
8. engineering assessment, completed acceptance};
9. relationship(proj_dynamic);
//Setup the relation among the dynamic factors in the project
10. proj1← {construction preparation, construction implementation,
project assessment, completed acceptance};
11. relationship (proj1, ↔);
//Establish staggered relationships between proj1
12. relationship (proj1, proj_static1);
13. relationship (proj1, proj_static2);
14. relationship (direction,
{proj_dynamic, proj_static1});
15. Cesproject←cesproject;
16. actor←∅; subactori⊂actor;
17. interaction←∅;
18. subinteractioni⊂interaction; //i∈Z
19. Actor Collect (Actor component),
component∈ {regulators, the chief supervision
engineer, the professional supervision engineers, supervisors, data clerks};
20. Interaction Collect (Interaction component),
component∈{development organization,
construction unit, supervision unit, urban construction archives, competent departments, survey unit, design unit, quality supervision unit};
21. project←∅, subprojecti⊂ project;
22. Project Collect (Project component),
component∈ {bidding, construction preparation,
construction implementation, {sub-item, division-item, unit-item}, completed acceptance, {pre-acceptance, project acceptance}, project changes};
23. relationship (Cesproject, subprojecti);
24. relationship (Cesproject, subactori);
25. relationship (Cesproject, subinteractioni);
26. sub1← {bidding, construction preparation, construction
implementation, completed acceptance};
27. sub2← {construction preparation, construction implementation,
completed acceptance};
28. sub3← {sub-item, division-item, unit-item};
sub4← {pre-acceptance, project acceptance};
29. relationship (sub1, sub3, sub4, -);
30. relationship (sub2, sub3, sub4, ↔);
31. control←∅;
33. Control Collect (Control component),
component∈ {quality control, schedule control,
cost control, personnel control, safety control, contract control};
//Generate the control data
34. Relationship (Cesproject, subcontroli);
35. relationship (subcontroli, →);
36. }
37. add(Node) {
38. S=sort(Node);
39. Locate (Node, S);
40. SL←Node; // Add node
41. TestConsistency (Node, Value);
//verify the consistency
42. TestContradiction (Node, Value);
//Verify contradiction
43. TestRedundancy (Node, Value);
//Verify redundancy
44. };
45. delete(Node) {
46. S=sort(Node);
47. Locate (Node, S);
48. L--;
49. TestConsistency (Node, Value);
50. TestContradiction (Node, Value);
51. TestRedundancy (Node, Value);
};// Delete node
End
If a construction minimum unit is used, the definition of guiding factors, control, projects, users, and unit complexity are all O(n), and the establishment of associations between members is also O(n), defining relation between guiding factors and the project factors is O(n2), so the time complexity
of this method is O(n2). Therefore, after the integration, the
five major entities of direction, project, actor, interaction, and control are determined.
Data entity and classification of CES
Analyzed CES data based on data-driven, a unified representation and classification of CES data can be formed, as shown in Figure 4.
In Figure 4, the CES data can be divided into application layer, kernel layer, and template layer. The application layer is composed of actual CES projects. The core layer includes guiding factors, projects, users, interaction units, and control entities. Each entity has its own corresponding subclass, namely {aims ..., atlas}, {bidding, ..., completed acceptance}, {regulators, ..., data clerks}, {development organization, ..., quality supervision unit}, {quality control, ..., contract
control}, and CES project related to each subclass. Each subclass has a corresponding template table that forms the template layer entity. In view of space, only top-level entities are listed.
Through the analysis of data integration ideas in the previous section, a data integration description that combines
the above methods is given, and CES data can be processed to
verify the consistency, contradiction and redundancy of the results.
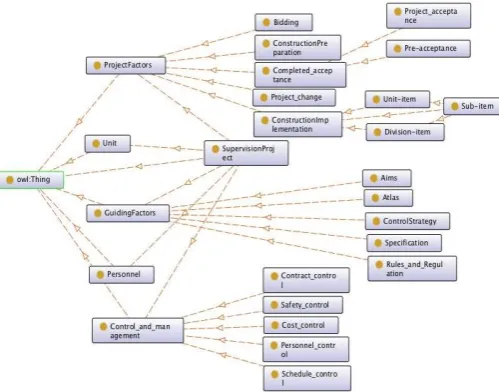
Ontology model of CES
According to the above entities classification and the description of data integration of CES, we roughly obtained the ontology model of CES and the corresponding RDF representation. As shown in Figure 5 and Table 1.
The ontology model of CES shows the supervising entities and their attributes and connections. By obtaining the ontology model of the CES, we can more easily carry out the research work of the CES ontology next.
This paper uses data-driven method to analyze the supervision business process, interactive units and users from the top-level data organization of CES, and then uses four-element TDTM method to extract the themes of supervision data, and finally perform the overall data. Integrate and construct a unified data representation platform for CES to improve supervision management quality and efficiency and optimize service quality.
III. DATA APPLICATION OF CES BASED ON DATA-DRIVEN
A. Data inquiry and reporting of CES
(1) Query of bidding data Project=CES Project;
Subprojecti= {bidding, construction preparation,
construction implementation, engineering assessment, completed acceptance}, subproject1=bidding, and access to
the corresponding template table data of subproject1 through
the established relationship. (2) Query for schedule data
Control=control, subcontroli⊂ {control, direction},
subcontroli= {quality control, schedule control, cost control,
personnel control, safety control, contract control}, subcontrol2=schedule control, and access to subcontrol2 by
establishing the association template table.
E1-E5
G1,G2 H1- H6
F1,F2
A1-A11 B1-B18 C1-C3 D1-D7
Kernel layer Application layer Supervision project
Template layer template
actor control
project
direction interaction
Personnel Unit Atlas
Control strategy Specification
Rules and regulations
Aims Schedule control Personnel control
Safety control
Cost control Quality control
Contract control
Bidding Completed
acceptance
Sub-project
Pre-acceptance
Project acceptance Construction
preparation
Project change
Unit-project
Division-project Construction implementation
Figure 5. Ontology model in CES field (3) Data reporting
Interaction=unit, subinteractioni ⊂ interaction,
subinteractioni = {development organization, construction
unit, supervision unit, urban construction archives, competent departments, survey unit, design unit, quality supervision unit}; such as subinteraction4=urban construction archives, at
the same time, through the establishment of the association, access the corresponding template table.
The integration method of CES data based on this scheme can support all the functions of CES and can solve the problem of resource governance, formativeness, sharing, and openness of CES effectively.
B. Data conversion of CES
For data conversion of CES by data-driven, for the existing system1, it will be converted into a new system2, according to the integration method of this paper, the solution is as follows: According to the previous data integration description, starting from the five major entities: the guiding factors, projects, users, interaction units, and control, combing out the relevant contents of system1 or historical data, and defining such information in system1 according to the entity-to-information correspondence in this article. At the same time, against the relationship between them, establish the relationship of each entity and associate the corresponding template table. Reorganize the information in system1. Then, verify the data from the following three aspects:
①Consistency
In the data maintenance of the system, the historical data of
the existing system1 is backed up in a timely manner, and a log is created. For the problem of data consistency, the conflict processing interface of the old and new systems is provided through the interaction with the user. The new system2, can accept supplementary content that has been repeatedly checked.
② less redundant
In the classification of CES data, a uniform and less redundant unified representation method is selected from the data level. For the entire system to achieve less data redundancy and low coupling.
③ Correlation conflict
In the process of converting and updating the existing data or system1, it is checked repeatedly whether or not there is an associated conflict, such as the timing and dependency defined by the new system2, and a conflict with system1, the timing and dependency of system2 are followed.
As a result, data conversion is completed to form a new CES data entity.
C. The supported CES functions comparison
The CES data platform in this paper can support more functions. Compared with the current mainstream Luban BIM and commonly used PKPM software, as table 2 shown.
Compared with the method in this paper, Luban BIM system does not involve evaluation and some advanced queries ordinarily. PKPM software is powerful, but it is not broad in assessment of the project, related the interaction units, and supervision personnel. And in the advanced query of guiding factors, personnel and unit, this paper has more advantage of a supervision data platform based on data-driven. At the same time, it embodies the consistency, completeness, and less redundancy of data in user management.
IV. CONCLUSION
This paper introduces a data-driven method starting from
the top of CES data, summarizes and analyzes the business
process, interaction units, users, and four-element TDTM of
CES, and the entity of the CES data was determined, a method
for describing the data integration of CES was proposed.
Above this, the data query and reporting, data conversion was
analyzed. The supported functions of the CES data were
compared with other platforms.
Our next step is to study the data integration of CES based
on ontology technology.
TABLE 1.RDFPART OF THE DESCRIPTION OF THE CES ONTOLOGY MODEL
<?xml version="1.0"?>
<rdf:RDF xmlns="http://www.semanticweb.org/chende/ontologies/2018/2/untitled-ontology-31#" xml:base="http://www.semanticweb.org/chende/ontologies/2018/2/untitled-ontology-31" xmlns:rdf="http://www.w3.org/1999/02/22-rdf-syntax-ns#"
xmlns:owl="http://www.w3.org/2002/07/owl#" xmlns:xml="http://www.w3.org/XML/1998/namespace" xmlns:xsd="http://www.w3.org/2001/XMLSchema#" xmlns:rdfs="http://www.w3.org/2000/01/rdf-schema#">
<owl:Ontology rdf:about="http://www.semanticweb.org/chende/ontologies/2018/2/untitled-ontology-31"/> ...
<owl:ObjectProperty rdf:about="http://www.semanticweb.org/chende/ontologies/2018/2/untitled-ontology-31#Contains"> <rdf:type rdf:resource="http://www.w3.org/2002/07/owl#TransitiveProperty"/>
</owl:ObjectProperty>
<owl:ObjectProperty rdf:about="http://www.semanticweb.org/chende/ontologies/2018/2/untitled-ontology-31#Dependency"> <rdf:type rdf:resource="http://www.w3.org/2002/07/owl#TransitiveProperty"/>
</owl:ObjectProperty>
</owl:ObjectProperty>
<owl:ObjectProperty rdf:about="http://www.semanticweb.org/chende/ontologies/2018/2/untitled-ontology-31#Timing"> <rdf:type rdf:resource="http://www.w3.org/2002/07/owl#TransitiveProperty"/>
</owl:ObjectProperty> <owl:ObjectProperty
rdf:about="http://www.semanticweb.org/chende/ontologies/2018/2/untitled-ontology-31#is_generalization_of"/>
<owl:Class rdf:about="http://www.semanticweb.org/chende/ontologies/2018/2/untitled-ontology-31#SupervisionProject"> <rdfs:subClassOf
rdf:resource="http://www.semanticweb.org/chende/ontologies/2018/2/untitled-ontology-31#Control_and_management"/>
<rdfs:subClassOf rdf:resource="http://www.semanticweb.org/chende/ontologies/2018/2/untitled-ontology-31#GuidingFactors"/> <rdfs:subClassOf rdf:resource="http://www.semanticweb.org/chende/ontologies/2018/2/untitled-ontology-31#Personnel"/> <rdfs:subClassOf rdf:resource="http://www.semanticweb.org/chende/ontologies/2018/2/untitled-ontology-31#ProjectFactors"/>
<rdfs:subClassOf rdf:resource="http://www.semanticweb.org/chende/ontologies/2018/2/untitled-ontology-31#Unit"/> </rdfs:subClassOf>
</owl:Class> ...
</rdf:RDF>
TABLE 2.COMPARISON OF SUPPORTED FUNCTION IN DIFFERENT DATA PLATFORM
F unct
ions
Da ta
from B
idd ing
Pro ject
M an
age me
nt P
er son
nel Ma
nag em
en t
C ont
ra ct m
an age
me nt
S che
du le
C on
trol S
af et y C
ont ro
l C
os t C
on trol
Q ual
ity C
on trol
P ro
ject eval
ua tion
un it as
ses sm
en t P er son
nel as
ses sm
en t B
asic dat
a tran sfe
r R
egu lat
or s inqu
iries P
er son
nel inqu
iry gui
din g fa ct
ors inqu
iries fil
e tran sfe
r in un
it
Luban
BIM √ Part Part √ √ √ √ √ √
PKPM √ Part Part √ √ √ √ √ √ √
CES by data-driven
√ √ √ √ √ √ √ √ √ √ √ √ √ √ √ √
REFERENCES
[1] X. H. Zhou. Analysis of Key Points in Supervision of Civil Engineering Construction[J]. Heilongjiang Science & Technology Information, 2017 (14): 244.
[2] X. Y. Li, Q. Chen, L. L. Wang. A Brief Talk on Progress Control of Construction Supervision for Projects[J]. Research on Theory of Urban Construction (Electronic Version), 2015 (2015) 29: 3599-3599. [3] F. X. Xie. Analysis of construction progress control work in construction
project[J]. Construction Engineering Technology and Design, 2017 (2017): 1244-1244.
[4] D. Hardison, M. Behm, M. R. Hallowell, et al. Identifying construction supervisor competencies for effective site safety[J]. Safety science, 2014, 65: 45-53.
[5] G. E. Gurcanli, S. Bilir, M. Sevim. Project based risk assessment and safety cost estimation for residential building construction projects[J]. Safety science, 2015, 80: 1-12.
[6] E. Alreshidi, M. Mourshed, Y. Rezgui. Factors for effective BIM governance[J]. Journal of Building Engineering, 2017, 10: 89-101. [7] S. Chien, T. Chuang, H. S. Yu, et al. Implementation of Cloud
BIM-based Platform Towards High-performance Building Services[J]. Procedia Environmental Sciences, 2017, 38: 436-444.
[8] T. Fröbel, B. Firmenich, C. Koch. Quality assessment of coupled civil engineering applications[J]. Advanced Engineering Informatics, 2011, 25(4): 625-639.
[9] J. Lou, J. Xu, K. Wang. Study on Construction Quality Control of Urban Complex Project Based on BIM[J]. Procedia Engineering, 2017, 174: 668-676.
[10] L. J. Chen, H. A. Luo. BIM-based construction quality management model and its applications[J]. Automation in construction, 2014, 46: 64-73.
[11] M. Niknam, S. Karshenas. A shared ontology approach to semantic representation of BIM data[J]. Automation in Construction, 2017, 80: 22-36.
[12] C. Wen, F. Lu, Z. Bao, et al.: A summary of data-driven micro fault diagnosis methods. Acta Autom. Sin. 42(9), 1285–1299(2016) [13] U. Erlingsson. Data-driven software security: Models and
methods[C]//proceedings of 2016 IEEE 29th Computer Security Foundations Symposium (CSF), 2016: 9-15.
[14] J. Jiang, V. Sekar, I. Stoica, et al. Unleashing the potential of
data-driven networking[C]//Proceedings of 9th International
Conference on Communication Systems & Networks (COMSNET). 2017.