426
International Journal of Pharmaceutical Sciences and Drug Research 2018; 10(6): 426-432
Research Article
ISSN: 0975-248X
CODEN (USA): IJPSPP
Development and Validation of High Performance LCMS Methods
for Estimation of Ebastine and Carebastine in Human Plasma
Sheeba Manoj Nair
1*, Ravi Kumar P
1, Balasubramani Govindan
1, Sanjay
1, Denish Karia
21Semler Research Center Pvt. Ltd, 75 A, 15th Cross, 1st Phase, J.P. Nagar, Bangalore, Karnataka, India 2Department of Chemistry, Patel J. D. K Science College, Borsad,Gujarat, India
Copyright © 2018 Sheeba Manoj Nair et al. This is an open access article distributed under the terms of the Creative Commons Attribution-NonCommercial-ShareAlike 4.0 International License which allows others to remix, tweak, and build upon the work non-commercially, as long as the author is credited and the new creations are licensed under the identical terms.
ABSTRACT
A simple and specific method for simultaneous determination of Ebastine and Carebastine by liquid chromatography-tandem mass spectrometry operated in positive ionization mode was developed and validated.
The column used was a BDS Hypersil C18, 50 mm × 4.6 mm, 5µm with a flow rate of 0.6 mL/min, without
splitter for the chromatographic analysis with flow rate of 0.6 mL/min. Solid phase extraction method was applied. Mass parameters, 496.2/261.0 and 672.2/479.3/261.2 were chosen for analysis. Linearity was established in human plasma covering the concentration range of 0.051 ng/mL to 31.099 ng/mL for Ebastine and 1.013 ng/mL to 1005.451 ng/mL for Carebastine using (Ebastine D6 & Carebastine D6) as internal standards. Different parameters such as linearity, range, precision, accuracy, ruggedness and robustness, limit of detection (LOD) and limit of quantification (LOQ) were used for full validation of the method. The results were found to be acceptable as per the guidelines of International Conference on Harmonization (ICH). The method found to be novel, rapid, linear, precise, accurate, robust and rugged and can be successfully applied for the routine analysis of Ebastine and Carebastine with more sensitivity and covers wider range of quantitation. The method also found to be useful and economical.
Keywords:Ebastine and Carebastine, LCMS, Validation, Solid phase extraction, ICH.
DOI: 10.25004/IJPSDR.2018.100601 Int. J. Pharm. Sci. Drug Res. 2018; 10(6): 426-432
*Corresponding author: Mrs. Sheeba Manoj Nair
Address: Semler Research Center Pvt. Ltd, 75 A, 15th Cross, 1st Phase, J.P. Nagar, Bangalore, Karnataka, India Tel.: +91-9591999644
E-mail: [email protected]
Relevant conflicts of interest/financial disclosures: The authors declare that the research was conducted in the absence of any commercial or financial relationships that could be construed as a potential conflict of interest.
Received: 18 June, 2018; Revised: 27 September, 2018; Accepted: 12 October, 2018; Published: 20 November, 2018
INTRODUCTION
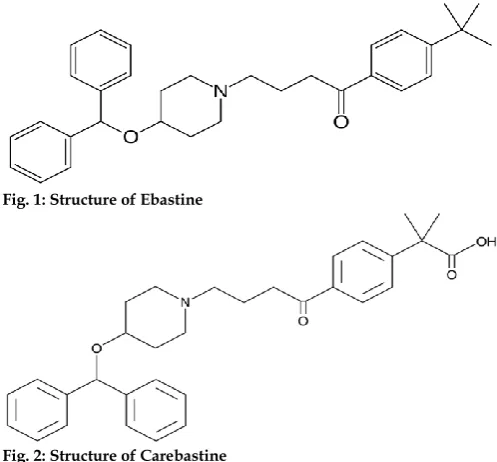
This research paper details the development and validation of LCMS method for estimation of Ebastine and Carebastine in API. The IUPAC name of Ebastine is 4-(4-benzhydryloxy-1-piperidyl)-1-(4-tert-butylphenyl) butan-1-one and IUPAC name of Carebastine is 2-[4-[4-[4-[di(phenyl)methoxy]piperidin-1-yl]butanoyl]phenyl]
-2-methylpropanoic acid. [1] Ebastine is a
H1 antihistamine with low potential for causing
Int. J. Pharm. Sci. Drug Res. November-December, 2018, Vol 10, Issue 6 (426-432) histamine receptors. Upon ingestion, Ebastine
undergoes extensive first-pass metabolism to its active metabolite Carebastine. Ebastine is generic and available globally under many brands. Ebastine molecular formula is C32H39NO2 with average
molecular weight 469.669 g/mol and available in white powder form. Carebastine molecular formula is C32H37NO4 with average molecular weight 499.64
g/mol and available in white powder form. [2-18]
Several methods were reported in literature for the determination of Ebastine and its metabolite and Ebastine with different drugs with varying analytical techniques for its estimation with its active metabolite Carebastine and in combination of drugs like phenylephrine hydrochloride with UV spectrophotometric assay method [3], Ebastine and
Montelukast sodium [1], Reverse Phase high
performance liquid chromatography (RP-HPLC) method [7], and by high performance liquid
chromatography (HPLC) [12, 17] by spectrometric
methods [10] electrochemical determination [14] and gas
chromatography-mass spectrometry (GC-MS), liquid chromatography-tandem mass spectrometry (LC-MS/MS) [2] and ultra performance liquid
chromatography-tandem mass spectrometry (UPLC-MS/MS). [11] The reported method of quantification in
LC-MS/MS was validated over the concentration range of 0.1–10 ng/mL for Ebastine and 0.2–200 ng/ mL for Carebastine in human plasma, respectively. [11]
To meet the requirement of pharmaceutical studies with wider range of dosage forms it was essential to develop more sensitive and a wider quantitation range of method. Linearity for the current method was established in human plasma covering the concentration range 0.051 ng/mL to 31.099 ng/mL for Ebastine and 1.013 ng/mL to 1005.451 ng/mL for Carebastine which was lower than the reported method for Ebastine and covered a wide range for the drug and metabolite upto 31.099 ng/mL for Ebastine and 1005.451 ng/mL for Carebastine. So that it helps to apply the method for a wide range of the dosage with varying strength. The method was validated successfully and applied to bioequivalence study in healthy indicant subjects with required accuracy and precision.
MATERIALS AND METHODS
Materials: Ebastine, Carebastine, Ebastine D6 and
Carebastine D6 (IS) was supplied by Clearsynth labs Pvt. ltd., Mumbai. Methanol was obtained from Finar chemicals Ltd., Ahmadabad, India. The LCMS instrument used here was AB Sciex, API 4000.
Selection of solvent:Solubility of drug was checked in
different solvents and LCMS spectra recorded.
Preparation of stock and working standard solutions for pure drug
Ebastine: Transferred accurately weighed (about 5 mg) Ebastine into a 5 mL volumetric flask and dissolved in methanol. Made up the volume with methanol and
vortexed. Concentration of the resultant solution was about 1000µg/mL.
Carebastine: Transferred accurately weighed (about 5 mg) Carebastine into a 5 mL volumetric flask and dissolved in methanol. Made up the volume using methanol and vortexed. Concentration of the resultant solution was about 1000µg/mL. This solution was further diluted with methanol to get working standard solution of 10µg/mL of drug.
Fig. 1: Structure of Ebastine
Fig. 2: Structure of Carebastine
Preparation of internal standard stock solution
Ebastine D6: Transferred accurately weighed (about 5 mg) Ebastine D6 into a 5 mL volumetric flask and dissolved in methanol and made up the volume using methanol and vortexed. Concentration of the resultant solution was about 1000µg/mL.
Carebastine D6: Transferred accurately weighed (about 5 mg) Carebastine D6 into a 5 mL volumetric flask and dissolved in methanol and made up the volume using same and vortexed. Concentration of the resultant solution was about 1000µg/mL.
Preparation of internal standard working solution Diluted 10µL of Internal Standard-1 stock solution to 5 mL using dilution solvent to get IS dilution approx. 2µg/mL and dilute 10µL of Internal Standard-2 stock solution to 5 mL using dilution solvent get IS dilution approximately 2µg/mL. The 0.25 mL IS dilution 1 and 1.25 mL of IS dilution 2 dilute to 25 mL using dilution solvent (Methanol: Water 50:50 v/v) to get IS dilution of about 20 ng/mL (IS1) and 100 ng/mL (IS2) concentration.
Preparation of sample solutions
Sample solutions of different concentration from 0.051 ng/mL to 31.099 ng/mL for Ebastine and 1.013 ng/mL to 1005.451 ng/mL for Carebastine were prepared from above stock solution and diluted with mobile phase. Preparation of sample solutions
Int. J. Pharm. Sci. Drug Res. November-December, 2018, Vol 10, Issue 6 (426-432) Preparation of Buffer-01 (10mM Ammonium Acetate)
Approximately weighed 0.7712g of ammonium acetate dissolved in 1000 mL of milli-q-water and adjusted solution pH to 9.0 with ammonia and filtered.
Mobile phase: (Buffer-01: Acetonitrile: Formic acid: 30:70:0.1 % v/v)
To 800 mL of acetonitrile added 200 mL of buffer into a 1000 mL of volumetric flask, and then added 1 mL of formic acid mix and sonicated.
Preparation of Dilution solvent (Methanol: water 50:50 % v/v)
Approximately 250 mL of Milli-Q-water into a 500 mL reagent bottle and then added 250 mL of Methanol and sonicated well.
Preparation of sample solutions: Sample solutions of
different concentrations from 0.051 ng/mL to 31.099 ng/mL for Ebastine and 1.013 ng/mL to 1005.451 ng/mL for Carebastine were prepared from above stock solution and diluted with mobile phase.
Extraction Procedure
To an aliquot of 200µL of spiked plasma/subject samples, 50µL of working solution was added and vortexed for 10s. Samples were then loaded on Strata-X-C 33 micro extraction cartridges which were conditions with 1.0 mL methanol, followed by 1.0 mL of water. Washing of samples was done with 2 x1.0 mL of water, followed by drying of cartridges for 2.0 min by applying nitrogen. The elusion of Ebastine and Carebastine and Internal Standards were done using 500µL of mobile phase solution into pre-labeled vials, and 5µL was used for injection in the chromatographic system.
Chromatographic Conditions Injection Volume: 5 µL
Column:BDS Hypersil C18, 50 mm × 4.6 mm, 5µm
Flow rate: 0.6 mL/min, without splitter
Instrumentation
Quantitation was achieved with LCMS-MS detection in positive ion mode using an AB Sciex API- 4000 mass spectrometer equipped with a Turboionspray™ interface consisting of a BDS Hypersil C18 column (50
mm × 4.6 mm, 5μm), a binary LC-20 AD prominence pump an auto sampler and a solvent degasser of Agilent 1200. Solid phase extraction method was used. Detection of the ions was carried out in the multiple reaction monitoring (MRM) mode by monitoring the transition pairs Quadruples Q1 and Q3 were set on unit resolution. Mass parameters, 496.2/261.0 and 672.2/479.3/261.2 were chosen for analysis. The analysis data obtained were processed by Analyst software™ Analyst 1.6.1.
Method Validation
The method was validated to meet the acceptance criteria of industrial guidance for the bioanalytical method validation. [13] The method was validated for
the parameters of Linearity, Concentration Range, Accuracy, Precision (Repeatability, Intermediate Precision), Ruggedness, Matrix Effect, Selectivity,
Robustness, Limit of Detection and Limit of Quantification. [13]
Specificity and Selectivity
Specificity of the method was checked for any interference in eight different lots of human blank plasma including one lipemic and one hemolyzed with the proposed extraction procedure. Selectivity was assessed, by comparing the chromatograms of blank plasma and plasma spiked with lowest standard from eight different sources including lipemic and hemolyzed (or donors). Cross analyte effect (cross talk) was evaluated by spiking the highest concentration individually and monitored all Multiple Reaction Monitoring (MRM) channels for interferences.
Precision and Accuracy
All validation experiments were carried out at five (LOQQC, LQC, MQC-1, MQC-2 and HQC) QC levels. For the determining of intraday accuracy and precision, a replicate (n=6) analysis of plasma samples were performed on the same day. The inter-day accuracy & precision were assessed by analysis of three batches on different days. The precision was expressed as Relative Standard Deviation (RSD %) and accuracy as Relative Error (RE %).
Calibration Curve
Plotting of the peak area ratio of the transition pair of analytes to that of IS against the nominal concentration of calibration standards was done to obtain calibration curves. Blank sample and zero samples were run with each calibration curve. The acceptance criterion for each back-calculated standard concentration was + 15% deviation from the nominal value except at LLOQ, which was set at + 20%.
Recovery and Matrix effect
The recovery of Ebastine and Carebastine and ISs were determined by comparing the responses of the analytes extracted from replicate QC samples (n = 6) with the response of analytes from post extracted plasma standard sample at equivalent concentration. Recovery was determined at low, mid and high quality control concentrations, whereas the recovery of the ISs was determined at a single concentration. The matrix of plasma constituents over the ionization of analytes and IS was determined by comparing the responses of the post-extracted plasma standard QC samples (n = 6) with the response of analytes from neat samples at equivalent concentrations. Matrix effect was determined at two levels with six different sources of plasma (out of eight, six were normal K2EDTA plasma,
one was lipemic and one was hemolyzed with the same anticoagulant) (LQC and HQC) for Ebastine and Carebastine and for ISs. Dilution integrity was performed to extend the upper concentration limit with acceptable precision & accuracy.
Recovery and Matrix Effect
Int. J. Pharm. Sci. Drug Res. November-December, 2018, Vol 10, Issue 6 (426-432) standard sample at equivalent concentrations. [13]
Recovery was determined at low, mid and high quality control concentrations, whereas the recovery of the ISs was determined at a single concentration. The matrix of plasma constituents over the ionization of analytes and IS was determined by comparing the responses of the post-extracted plasma standard QC samples (n = 6) with the response of analytes from neat samples at equivalent concentrations. Matrix effect was determined at two levels with six different source of plasma (out of eight six were normal plasma, one was lipemic and one was hemolyzed with the same anticoagulant) (LQC and HQC) for Ebastine, Carebastine and for ISs. Dilution integrity was performed to extend the upper concentration limit with acceptable precision & accuracy.
Stabilities
Stability of Ebastine and Carebastine and IS (Ebastine D6 and Carebastine D6) stock solutions were evaluated after storage at room temperature for 119 hours 06 & 119 hours 32 minutes. Mean peak area ratios for stability solutions were compared to mean peak area ratios determined from freshly prepared solution Other stabilities were also determined in matrix samples such as Freeze thaw, bench top stability at room temperature & refrigerator, wet extract stabilities and long term stabilities. The areas of stability samples and freshly prepared samples were compared to determine mean % nominal concentration during stability period.
Table 1: Summary of the Experimental Parameters of Ebastine in K2EDTA Human Plasma
Experimental Parameters Results
Analyte Ebastine Biological Matrix K2EDTA Human Plasma
Specificity and Selectivity % CV 7.06% Analytical range 0.051 to 31.099 ng/mL Sensitivity: Precision, Accuracy 13.11%, 89.54%
Recovery Ebastine % CV , % Recovery
Ebastine D6 % CV, % Recovery 10.72%, 58.96% 3.32%, 73.44%
Table 2: Summary of the Experimental Parameters of Carebastine in K2EDTA Human Plasma
Experimental Parameters Results
Analyte Carebastine Biological Matrix K2EDTA Human Plasma
Specificity and Selectivity % CV 3.68% Analytical range 1.013 to 1005.451 ng/mL Sensitivity: Precision , Accuracy 8.65%, 105.22%
Recovery
Carebastine % CV, % Recovery
Carebastine D6 % CV, % Recovery 8.76%, 77.33% 2.56%, 77.36%
RESULTS AND DISCUSSION LC-MS/MS Method Development
Though currently there are several methods available to determine Ebastine and Carbastine with various techniques, the aim of the present work was to develop a highly sensitive and rapid method to meet the requirement of wide range of dosage forms in pharmacokinetic studies in healthy humans. Multiple existing chromatographic methods were Ebastine in
combination of different drugs and couple of methods with its active metabolites. In this method we developed Ebastine and its active metabolite Carebastine in simultaneous estimation with more sensitive detection than reported for Ebastine and covered wider range for both Ebastine and Carbastine using LC-MS/MS instrumentation and solid phase extraction (SPE) employing a deuterated IS, Which helped in controlling any variability during extraction and analyte ionization.
To meet the requirement of pharmaceutical studies with wider range of dosage forms it is essential to develop more sensitive and a wider quantitation range of method. Linearity for the current method was established in human plasma covering the concentration range 0.051 ng/mL to 31.099 ng/mL for Ebastine and 1.013 ng/mL to 1005.451 ng/mL for Carebastine. Which is lower than the reported method for Ebastine and covered a wide range for the drug and metabolite upto 31.099 ng/mL for Ebastine and 1005.451 ng/mL for Carebastine. So that it helps to apply the method for a wide range of the dosage with varying strength. The method was validated successfully and applied to bioequivalence study in healthy indicant subjects with required accuracy and precision.
Mass spectrometer parameters were optimized for Ebastine and Carebastine in the positive ESI mode. The Q1 MS spectra of the analyte and IS showed abundant protonated molecular ion at Mass parameters, 496.2/261.0 and 672.2/479.3/261.2. In this method we have chosen analysis by solid phase extraction method which is economical and easy to process.
Specificity and Selectivity
The retention times of Ebastine & Carebastine were found to be 3.61 & 1.71 minutes respectively. The overall chromatographic run time is 6.00 minutes. During the validation, blank K2EDTA plasma samples
were evaluated and all plasma lots were found to be satisfactory that there were no interfering peaks in the blank plasma at the retention times of Ebastine & Carebastine or internal standard as seen in the chromatograms. Representative Calibration Curve for Ebastine & Carebastine in K2EDTA human plasma are
shown in Figure 1 and 2. Linearity
Linearity was established by preparing an eight-point standard calibration curve in K2EDTA human plasma
covering the concentration range 0.051 ng/mL to 31.099 ng/mL for Ebastine and 1.013 ng/mL to 1005.451 ng/mL for Carebastine using (Ebastine D6 & Carebastine D6) as internal standards.
Int. J. Pharm. Sci. Drug Res. November-December, 2018, Vol 10, Issue 6 (426-432) Fig. 3: Representative Calibration Curve for Ebastine in Human Plasma (K2EDTA)
Fig. 4: Representative Calibration Curve for Carebastine in Human Plasma (K2EDTA)
Int. J. Pharm. Sci. Drug Res. November-December, 2018, Vol 10, Issue 6 (426-432) Fig. 6: Chromatogram of the LLOQ Calibration Curve Standard for Carebastine with Internal Standard (Carebastine D6)
Fig. 7: Chromatographic separation of Ebastine, Carebastine, Ebastine D6 and carebastine D6 (Internal Standards)
Precision and Accuracy
The results for intra-day and inter-day precision and accuracy for Ebastine and Carebastine in plasma quality control samples are summarized in Table 1 and 2. The intra-day precision found to be 13.11% for Ebastine and 8.65% for Carebastine and accuracy was 89.54% for Ebastine and 105.22% for Carebastine. Recovery
Recovery of Ebastine and Carebastine from K2EDTA
human plasma was determined by comparing peak areas of extracted QCL, QCM and QCH samples with
peak areas determined from freshly prepared unextracted (aqueous) samples prepared at similar concentrations in mobile phase. Mean overall % recovery was 58.96% and overall %CV was 10.72% for Ebastine and % recovery was 77.33% and %CV was 8.76% for Carebastine and % recovery was 73.44% and %CV was 3.32% for IS (Ebastine D6) and 77.36% and %CV was 2.56% for IS (Carebastine D6).
Matrix Effect
Int. J. Pharm. Sci. Drug Res. November-December, 2018, Vol 10, Issue 6 (426-432) response of post-spiked concentrations/ response of
neat concentrations) obtained for Ebastine and Carebastine and ISs. There were no significant matrix effects observed for any of the analytes or the ISs. Stability
The stability of the analytes in human plasma under different temperature and timing conditions was evaluated. QC samples were subjected to long-term storage conditions at room temperature and to freeze– thaw stability studies. All the stability studies were conducted at two concentration levels of low QC and high QC values for Ebastine and Carebastine with six determinations for each. For process stability, the results indicated that the difference in the back-calculated concentration from time 0 to 119 h allowed us to conclude that processed samples are stable at least for 119 h at room temperature. Freeze and thaw stability results indicated that the repeated freeze and thawing (five cycles) did not affect the stability of Ebastine and Carebastine.
A sensitive and selective LC-MS/MS method to simultaneously quantitate Ebastine and Carebastine in K2EDTA in human plasma over the concentration range
0.051 ng/mL to 31.099 ng/mL for Ebastine and 1.013 ng/mL to 1005.451 ng/mL for Carebastine was successfully validated. This method is suitable for subject sample analysis and incurred sample analysis to support bioequivalence/bioavailability and/or pharmacokinetic studies involving formulations of Ebastine and Carebastine.
REFERENCES
1. pubchem.ncbi.nlm.nih.gov/compound/ebastine#section=2D -Structure
2. Savsani JJ, Goti PP, Patel PB. Development and validation of simultaneous equation method for estimation of ebastine and montelukast sodium in combined tablet dosage form. Der Pharmacia Sinica. 2012; 3(6): 690-698.
3. Kang W, Liu KH, Ryu JY, Shin JG. Simultaneous determination of Ebastine and its three metabolites in plasma using liquid Chromatography-tandem mass spectrometry. J Chromatogr B Analyt Technol Biomed Life Sci. 2004; 813(1-2): 75-80.
4. Soni LK, Narsinghani T, Charu Saxena C. Development and validation of UVSpectrophotometric assay protocol for simultaneous estimation of Ebastine and Phenylephrine Hydrochloride in tablet dosage form using simultaneous equation method. International Journal of ChemTech Research. 2011; 3(4): 1918-1925.
5. El-Kommos ME, El-Gizawy SM, Atia NN, Hosny NM. Analysis for commonly prescribed non-sedating antihistamines. Analytical Chemistry Research. 2015; 3: 1-12. 6. Peyri J, Vidal J, Marrón J, et al (1991). Ebastine in chronic
urticaria: a double-blind placebo Controlled study. J Dermatol Treat. 1991; 2(2):51-53.
7. Hajare RA, Tated AG, Gadbail PA, Ghan FA, Kayal SD. Method Development and Validation for Simultaneous Determination Ebastine and Phenylephrine Hydrochoride in Tablet Formulation by RP-HPLC. IJPRD. 2011; 3(7): 214-220. 8. Wagh RS, Hajare RA, Tated A, Chandewar AV. Absorption
Correction Method and Simultaneous Equation Method for the Simultaneous Estimation of Ebastine and Phenylephrine Hydrochloride in Bulk and In-combined Tablet Dosage Form. IJRPC. 2011; 1(4):812-819.
9. Salvà M, Carreño B, Pintos M, et al. Phase I. single dose, open label, randomized, Crossover bioequivalence studies of Ebastine 10 mg and 20 mg regular tablets vs. 10 and 20 mg fast dissolving tablets in healthy male volunteers. JIACI. 2004; 14(4): S5.
10. Shantha A. Spectrophotometric methods for the Determination of Ebastine in tablets. Indian Drugs. 2003; 40(10):149-151.
11. Feng S, Jiang J, Wang P, Liu D, Hu P. Simultaneous Determination of Ebastine and Its Active Metabolite (Carebastine) in Human Plasma Using LC–MS–MS. Chromatographia. 2009; 70:1417
12. Shirwaikar A. Determination of Ebastine in pharmaceutical Formulations by HPLC. Indian Journal of Pharmaceutical Sciences. 2008; 70(3):403-406
13. September 2013; Draft Guidance for Industry; Bioanalytical Method Validation U.S. Department of Health and Human Services; Food and Drug Administration; Center for Drug Evaluation and Research (CDER); Center for Veterinary Medicine (CVM); Bio pharmaceutics; Revision 1
14. Sreedhar NY, Sreenivasulu A, Sunil Kumar M, Nagaraju M. Electrochemical Determination of Ebastine in Tablet Dosage Forms at Hanging Mercury Drop Electrode. International Journal of PharmTech Research. 2012; 4(3):1303-1308. 15. Tagawa M, Kano M, Okamura N, et al. Neuroimaging of
histamine H1-receptor occupancy in human brain by positron emission tomography (PET): a comparative study of ebastine, a second-generation antihistamine, and (+)-clorphrniramine, a classical antihistamine. British Journal of Clinical Pharmacology. 2001; 52:501-509.
16. Vaidhyalingam V. Charge Transfer Complex method for the estimation of Ebastine in tablets. Indian Drugs. 2003; 40(7):390-392
17. Vaidhyalingam V. Development and Validation of HPLC and HPTLC methods for the Quantification of Ebastine in tablets. Indian Drugs.2004; 41(3):149-151.
18. Van Cauwenberge P, de Belder T, Sys L. A review of the second-generation antihistamine ebastine for the treatment of allergic disorders. Expert opinion on pharmacotherapy. 2004; 5(8):1807-13.
HOW TO CITE THIS ARTICLE: Nair SM, Ravi Kumar P, Govindan B, Sanjay, Karia D. Development and
Validation of High Performance LCMS Methods for Estimation of Ebastine and Carebastine in Human Plasma.