Abstract—Thread inspection is a very important step in modern industrial inspection and is also the key to guaranteeing product quality. However, the traditional contact measurement method is time-consuming and expensive. This study developed an automatic noncontact measurement system that can be used to on-machine measure thread dimension based on machine vision for computer numerical control (CNC) lathe machine tools. During the measurement process, backlighting was used to obtain the image of a thread profile. Then, a machine vision algorithm was developed to analyze the obtained thread images in order to capture the thread profile coordinate points and compute the dimensions of the thread pitch and thread depth. The experimental results showed that the maximum difference between the measured dimensions and real dimensions is around 6 µm (1 pixel resolution), thus verifying the feasibility and accuracy of the on-machine external thread measurement system developed in this study.
Index Terms—Machine vision, external thread, on-machine measurement, CNC lathe machine tools
I. INTRODUCTION
ngineering technology changes rapidly, and most manufacturers are devoted to improving product quality and production efficiency. Thus, product dimension measurement is an important part of the production flow, especially with regard to the detection of thread dimensions. Presently, the thread measurement tools used in industry such as the three-wire thread gauge, screw-thread pitch gauge, and screw-thread micrometer are mostly contact measurement tools; moreover, their measurement scope and measurement methods are not suitable for smaller threads.
Manual measurement is still required and cannot be conducted in a fully automated manner. The instruments and methods adopted in thread measurement also vary with different detected items. For instance, the detected items of depth, pitch, major diameter, minor diameter, and pitch diameter generally use different measurement instruments and methods. As it is necessary to move the detected object to different detection instruments, measurement time will
Manuscript received December 8, 2018. This work was supported in part by the Ministry of Science and Technology, Taiwan, R.O.C., under Contract MOST107-2221-E-027-108 and MOST107-2218-E-009-059.
Y. C. Lee is with the Institute of Mechatronic Engineering, National Taipei University of Technology, Taipei 10608, Taiwan, R.O.C. (e-mail: [email protected]).
S. S. Yeh is with the Department of Mechanical Engineering, National Taipei University of Technology, Taipei 10608, Taiwan, R.O.C. (phone: +886-2-27712171; fax: +886-2-27317191; e-mail: [email protected]).
greatly increase and manual detection errors can easily result. Therefore, when a computer vision system is used for noncontact thread measurement, it can measure multiple items at the same time and measure smaller threads. In this case, it will not be limited by the size of the measurement instrument. In-situ measurement can also be realized during the production process. This reduces the measurement time and manual detection error. Therefore, this study develops a noncontact thread dimension measurement method that is suitable for the production line to on-machine measure thread dimensions in a rapid and automated approach.
Image recognition and dimension measurements are the two major development directions of machine vision. Most studies have focused on the application of machine vision to offline thread measurement and detection and rarely discussed online thread measurement. Therefore, in addition to referring to the literature related to the offline detection of the external thread image, this study also notes the detection methods of external thread in other fields. There are three main types of literature related to thread measurement: offline non-image thread dimension measurement, offline image thread dimension measurement, and on-machine image thread dimension measurement.
Lin et al. proposed laser triangulation, which is used to measure the pitch diameter of the internal thread of a nut in real time [1]. Lavrinov and Khorkin developed a signal processing method of a laser triangulation 2D scanner that can be used to measure a high-quality thread pitch [2]. Tong et al. developed a new laser measurement system that measures the parameters of the internal thread [3]. Lin et al. designed a laser detection system and characterization analysis method [4]. Huang et al. developed a new laser measurement method that measures the ballscrew thread profile [5].
Zhao et al. put forward research into the metrology of a conical thread gauge [6]. Maciel et al. discussed the characteristics of titanium alloy machining and the formation of an external thread [7]. Leun and Nikolaeva noted that cutting and monitoring tools can directly measure the mean thread diameter of thread grinding [8, 9]. Wu et al. proposed a thread measurement algorithm and software development [10]. Sheng et al. presented a compensation method where profile scanning was used to measure the thread pitch diameter [11]. Kosarevsky and Latypov proposed a thread detection method of computed tomography 3D density fields [12]. Hong et al. set up a noncontact examination of an internal thread of machined parts [13]. Cheng et al. proposed an enhanced high-precision and noncontact system that
Using Machine Vision to Develop an
On-Machine Thread Measurement System for
Computer Numerical Control Lathe Machines
Yi-Cheng Lee and Syh-Shiuh Yeh,
Member, IAENG
measures the geometric dimensioning of irregular shapes [14].
Shchurov used the cloud of points coming from CMM to calculate the virtual pitch thread diameter [15]. Merkač and Ačko proposed a thread gauge calibration method for industrial applications [16]. Kosarevsky and Latypov developed an algorithm for detecting screw threads in planar point clouds [17]. Gadelmawla developed a new measurement system that automatically measured and examined parallel screw threads [18]. Hunsicker et al. proposed an automated vision detection and measurement system of external threads [19]. Corley et al. proposed a method of profile characterization for the direct contact of thread surfaces [20].
Based on the vision method, Senthilnathan et al. proposed an orientation-invariant measurement of metric screw thread parameters [21]. Gadelmawla developed computer vision algorithms to measure and examine external thread [22]. Chao and Zhang proposed an intelligent detection method to measure small-pitch thread parameters that can achieve a rapid, noncontact, and accurate measurement of thread parameters. They also introduced a process of thread image acquisition and data processing, and then carried out real-time measurements to verify the feasibility of this method [23].
Zhao et al. proposed a noncontact measurement system used for ballscrew thread profiles, where a CCD camera was used to measure the most common features of the profile and the ballscrew under different dimensions and lengths. In the end, four ballscrews were tested and evaluated to verify the accuracy of the measurement system [24].
Although existing methods and systems can provide high-precision thread detection results, their designs often have the following problems in practical application: ● A visual detection system in a computer numerical control
(CNC) lathe machine tool cannot be installed according to the actual machining environment; therefore, there exist great limitations in the applications of on-machine automatic detection.
● The camera installation does not consider actual restrictions in applications and therefore will cause operational restrictions in the CNC lathe machine tool in addition to a complicated installation method and positioning.
● In terms of the image-capturing results, the thread profile cannot be observed or measured effectively when the machined threads have oil stains and chips; therefore, in this case, the captured images cannot be used to obtain any effective thread features.
Therefore, this study considered the practical conditions in applications of CNC lathe machine tools and then adopted a machine vision method with a light source design, camera image capturing, and thread dimension computation to develop an on-machine thread dimension measurement system.
This study developed an on-machine detection system that integrates a 6-DOF manipulator into a CNC lathe machine tool to improve the degree of freedom of measurement by coordinating the manipulator. Microsoft C# and LabVIEW were used to program algorithms and to control the external hardware. The captured images by a vision module were used
to analyze and calculate the thread dimensions of a workpiece.
Furthermore, this study employed the Taguchi method to design an optimal combination of image processing parameters and compared the dimensions measured by the thread dimension measurement system developed herein with the real dimensions measured by a 3D microscope. According to multiple detection and experiment results, the maximum average error was 3.162 µm (standard deviation was 0.310 µm) and the minimum was 0.150 µm (standard deviation was 0.189 µm), thus verifying the feasibility and stability of the on-machine thread dimension measurement system developed in this study.
II. EXPERIMENTAL SETUP
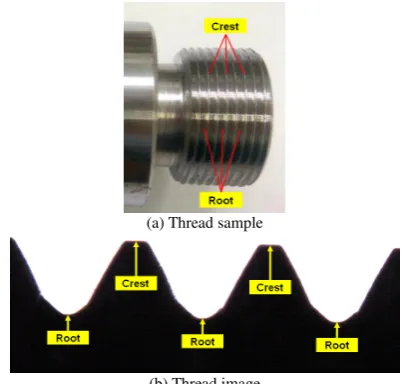
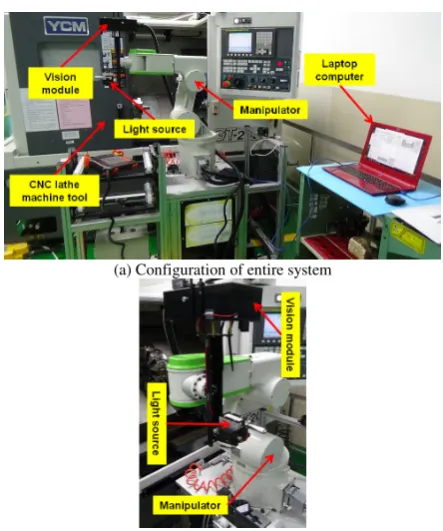
[image:2.595.323.526.349.466.2]The thread sample of the workpiece measured in this study is shown in Fig. 1, and the experimental result involved the measurement aimed at the front-end thread of this sample. The relationship between the crest and root of the actual sample thread and thread image is shown in Fig. 2. The measurement system is shown in Fig. 3 and includes a vision module, light source, laptop computer, manipulator, and CNC lathe machine tool.
Fig. 1 Workpiece sample and tread to be measured in this study.
The manipulator motion includes an external standby position, internal workpiece position, and path position. When the measurement system is operating, it is necessary to enable the manipulator to move into the CNC machine tool. Therefore, it is necessary to adjust the path positions during the movement to avoid collisions between the manipulator and the CNC machine tool.
(a) Thread sample
(b) Thread image
[image:2.595.324.527.582.774.2](a) Configuration of entire system
(b) Setup of vision module on manipulator
Fig. 3. Experimental setup of on-machine external thread measurement system.
[image:3.595.57.279.54.320.2]Fig. 4 shows a photograph of when the manipulator and vision module enter the lathe machine tool during the actual measurement. Here, the measurement system designed by this study can be used for detection when the workpiece is still on a spindle. The vision module adopts a color industrial camera to capture the thread image at a resolution of 1280 × 720, and 25 frames of thread images can be captured in 1 second. After the calculation of unit conversion, each pixel of the image captured is approximately equal to the actual dimensions of 6.224 µm.
Fig. 4. Experimental setup of system during actual measurement.
III. MEASUREMENT OF THREAD DIMENSIONS
The procedure to measure the thread dimensions is shown in Fig. 5. The measurement system in this study adopts two kinds of software: one uses LabVIEW in combination with myRIO to control the external hardware, and the other one uses Microsoft Visual Studio C# in combination with the EmguCV library package to program the algorithm. The nomenclatures of each thread part and basic specification are shown in Fig. 6 and Fig. 7, respectively. The thread dimension measurement in this study measures the P and H1 values in Fig. 7.
The procedure of the thread dimension measurement
includes image preprocessing, image segmentation, image analysis, and dimension calculation. The thread dimension measurement started with spindle positioning to fix the position of the workpiece to be measured; then, the workpiece surface was cleaned to remove oil stains and chips. The vision module and light source designed by this study were moved to the measurement position through a manipulator; after that, light source adjustment and image capturing were conducted.
[image:3.595.328.525.286.510.2]Aimed at capturing the image, the measurement system trimmed the region of interest (ROI) of the image; then, the image’s horizontal correction, smooth filtering, and binarization were processed sequentially. The image’s thread edge detection was performed to obtain the thread profile. The thread profile was then divided into four parts, and the feature points required by the calculation of thread dimension were determined. According to the obtained feature points, the thread dimensions can be calculated to obtain the measurement dimension result.
[image:3.595.319.533.293.764.2]Fig. 5. Flow chart of thread dimension measurement.
Fig. 6. Nomenclature of each thread part.
[image:3.595.62.278.489.608.2] [image:3.595.314.540.534.766.2]For image processing, image capturing was performed according to the features of the workpiece thread profile. In order to enhance the contrast ratio between the thread profile and background in the image, the lighting method of backward parallel light source was adopted in combination with a high-intensity light source to obtain a clear and sharp thread profile so that the subsequent image processing and analysis could be achieved rapidly and easily. After the image capturing process, the ROI was trimmed according to the thread profile features.
[image:4.595.49.288.369.452.2]For any ROI that is not trimmed, the difficulty in subsequent binarization processing will increase and thus further affect the thread dimension calculation result. After the ROI was trimmed, the image’s horizontal correction was performed. If the image is not horizontal but shows a rotation offset, a dimension calculation error will easily arise owing to the incorrect position of the feature points during the process of calculating the thread dimensions. In order to design the method for the image’s horizontal correction in this study, the first crest coordinate point and third crest coordinate point in Fig. 8 were selected, and then the two coordinate points were connected to form a crest line. The angle between the crest line and the horizontal line was calculated, and then the image was rotated to make it become horizontal.
Fig. 8. Crests and roots of captured thread image.
After the image’s horizontal correction, Gaussian filtering was used to filter and reduce the noise and interference in the image. The specific operation of Gaussian filtering uses a filter kernel and a captured image to conduct convolution. The size of the filter kernel is usually set as 3 × 3, 5 × 5, and 7 × 7; therefore, this study considered the three sizes to carry out an experimental study to determine the most suitable size of the filter kernel. After the Gaussian filtering, image binarization processing was performed.
This study adopted the Otsu threshold selection method to determine a suitable thresholding value [26]. However, the disadvantage of the Otsu threshold selection method is that a poor binarization effect will arise when there is no obvious difference in the grayscale value histogram of the captured image. Therefore, this study employed the Otsu threshold selection method to design the initial thresholding value and then used six thresholding values of Otsu-40, Otsu-20, Otsu, Otsu+20, Otsu+40, and Otsu+60 to perform an experimental study to determine the most suitable binarization thresholding value.
This study adopted Canny edge detection [27] to detect the profile edge of the thread image. To use the Canny edge detection method, the adjustable calculation parameters are the maximum threshold value and minimum threshold value. If a pixel’s intensity gradient is greater than the maximum threshold value, then this pixel will be regarded as an edge
pixel. If a pixel’s intensity gradient is smaller than the minimum threshold value, then this pixel will be regarded as a non-edge pixel.
However, if a pixel’s intensity gradient lies between the maximum threshold value and minimum threshold value, then it will be classified into an edge pixel or non-edge pixel according to the connectivity of the edge pixel. The proportions of the maximum threshold value and minimum threshold value usually lie between 2:1 and 3:1. In this study, the maximum threshold value and minimum threshold value adopted by Canny edge detection were, respectively, 600 and 300.
After the image’s thread edge detection was calculated, the obtained thread edge was used to realize the thread profile. Then, the obtained specific profile information could be used to determine the positions of the feature points. To calculate the thread depth, the positions of feature points with the minimum Y value and maximum Y value were determined in the thread profile, and then the vertical distance between the positions of the feature points was calculated. Thus, the thread depth dimensions can be determined.
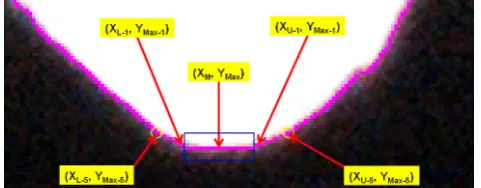
To calculate the thread pitch, the feature points with the maximum Y value (YMax) in the thread profile were determined as shown in Fig. 9. After the average value of the X coordinates of all feature points with the maximum Y value (XM) was calculated, the position of the feature points (XM,YMax) could be obtained. Then, the distance in the position of the feature points between the adjacent thread profile (XM,YMax) was calculated to be the thread pitch dimension. This study also set the feature points of the Y-m value (YMax-m), as shown in Fig. 9.
Similarly, after the average value of the X coordinates of all feature points with the maximum Y-m value (XM-m) was calculated, the position of the feature points (XM-m,YMax-m) could be obtained. Then, the distance in the position of the feature points between the adjacent thread profile (XM-m,YMax-m) was calculated to be the thread pitch dimension. As shown in Fig. 9, when m = 5, the feature points of the Y-5 value are divided into two parts. Therefore, it is necessary to calculate the average value of the upper feature points (XU-5) as well as the average value of the lower feature points (XL-5). Then, the average value of XU-5 and XL-5 was calculated to be the average value of the X coordinates (XM-5).
Accordingly, m is a variable that affects the calculation result of the thread dimensions, and therefore an experimental study was performed to determine the most suitable m value.
Fig. 9. Distribution of positions of feature points in calculation of thread pitch dimensions.
IV. EXPERIMENTAL RESULTS
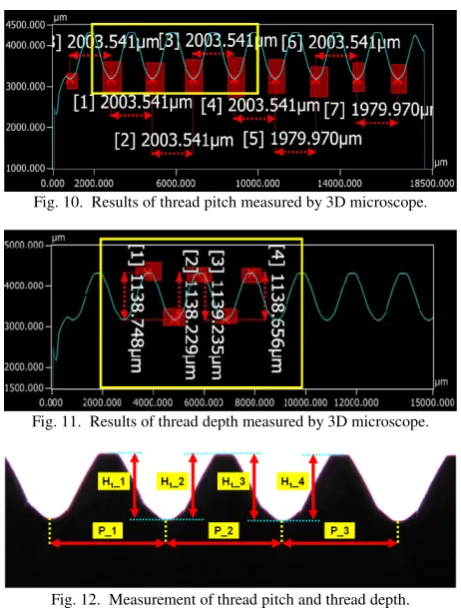
[image:4.595.307.548.631.725.2]optimal image processing parameters; then, the captured image was processed and the thread dimensions were calculated according to the obtained optimal parameters. The calculated thread dimensions and the real dimensions measured by a 3D microscope were compared to verify the feasibility and efficiency of the on-machine thread dimension measurement system developed in this study. Fig. 10 and Fig. 11 show, respectively, the results of the thread pitch and thread depth measured by the 3D microscope.
Fig. 12 shows the thread pitch (P_1, P_2, P_3) and thread depth (H1_1, H1_2, H1_3, H1_4) measured by the on-machine thread dimension measurement system. The Taguchi method was used to determine the optimal parameters; here, the control factors are the binarization thresholding value, the kernel size of the Gaussian filtering, and the m value used to determine the position of the feature points. The levels of the binarization thresholding value are Otsu-40, Otsu-20, Otsu, Otsu+20, Otsu+40, and Otsu+60. The levels of the kernel size are 3, 5, and 7.
[image:5.595.53.284.339.644.2]The levels of the m value are 3, 4, and 5. The Taguchi method was used to obtain the following optimal parameters: the binarization thresholding value is Otsu-20, the kernel size is 3, and the m value is 3.
Fig. 10. Results of thread pitch measured by 3D microscope.
Fig. 11. Results of thread depth measured by 3D microscope.
Fig. 12. Measurement of thread pitch and thread depth.
Table I shows an error comparison between the measured dimensions from the developed on-machine thread dimension measurement system and the real dimensions measured by the 3D microscope. The calculation of the measurement error is shown in (1); here, Meassystem denotes the results of the
developed on-machine thread dimension measurement system,
and Measmicroscope denotes the results of the 3D microscope. In
terms of calculating the S/N ratio, the experimental results
P_j i
e and H_k i
1
e were calculated according to (2); here, P_j i
e and
_k H i
1
e respectively denote the error of the jth thread pitch and
the error of the kth thread depth in the ith experiment. Table I notes that the S/N ratio of the 10 experimental results is -2.794. The maximum average error is 3.162 µm of H1_2 (standard deviation 0.310 µm), and the minimum average error is 0.150 µm of P_2 (standard deviation 0.189
µm). According to the experimental results, the on-machine thread dimension measurement system developed in this study demonstrates high accuracy and stability.
microscope
system-Meas
Meas
e= (1)
+ +
⋅ −
=
∑
∑
∑
= = =
10
1 i
2 4
1 k
_k H i 3
1 j
P_j i
10 e e
4 3
1 10
1 log 10
SN 1 (2)
TABLEI
RESULTS OF EXPERIMENTAL MEASUREMENT ERRORS (UNIT:ΜM) Experiment P_1 P_2 P_3 H1_1 H1_2 H1_3 H1_4
No. 1 1.170 0.120 2.140 2.460 3.050 0.190 0.260 No. 2 1.460 0.090 2.460 2.650 2.930 0.190 0.390 No. 3 0.890 0.60 2.090 2.600 2.790 0.190 0.390 No. 4 1.030 0.160 2.330 2.650 2.670 0.190 0.390 No. 5 1.210 0.040 2.020 1.930 3.570 0.190 0.390 No. 6 1.360 0.060 2.190 2.240 3.270 0.190 0.390 No. 7 1.090 0.360 2.020 2.290 3.350 0.190 0.390 No. 8 1.160 0.010 2.510 2.450 3.050 0.190 0.390 No. 9 1.110 0.040 2.250 1.950 3.500 0.190 0.390 No. 10 1.110 0.020 2.710 2.200 3.440 0.190 0.390 Average
value 1.159 0.150 2.272 2.342 3.162 0.190 0.377 Standard
deviation 0.161 0.189 0.229 0.266 0.310 0.000 0.041
S/N ratio -2.794
[image:5.595.56.285.345.434.2]This study measured three other workpiece samples. Fig. 13 and Table II, respectively, show photographs of the samples and the measurement results. In Table II, the difference in the average value denotes the maximum value of the differences between the measurement values and the average value. Moreover, the ratio of the difference in the average value denotes the ratio value of the difference in the average value divided by the average value.
Fig. 13. Photograph of workpiece samples.
According to the measurement results in Table II, the minimum value of the difference in the average value is 4.430
[image:5.595.321.531.524.659.2]TABLEII
MEASUREMENT RESULTS OF WORKPIECE SAMPLES (UNIT:ΜM)
Measurement P_1 P_2 P_3 H1_1 H1_2 H1_3 H1_4
Workpiece
#1 2008.52 2007.55 2008.59 1250.98 1250.92 1245.99 1245.58 Workpiece
#2 2005.37 2014.97 2015.86 1259.45 1260.75 1260.95 1257.30 Workpiece
#3 1997.57 2003.87 2014.61 1236.89 1238.16 1238.64 1239.32 Average
value 2003.82 2008.79 2013.02 1249.11 1249.94 1248.53 1247.40 DAV*a 6.25 6.18 4.43 12.22 11.78 12.42 9.90 RDAV*b 0.31% 0.31% 0.22% 0.98% 0.94% 0.99% 0.79% *a DAV: Difference in the average value
*b RDAV: Ratio of the difference in the average value
V. CONCLUSION
In order to develop the on-machine thread dimension measurement system, this study used the Microsoft Visual Studio C# and EmguCV library package to program computing algorithms and image processing methods. The thread dimension measurement procedure includes image preprocessing, image segmentation, image analysis, and dimension calculations. To capture the thread image, the measurement system started with spindle positioning, and then the surface of the workpiece to be measured was cleaned.
After that, the vision module and light source were moved to the measurement position through a manipulator, and finally a light source adjustment and image capturing were conducted. In terms of image processing, the measurement system trimmed the ROI of the thread image, and then the horizontal correction, smooth filtering, and binarization were processed sequentially. Finally, thread edge detection was performed to obtain the thread profile so that the thread pitch and thread depth could be precisely calculated.
The experimental results showed that the maximum average error was 3.162 µm (standard deviation was 0.310
µm) and the minimum was 0.150 µm (standard deviation was 0.189 µm). In terms of the measurement of other workpiece samples, the maximum difference in the average values in the measurement results was smaller than two pixels, and the ratio value was lower than 1%. Therefore, the experimental results verified that the on-machine external thread measurement system developed in this study demonstrates high accuracy and stability.
REFERENCES
[1] C. F. Lin, C. H. Hwang, H. R. Fang, C. Y. Chen, and J. R. Sze, "Real-time pitch diameter measurement of internal thread for nut using laser triangulation," in 2017 IEEE International Instrumentation and
Measurement Technology Conference, I2MTC 2017, 2017.
[2] D. S. Lavrinov and A. I. Khorkin, "Laser triangulation 2D scanner signal processing for premium thread pitch measurement," in 2017 International Conference on Industrial Engineering, Applications and
Manufacturing, ICIEAM 2017, 2017.
[3] Q. B. Tong, B. Z. Han, D. L. Wang, J. Q. Wang, Z. L. Ding, and F. Yuan, "A Novel Laser-Based System for Measuring Internal Thread Parameters," Journal of Russian Laser Research, vol. 35, no. 3, pp. 307-316, 2014.
[4] Y. C. Lin, P. H. Hu, K. Y. Huang, Y. H. Wang, S. S. Ko, and C. S. Liu, "Design and characterization of laser-based inspection system," in
2012 51st Annual Conference on of the Society of Instrument and
Control Engineers of Japan, SICE 2012, Akita, 2012, pp. 1062-1066.
[5] H. L. Huang, W. Y. Jywe, C. H. Liu, L. Duan, and M. S. Wang, "Development of a novel laser-based measuring system for the thread
profile of ballscrew," Optics and Lasers in Engineering, vol. 48, no. 10, pp. 1012-1018, 2010.
[6] Y. Zhao, X. Qu, Y. Tian, R. Lu, and H. Liu, "Investigation on the metrology of conical thread gauge," in Key Engineering Materials vol. 693, ed: Trans Tech Publications Ltd, 2016, pp. 150-154.
[7] D. T. Maciel, S. L. M. R. Filho, C. H. Lauro, and L. C. Brandão, "Characteristics of machined and formed external threads in titanium alloy," International Journal of Advanced Manufacturing Technology,
vol. 79, no. 5-8, pp. 779-792, 2015.
[8] V. I. Leun and E. V. Nikolaeva, "Direct measurement of the mean thread diameter of cutting and monitoring tools in thread grinding,"
Russian Engineering Research, vol. 35, no. 2, pp. 156-157, 2015.
[9] V. I. Leun and E. V. Nikolaeva, "Design of active monitoring systems for the mean thread diameter in thread grinding," Russian Engineering
Research, vol. 35, no. 4, pp. 313-314, 2015.
[10] W. Wu, D. Shao, W. Wang, and G. Wang, "Thread measurement algorithm research and software development," in Key Engineering
Materials vol. 579-580, ed, 2014, pp. 392-397.
[11] C. Sheng, Z. Dongbiao, and L. Yonghua, "A new compensation method for measurement of thread pitch diameter by profile scanning,"
Measurement Science Review, vol. 14, no. 6, pp. 323-330, 2014.
[12] S. Kosarevsky and V. Latypov, "Detection of screw threads in computed tomography 3d density fields," Measurement Science
Review, vol. 13, no. 6, pp. 292-297, 2013.
[13] E. Hong, H. Zhang, R. Katz, and J. S. Agapiou, "Non-contact inspection of internal threads of machined parts," International
Journal of Advanced Manufacturing Technology, vol. 62, no. 1-4, pp.
221-229, 2012.
[14] Y. Cheng, L. Bai, and L. Nie, "Enhanced high-precision and non-contact system for measuring geometrical size of the irregular shape," Advanced Science Letters, vol. 6, pp. 625-628, 2012. [15] I. A. Shchurov, "Calculation of the virtual pitch thread diameter using
the cloud of points from CMM," International Journal of Advanced
Manufacturing Technology, vol. 53, no. 1-4, pp. 241-245, 2011.
[16] T. P. Merkač and B. Ačko, "Thread gauge calibration for industrial applications," Strojniski Vestnik/Journal of Mechanical Engineering,
vol. 56, no. 10, pp. 637-643, 2010.
[17] S. Kosarevsky and V. Latypov, "Development of an algorithm to detect screw threads in planar point clouds," Measurement Science Review,
vol. 10, no. 4, pp. 136-141, 2010.
[18] E. S. Gadelmawla, "A novel system for automatic measurement and inspection of parallel screw threads," Proceedings of the Institution of Mechanical Engineers, Part B: Journal of Engineering Manufacture,
vol. 218, no. 5, pp. 545-556, 2004.
[19] R. J. Hunsicker, J. Patten, A. Ledford, C. Ferman, M. Allen, and C. Ellis, "Automatic vision inspection and measurement system for external screw threads," Journal of Manufacturing Systems, vol. 13, no. 5, pp. 370-384, 1994.
[20] M. R. Corley, E. E. Callens Jr, and H. G. Tull Iii, "Direct contact profile characterization of thread surfaces," Journal of Manufacturing
Systems, vol. 11, no. 5, pp. 309-313, 1992.
[21] R. Senthilnathan, M. Nandhini, R. Ranjani, and S. Sridevi, "Vision based orientation invariant measurement of metric screw thread parameters," in 9th International Conference on Trends in Industrial
Measurement and Automation, TIMA 2017, 2017.
[22] E. S. Gadelmawla, "Computer vision algorithms for measurement and inspection of external screw threads," Measurement: Journal of the
International Measurement Confederation, vol. 100, pp. 36-49, 2017.
[23] J. Chao and L. Zhang, "Parameters of small pitch thread measured by an intelligent detection method," Journal of Computational Methods
in Sciences and Engineering, vol. 16, no. 2, pp. 207-218, 2016.
[24] L. Zhao, H. Feng, and Q. Rong, "A novel non-contact measuring system for the thread profile of a ball screw," Mechanical Sciences, vol. 9, no. 1, pp. 15-24, 2018.
[25] I. O. f. Standardization, "ISO 68-1:1998 ISO general purpose screw threads – Basic profile – Part 1: Metric screw threads," International Organization for Standardization, 1998.
[26] N. Otsu, "A Threshold Selection Method from Gray-Level Histograms," IEEE Transactions on Systems, Man, and Cybernetics,
vol. 9, no. 1, pp. 62-66, 1979.
[27] J. Canny, "A Computational Approach to Edge Detection," IEEE
Transactions on Pattern Analysis and Machine Intelligence, vol.