DOI: 10.1534/genetics.103.021642
Multiple-Interval Mapping for Quantitative Trait
Loci Controlling Endosperm Traits
Chen-Hung Kao
1Institute of Statistical Science, Academia Sinica, Taipei 11529, Taiwan, Republic of China
Manuscript received August 28, 2003 Accepted for publication April 30, 2004
ABSTRACT
Endosperm traits are trisomic inheritant and are of great economic importance because they are usually directly related to grain quality. Mapping for quantitative trait loci (QTL) underlying endosperm traits can provide an efficient way to genetically improve grain quality. As the traditional QTL mapping methods (diploid methods) are usually designed for traits under diploid control, they are not the ideal approaches to map endosperm traits because they ignore the triploid nature of endosperm. In this article, a statistical method considering the triploid nature of endosperm (triploid method) is developed on the basis of multiple-interval mapping (MIM) to map for the underlying QTL. The proposed triploid MIM method is derived to broadly use the marker information either from only the maternal plants or from both the maternal plants and their embryos in the backcross and F2populations for mapping endosperm traits. Due to the
use of multiple intervals simultaneously to take multiple QTL into account, the triploid MIM method can provide better detection power and estimation precision, and as shown in this article it is capable of analyzing and searching for epistatic QTL directly as compared to the traditional diploid methods and current triploid methods using only one (or two) interval(s). Several important issues in endosperm trait mapping, such as the relation and differences between the diploid and triploid methods, variance components of genetic variation, and the problems if effects are present and ignored, are also addressed. Simulations are performed to further explore these issues, to investigate the relative efficiency of different experimental designs, and to evaluate the performance of the proposed and current methods in mapping endosperm traits. The MIM-based triploid method can provide a powerful tool to estimate the genetic architecture of endosperm traits and to assist the marker-assisted selection for the improvement of grain quality in crop science. The triploid MIM FORTRAN program for mapping endosperm traits is available on the worldwide web (http://www.stat.sinica.edu.tw/chkao/).
C
EREAL grains of many crops, such as rice, wheat, grains. The genetic improvement targeting theseendo-barley, and corn, are major food and nutritious sperm traits can provide an efficient way to enhance
resources for human, animal feeds, and industrial prod- the grain quality, and it has attracted a lot of attention
ucts. To enhance the yield and quality of grains, the in plant breeding (Sadimantaraet al.1997;Mazuret
understanding of the genetic basis underlying the cereal al.1999;Tanet al.1999;WangandLarkins2001;Lou
grains becomes increasingly important in crop study. andZhu2002). Genetically, the trisomic endosperm
rep-The cereal grains are generally composed of diploid (em- resents the next generation and has a more complex
bryo) and triploid (endosperm) tissues due to double genetic mechanism than the diploid tissues. For these
fertilization. During the process of double fertilization, reasons, the approach of genetic analysis to endosperm
one of the two sperm cells fuses with the egg cell to traits is different from that to traits under diploid
con-produce a diploid zygote, which later divides mitotically trol, and special treatments are required in the study
to form the embryo, and the other sperm cell unites of endosperm traits.
with the central cell (a diploid set of maternal chromo- Most endosperm traits show continuous variations.
somes) to form a triploid endosperm nucleus, which also Quantitative genetic models considering the triploid
undergoes several mitotic divisions to become the endo- nature of endosperm traits for studying the underlying
sperm. It is known that the endosperm plays a major role genetic basis have been proposed by several researchers
to nourish the embryo in the seed and the young seedling, (Gale1976;Mo1987;Bogyoet al.1988;ZhuandWeir
and the content of endosperms, such as protein, sugar, 1994). These models generally focus on partitioning the
oil, and carbohydrate concentration, showing quantita- phenotypic variance of an endosperm trait into various
tive variation is directly related to the quality of cereal genetic and nongenetic (environmental) components.
These variance components do not provide all the de-tailed information, such as the number, positions, and effects about the underlying quantitative trait loci (QTL).
1Author e-mail:[email protected]
To unlock this QTL information, the ideas of the tradi- vestigated. A series of simulation studies was performed to further investigate these issues, to examine the rela-tional QTL mapping methods utilizing the
well-distrib-uted genetic markers along the genome to infer the tive efficiency of different experimental designs, and to
evaluate the performance of the MIM-based method as QTL parameters can be used. The traditional QTL
map-ping methods use the information about traits and compared to the current methods in mapping
endo-sperm traits.
markers from the same generation,e.g., backcross or F2
populations, to detect QTL controlling traits in diploid
organisms (Lander and Botstein 1989; Haley and
GENETIC MODEL OF ENDOSPERM TRAITS
Knott1992;Jansen1993;Zeng1994;Kaoet al.1999;
Kao andZeng2002). Although they are designed for Genetic model:For individuals in a backcross or F2
traits under diploid control, some researchers have ap- population of autogamous plants, the endosperm
tis-plied them to mapping for QTL controlling endosperm sues of their seeds can have four possible genotypes,
traits (Tanet al.1999;WangandLarkins2001;Wang Q Q Q,Q Qq,Qqq, andqqq, if only one QTLQis
consid-et al. 2001). Such application implicitly relies on an ered (appendix b). Some genetic models for defining
invalid assumption that the endosperm traits are directly the genetic parameters and modeling the relationship
controlled by the diploid maternal genomes, not by the between their genotypic values and the genetic
parame-triploid endosperm genomes. Consequently, the tradi- ters already exist (e.g.,Gale 1976;Mo1987; Bogyoet
tional QTL mapping methods have limited power and al.1988;Pooniet al.1992;ZhuandWeir1994). Here,
precision in mapping endosperm traits (Wuet al.2002a). the genetic model by Bogyoet al.is adopted for
model-Wu et al. (2002a,b) and Xu et al. (2003) pioneered ing, and it can be expressed in matrix notation as
statistical methods to map endosperm traits by taking the triploid nature of endosperms into account using the marker information from the maternal plants
(one-stage design) in the backcross or F2population.Wuet
al.(2002a) further proposed a triploid QTL mapping
method by using the marker information from both the
G1
G2
G3
G4
⫽
1
1 1
1
⫹
3
2 0 0
1
2 1 0
⫺1
2 0 1
⫺3
2 0 0
a
d1
d2
, (1)
maternal plants and their embryos (two-stage design), to improve the mapping of endosperm traits in the backcross population. Their methods have been shown to be able to provide improved QTL resolution. As these methods consider only one (or two) QTL at a time in the model, they can bias QTL identification and estimation
where the notationsG1,G2,G3, andG4denote the
geno-when multiple QTL are located in the same linkage
typic values of genotypes Q Q Q, Q Qq, Q qq, and qqq,
group (LanderandBotstein1989;Jansen1993;Zeng
respectively, anda,d1, andd2 are the genetic
parame-1994). To deal with these problems and further improve
ters. In Equation 1, the matrix with 4⫻3 dimension is
the endosperm trait mapping, a potential way is to
ex-called a genetic design matrix as it specifies the relation-tend the current one-QTL model to a multiple-QTL
ship between the genotypic values and genetic parame-model such that more genetic variation can be
con-ters, and it is symbolized byD. The unique solutions of
trolled in the model, as has been done in mapping traits
a,d1, andd2 in terms of the genotypic values are
in diploid tissues (KaoandZeng1997;Kaoet al.1999;
Zenget al.1999). In this article, a triploid method based
⫽ G1
2 ⫹
G4
2,
on multiple-interval mapping (MIM) using multiple marker intervals simultaneously to fit multiple putative QTL into the model is developed to achieve these
pur-a⫽ G1
3 ⫺
G4
3,
poses. This MIM-based triploid method can broadly take either the one- or two-stage design in either the
back-cross or F2 population into account to analyze endo- d1⫽ ⫺
2G1
3 ⫹ G2⫺
G4
3 ⫽a⫺ (G1⫺G2),
sperm traits. As shown in this article, the proposed method can detect QTL responsible for endosperm
d2⫽ ⫺
G1
3 ⫹ G3⫺
2G4
3 ⫽(G3 ⫺G4)⫺a.
traits with more power and better precision, and it can readily analyze and search for epistatic QTL due to its
multiple-QTL approach. Besides, some related issues in The parameter obviously is not a measure of mean
genotypic values as the genotypic values of AAa and
mapping endosperm traits, such as the problems of
using the diploid methods, the differences and relation Aaaare ignored. The parametera, which measures the
average effect of substituting Qforq, is defined as the
between the diploid and triploid methods, the genetic
variance components of endosperm traits, and the prob- additive effect, and the parameter d1(d2), which
mea-sures the departure of the substitution effect inQQ(qq)
in-background, is defined as the first (second) dominance Variance components:Consider only one QTL in the genetic model. It is easy to show that the variance of effect. The genetic model can be expressed more
suc-cinctly as the additive variable,V(x), is19⁄16, and the variances of
the two dominance variables, V(z1) and V(z2), are 7⁄64,
Gi ⫽ ⫹ax⫹d1z1⫹d2z2, i⫽1, 2, 3, 4 , (2) in a backcross population. In an F2 population, these
variances are 7⁄4, 7⁄64, and 7⁄64, respectively. The
covari-where the coded variables are defined as
ances between the variables, Cov(x,z1), Cov(x,z2), and
Cov(z1, z2), are 5⁄32, 1⁄32, and ⫺1⁄64, respectively, in the
backcross population, and they are1⁄16,⫺1⁄16, and⫺1⁄64,
respectively, in the F2population. Therefore, the genetic
x⫽
3⁄
2 ifQisQQQ
1⁄
2 ifQisQQq
⫺1⁄
2 ifQisQqq
⫺3⁄2 ifQisqqq,
z1⫽
1 ifQ isQQq
0 otherwise , variance components of an endosperm trait are
2
G⫽
19 16a
2⫹ 7
64d
2
1⫹
7
64d
2
2⫹
5
16ad1⫹
1
16ad2⫺
1 32d1d2
(4)
z2⫽
1 ifQ isQqq
0 otherwise,
in the backcross population, and they are such that each genotype corresponds to its genotypic value.
2
G⫽
7 4a
2⫹ 7
64d
2
1 ⫹
7 64d
2
2⫹
1
8ad1⫺
1
8ad2 ⫺
1
32d1d2 (5)
If different genetic models are used for modeling, they can be also expressed as in Equations 1 and 2, but note
that the parameters may have different meanings and in the F2population. It shows that each effect contributes
the variance component may have different structure. not only to its variance but also to the covariances with
The extension of the one-locus genetic model in Equa- other effects, and that the relative importance of effects in
tion 1 to multiple, saym, loci is straightforward. Consider contributing to the total genetic variance depends not only
mQTL,Q1,Q2, . . . , andQm, each with four genotypes on their sizes but also on their associated coefficients (the
and three genetic parameters. Together, for m QTL, variance or covariance of their coded variables). When
there are 4mpossible different QTL genotypes and 3m
mQTL each with complete effects are considered
to-parameters if epistasis between QTL is not considered gether, the genetic variance has [9m2(3m⫺ 1)2 ⫹ 6m
or 3m(3m⫺1)/2 parameters if only up to digenic epista- (3m ⫺ 1)]/8 components. For example, the total
ge-sis is considered. The columns for epistage-sis can easily netic variance has 120 components form⫽ 2 in both
be obtained from the product of columns of marginal populations (not shown), and it reduces to 111
compo-effects. By expanding the genetic design matrix D of nents in the backcross population and 83 components
Equation 1 to a 4m⫻3mor 4m⫻3m(3m⫺1)/2 matrix
in the F2 population when the two QTL are unlinked
(seethe mim model for mapping endosperm traits), (appendix a). Among the coefficients of the variances
the genetic model form QTL in matrix notation can involving the epistatic effects, the coefficients associated
be obtained. The genetic design matrixDplays an im- with the additive-by-additive effect (i
a1a2) are relatively
portant role in the estimation of the QTL effects in the much larger than those of other variances and
covari-triploid MIM model. The corresponding multiple-QTL ances. For example, in the F2population, the coefficient
model in the form of Equation 2 can be easily obtained of i2
a1a2 (the variance of x1x2) is
49⁄16 (appendix a); i.e.,
using a regression principle. Following the regression the variance contributed byia
1a2is
49⁄16⫻i2
a1a2, the
coeffi-principle, the genetic model ofmQTL by considering cients of the other four epistatic variances involving
up to digenic epistasis can be written as the additive effects are 7⁄
32, and the coefficients of the
remaining four different types of epistatic variance are
Gi⫽ ⫹
兺
m
j⫽1
ajxj⫹
兺
m
j⫽1
dj1zj1⫹
兺
m
j⫽1
dj2zj2 63⁄4096. The coefficients of the covariances between the
additive effects and the epistatic effects involving the
additive effects are7⁄32, and the coefficients of the
covari-⫹
兺
mj⬍k
iajak(xjxk)⫹
兺
m
j⬆k
iajdk1(xjzk1)⫹
兺
m
j⬆k
iajdk2(xjzk2)
ances betweenia1a2and the other epistatic effects
involv-ing the additive effects are 7⁄64. The other covariances
⫹
兺
mj⬍k
idj1dk1(zj1zk1)⫹
兺
m
j⬍k
idj1dk2(zj1zk2)⫹
兺
m
j⬍k
idj2dk1(zj2zk1)
are relatively smaller. Therefore, it implies that, for the same order of the epistatic effects, the epistatic effects
⫹
兺
mj⬍k
idj2dk2(zj2zk2), i⫽1, 2, . . . , 4
m, (3)
involving the additive effects, especially the additive-by-additive effect, are relatively easy to detect, and the
whereis the intercept;aj,dj1, anddj2are the additive other epistatic effects are relatively difficult to detect in
and dominance effects ofQj;iajak,iajdk1,iajdk2,idj1dk1,idj1dk2, practical QTL mapping (with a limited sample size).
A similar pattern can also be found in the backcross
idj2dk1, and idj2dk2 denote the epistatic effects between
population. For two nonepistatic QTL, the variance
QTL; andxj,zj1, andzj2are the coded variables of the
2
G⫽
7 4a
2
1⫹
7 64d
2
11⫹
7 64d
2
12⫹
7 4a
2
2⫹
7 64d
2
21⫹
7 64d
2 22
w*i ⫽
1⁄
2 ifQisQq,
⫺1⁄
2 ifQ isqq; ⫹1
8a1d11⫺ 1 8a1d12⫺
1
32d11d12⫹
1 8a2d21⫺
1 8a2d22⫺
1
32d21d22 yi is the endosperm trait value; is the intercept; b
is the QTL effect measuring the genotypic difference ⫹1
4[9(1⫺2r12)⫹5(1⫺2r12)
2]a1a2⫹1
8(1⫺2r12)
2a1d21 between Qq and qq. The statistical model for n
endo-sperms in the F2population can be expressed as
⫺1
8(1⫺2r12) 2
a1d22⫹ 1
8(1⫺2r12) 2
d11a2 yi⫽ ⫹baw*ai ⫹bdw*di⫹ εi, i⫽ 1, 2, . . . ,n, (7)
wherew*ai andw*diare defined as
⫹
冦
1 4[r4
12 ⫹(1⫺r12)4]⫺
1
32
冧
d11d21⫹
冦
12[r12(1⫺r12)]
2⫺ 1
32
冧
d11d22 w*ai ⫽ 1 ifQisQ Q,
0 ifQisQq,
⫺1 ifQisqq,
w*di⫽
1⁄2 ifQisQq,
⫺1⁄2 otherwise;
⫺1
8(1⫺2r12)
2a2d12⫹
冦
12[r12(1⫺r12)]
2⫺ 1
32
冧
d12d21 ba and bd denote the additive and dominance effects.
The residual errorεiin the above two models is assumed
⫹
冦
1 4[r4
12⫹(1⫺r12)4]⫺
1
32
冧
d12d22, to have a normal distribution with mean zero andvari-ance 2
ε. As QTL may not be coincident with markers,
where r12 is the recombination fraction between the the QTL genotype is usually unobservable. Therefore,
two QTL, in the F2 population. Similarly, the variance the likelihood of the diploid model is known as a
mix-components for the backcross population also have 21 ture of normals,
terms (not shown). If the two nonepistatic QTL are unlinked, the variance components reduce to a much
L(|Y,X)⫽
兿
n
i⫽1
兺
k
j⫽1
pijN(j,2ε)
, (8)
simpler form with the first 12 components.
wherej’s correspond to the genotypic values of the k
different QTL genotypes (k⫽2 for the backcross model
THE RELATION BETWEEN THE DIPLOID
andk⫽3 for the F2model), and the mixing proportions,
AND TRIPLOID METHODS
pij’s, are the conditional probabilities of QTL genotypes
The traditional QTL mapping methods are usually
de-(see Tables 1 and 2 inKaoandZeng1997). The
maxi-signed to map for QTL controlling traits in diploid
organ-mum-likelihood estimate (MLE) of the QTL effects and
isms (Landerand Botstein1989;Haleyand Knott
their asymptotic variance-covariance can be obtained
1992; Jansen 1993; Zeng 1994; Kao et al. 1999; Kao using the EM algorithm (Dempster et al. 1977) and
and Zeng 2002). These diploid methods classify the Louis’s (1982) method by treating the normal mixture
genotypes of each QTL into two groups,QQ (qq) and model as an incomplete-data problem.
Qq, for the backcross population or three groups, qq, The relation between the diploid and triploid models:
Qq, andQQ, for the F2population, and they detect the When applying the diploid models to mapping
endo-association between the QTL genotype and the trait sperm traits, it is generally assumed that the endosperm
value both measured at the same generation for QTL traits are directly controlled by the diploid genomes of
mapping. Although the endosperms are known to be the backcross or F2individuals. This assumption,
how-triploid and represent the next generation, some re- ever, violates the fact that the triploid endosperms
repre-searchers have applied these diploid methods to map- sent the genetic composition of the next generation,
ping endosperm traits of the backcross or F2individuals which, in fact, is mainly responsible for the trait
varia-(Tan et al. 1999; Wang et al. 2001; Wuet al. 2002a). tion. Consequently, as compared to the use of the
trip-Therefore, it is important to investigate the problems loid model, some problems, such as less power and
of using the diploid methods and the relation between precision in QTL detection, will occur in the diploid
the diploid and triploid methods in mapping endo- model as shown below.
sperm traits. When an endosperm trait affected only by one QTL,
Diploid methods: When applying the diploid meth- Q, is regressed on a markerMalong the genome to infer
ods to mapping endosperm traits and only one QTL is Q, the regression coefficient ofMin the backcross diploid
considered, the statistical model for n endosperms in model is
the backcross population can be written as
bM⫽(1⫺ 2rQM)
冤
3
2a⫹
1
4(d1 ⫹d2)
冥
, (9)yi ⫽ ⫹bw*i ⫹εi, i⫽ 1, 2, . . . ,n, (6)
Q, in the backcross population (appendix b). If the cients between the diploid and triploid models can be
compared when M and Q are coincident (rQM ⫽ 0).
markerMis coincident withQ(rQM⫽0), the coefficient
reduces tobM⫽3⁄2a⫹1⁄4(d1⫹d2). The estimated coeffi- Taking a QTL with no dominance (a⫽1,d1⫽d2⫽0)
and contributing 10% of the trait variation as an exam-cient of the backcross diploid model is composed of
the additive effect and two dominance effects. In the ple, the conditional phenotypic variance roughly equals
to2 for the triploid model, and it is ⵑ181⁄171⫻ 2 for
F2diploid model, the regression coefficient for the
addi-tive effect ofMis the diploid model. The variances2
Mfor the two different
models are1⁄4and 19⁄16, respectively. Consequently, the
sampling variance of the regression coefficient for the
bMa⫽
3(1⫺ 2rQM)
2 a, (10) diploid model isⵑ5.03 times that for the triploid model
in the backcross population. It isⵑ3.64 times that for
and the coefficient for the dominance effect is
the same setting in the F2 population. The sampling
variances of the regression coefficients in the diploid
bMd⫽
1⫺ 2rQM
4 (d1⫹d2). (11) models are larger than those in the triploid model.
On the basis of the above findings, two problems will
IfMand Qare coincident, the additive coefficient re- occur if the diploid models are applied to mapping
duces tobMa ⫽3a/2 and the dominance coefficient re- endosperm traits. First, the estimates in the diploid
mod-duces tobMa⫽ (d1⫹d2)/4. The additive coefficient esti- els are generally confounded by the additive and
domi-mated in the F2diploid model is 1.5 times the additive nance effects of endosperm QTL (Equations 9–11).
Sec-effect, and the estimated dominance coefficient is one- ond, the sampling variances of the estimates will inflate
quarter of the sum of the two dominance effects. When because the genetic variances and covariances
contrib-both of the additive and dominance variables are fitted uted by QTL are not fully controlled in the model.
in the model, the partial regression coefficients are the Consequently, the diploid models cannot directly
esti-same as Equations 10 and 11 because of orthogonality. mate the effects of the endosperm QTL, and they have
The above derivations present the relation of parame- the confounding problems in estimation and will
de-ters between the diploid and triploid models and show crease the power in endosperm QTL detection.
that the diploid models cannot directly estimate the QTL effects in mapping endosperm traits.
THE MIM MODEL FOR MAPPING
The phenotypic variance conditional on the marker
ENDOSPERM TRAITS
Min the backcross diploid model is
Endosperm trait multiple-interval mapping:Assume an
2
y.M⫽ 2⫹(1⫺2rQM)2 endosperm trait is controlled bymQTL, Q1, Q2, . . . ,
andQm, located at positionsp1,p2, . . . , andpm, in m
different marker intervals,I1,I2, . . . , andIm, along the
⫻
5 8a
2⫹ 3
32(d
2
1⫹d22)⫹
1 8(ad1)⫺
1 8(ad2)⫺
1 16(d1d2)
genome. If only up to digenic epistasis is considered,
the value of an endosperm trait,yi, in the backcross or
(12)
F2population can be related to themputative QTL by
(appendix b). It shows that the genetic variances and co- the model variances contributed by the additive and dominance
ef-yi⫽ ⫹
兺
m
j⫽1
ajx*i j ⫹
兺
mj⫽1
dj1z*ij1⫹
兺
m
j⫽1
dj2z*i j2⫹
兺
m
j⬍k
iajak(x*i jx*i k) fects cannot be fully controlled in the model. The
percent-ages of additive and dominance variances uncontrolled
by the diploid model areⵑ47.4% (9/19) and 14.3% (1/ ⫹
兺
mj⬆k
iajdk1(x*i jz*i k1)⫹
兺
m
j⬆k
iajdk2(x*i jz*i k2)⫹
兺
m
j⬍k
idj1dk1(z*i j1z*i k1)
7), respectively. For the F2 population, the phenotypic
variance conditional on the additive and dominance vari- ⫹
兺
m j⬍kidj1dk2(zi j*1z*i k2)⫹
兺
m
j⬍k
idj2dk1(zi j*2z*i k1)⫹
兺
m
j⬍k
idj2dk2(z*i j2z*i k2)
ables of markerMis the same as that in the backcross
model (appendix b). The percentages of uncontrolled
⫹εi, i⫽1, 2, . . . ,n, (13)
additive and dominance variances areⵑ63.4% (9/14)
and 14.3% (1/7), respectively. In addition, a part of the where the parameters and coded variables have the
genetic covariances is also uncontrolled by the diploid same definitions as those in the genetic model in
Equa-model. The uncontrolled variances and covariances will tion 3, and the residual error εi is assumed to follow
become a part of the genetic residual, causing inflation normal distribution with mean zero and variance2. In
of the sampling variance of the coefficients. The sampling QTL mapping, the endosperm QTL genotype of any
variance of the regression coefficient of the backcross putative QTL, sayQj, j⫽ 1, 2, . . . , m, is usually not
model isⵑV(bˆM)⫽n⫺1⫻ 2y.M/2M, whereM2 is the vari- observable and could be QjQjQj, QjQjqj, Qjqjqj, or
ance of the coded variable ofM, in a large sample with qjqjqjwith different (conditional) probabilities for
dif-sizen(StuartandOrd1991). Using the approxima- ferent endospermi. The conditional probabilities
(distri-bution) for eachQj under different experimental
coeffi-signs can be derived by using its flanking marker byKao andZeng(1997) are used to obtain the MLE of the effects and their asymptotic variance-covariance information from the maternal plants (and their
em-bryos) as shown below, and then the normal mixture matrix.
Parameter estimation:The application of the general
likelihood of the model can be constructed. As multiple
(m) intervals are used to infer the conditional distribu- formulas to obtain the MLE and the asymptotic
variance-covariance matrix for the triploid MIM model is based
tion of the (m) endosperm QTL for modeling, this
approach is called multiple-interval mapping in QTL on the construction of the two matricesDandQ, where
D is the genetic design matrix for characterizing the
mapping (Kao and Zeng1997; Kao et al. 1999), and
this model is a MIM-based triploid model. By specifying QTL effects, andQis the conditional probability matrix
containing the mixing proportions of QTL genotypes.
appropriate conditional probabilities to the 4m
endo-sperm QTL genotypes of themQTL, this triploid MIM Given the two matrices, the MLE of QTL effects and
their asymptotic variance-covariance matrix of the trip-model can be applied widely to mapping endosperm
traits using data from various designs and populations. loid model can be easily obtained. The construction of
theDandQmatrices is described below.
Likelihood: For any interval, Ij, flanked by the two
markers,MjandNj, the maternal plants or their embryos For one QTL (m⫽1) in the model, there are four
endosperm QTL genotypes and three genetic effects, can have four and nine different marker genotypes in
the backcross and F2 populations, respectively. If both and the genetic design matrix is a 4⫻3 matrix as shown
in Equation 1. For m QTL in the model, if epistasis
the plants and embryos are considered together, their
marker genotypes can have 16 and 25 combinations in between QTL effects is not considered, there are 4m
endosperm QTL genotypes and 3mgenetic effects (m
the two different populations, respectively (appendix
c). For any Qj in Ij, the (conditional) probabilities of additive effects,mfirst dominance effects, andmsecond
dominance effects), and the genetic design matrix is the four endosperm QTL genotypes can be inferred
only from the maternal plants (one-stage design) or then a 4m⫻3mmatrix. If all the possible digenic
epista-ses between QTL are considered, the column dimension both from the maternal plants and their embryos
(two-stage design) as shown in appendix c. To assist with of D becomes 3m(3m ⫺ 1)/2. An example of genetic
design matrix withm⫽2 and all possible effects (with
explaining the parameter estimation, these conditional
probabilities are extracted to form a matrix Qj,j⫽ 1, dimension 16⫻15) can be found inWuet al.(2002a).
The joint conditional probability matrixQfor themQTL
2, . . . ,m. The dimension ofQjis 25⫻4 (16⫻4) for
a two-stage design in the F2(backcross) population, it is has a dimension 9m⫻4m(4m⫻4m) or 25m⫻4m(16m⫻4m)
under the one- or two-stage design in the F2(backcross)
9⫻4 (4⫻4) for a one-stage design in the F2(backcross)
population (note thatQdenotes QTL, andQdenotes population, and they can be obtained byQ⫽Q1丢Q2
丢. . .丢Qm, where丢denotes the Kronecker product.
the conditional probability matrix). For the totalmQTL
in them different intervals, there are 4m possible endo- The 4mmixing proportions of any endospermi,p
ij’s, in
the likelihood can be found to be one of the rows inQ
sperm QTL genotypes in each of 25m (16m, 9m, or 4m)
possible marker genotypes. The 4m joint conditional according to the marker genotypes of the plants (and
embryos). By applying the matricesDandQto the general
probabilities of endosperm QTL genotypes can be
ob-tained by the product of individual conditional proba- formulas, the MLE of the effects and their asymptotic
variance-covariance matrix can be readily obtained. bilities for each QTL using the property of conditional
independence among different QTL (Kao and Zeng The problems if effects are present and ignored:Three
marginal genetic effects are associated with each endo-1997), and they play the role of mixing proportions
in the normal mixture likelihood. Let the conditional sperm QTL. In practice, QTL may display all or some of
the effects (see Wu et al.2002b as an example), and,
probabilities of 4m possible QTL genotypes for
endo-sperm i from designs and populations be denoted as before mapping, it is not known which effects are
pres-ent or abspres-ent. The possible drawback of fitting the
ab-pi j’s, j ⫽ 1, 2, . . . , 4m (note that pj’s denote QTL
sent effects (overfitting) in the model is the loss of power
positions, andpi j’s denote the conditional probabilities).
in QTL detection, as higher critical value is usually
re-The likelihood of the triploid MIM model for the n
quired to claim the significance of QTL. If some
dis-endosperms is a mixture of 4mnormals as
played effects are ignored in the model, not only the power of detection will be affected but also the
con-L(|Y,X)⫽
兿
n
i⫽1
兺
4m
j⫽1
pi jN(j,2)
, (14) founding problem will occur as discussed below.Assume the endosperm trait valueyis affected by two
wherej’s correspond to the genotypic values of the 4m nonepistatic endosperm QTL, Q1 and Q2. When the
different QTL genotypes, and the mixing proportions, trait value is regressed onQ1by fitting only its additive
pij’s, are the corresponding joint conditional probabili- variable x1 into the model, the regression coefficients
ties. The density of each individualiis a mixture of 4m
in terms of the QTL effects and linkage parameter for
possible normal densities with different means,j’s, and the backcross and F2populations are shown inappendix
d. It shows that the estimate of the additive effect ofQ1
is not unbiased for a1 and is confounded by its other variation together and to be located in the middle of the chromosomes. Data from the two-stage design in the
effects and the effects of Q2. The confounding of Q2
effects is through linkage parameter. IfQ1 andQ2are F2population were generated. The parameter setting is
a1⫽3,d11⫽ ⫺3, andd12⫽ ⫺3 forQA;a2⫽2.5,d21⫽
unlinked, the regression coefficients reduce to much
simpler forms without the confounding ofQ2. For exam- 4, and d22 ⫽ 4 for QB; and a3 ⫽ 1.5, d31 ⫽ 0, and
d32⫽0 forQC. There is additive-by-additive interaction
ple, ifr12⫽0.5,by x1⫽a1⫹5d11/38⫹d12/38 for the
back-betweenQB andQC, and the epistatic effect ia2a3 is
as-cross population, andby x1⫽a1⫹d11/28⫺d12/28 for the
F2population. The confounding ofQ2disappears, and sumed to be 1. Under the parameter setting, the genetic
the coefficient is confounded only by its dominance and environmental variances areⵑ38.37 and 51.66,
re-effects. The same confounding problem can also be found spectively. In the total genetic variance, the marginal
for the estimate of the dominance effect if fitting only effects of the three QTL contributeⵑ45.44, 36.32, and
its dominance variablez1 in the model (appendix d). 10.26%, respectively, and the epistatic effect contributes
If epistasis is present and ignored in the model, most ⵑ7.98%. In the genetic variance contributed by QA
of the epistatic effects will be confounded in the estima- (QB), the variance contributed by the two dominance
tion as most of the covariances between the marginal effects isⵑ11.29% (25.11%). The number of simulation
and epistatic effects are not zero whether they are linked replicates is 100. Both the current triploid method
con-or not (result not shown). To avoid the confounding sidering only one QTL,i.e., the interval-mapping
(IM)-problem and enhance the detection power, it is desir- based method, and the proposed MIM-based method
able to fit only those displayed effects into the model were used to analyze the data. The results are shown in
in QTL mapping. Table 3. In each scenario, permutation tests proposed by
ChurchillandDoerge(1994) were used to determine the critical values for power calculation.
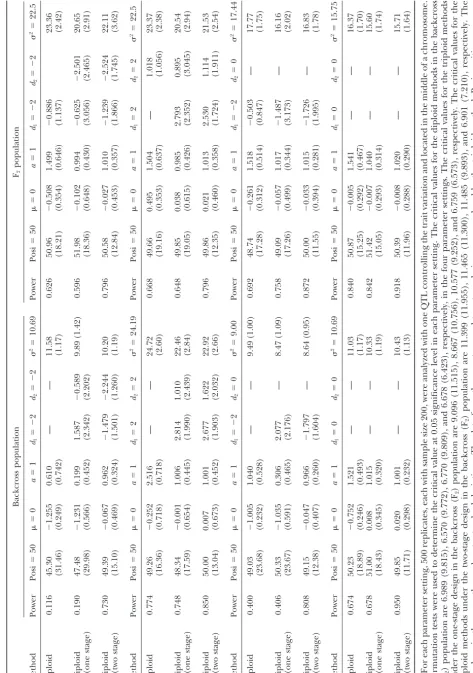
SIMULATION STUDY
Tables 1 and 2 show the results of the first part of
A series of simulations was performed to achieve three the simulation. The relationship between the estimates
purposes: (1) to verify the derived relations and com- of the diploid and triploid models corresponds very well
pare the differences between the diploid and triploid with the derived prediction (Equations 9–11). For the
models, (2) to examine the performance of the triploid backcross population, the effects of the diploid models
method in different experimental designs and popula- in the four settings are expected to be 0.5, 2.5, 1.0, and
tions, and (3) to evaluate the performance of the pro- 1.5, according to Equation 9. The means of the estimates
posed MIM-based triploid method as compared to the are found to be 0.610, 2.516, 1.040, and 1.521,
respec-current methods in mapping endosperm traits. The sim- tively, forh2⫽0.1 (Table 2), and they are 0.599, 2.489,
ulation study includes two parts. The first part is to 1.005, and 1.475, respectively, forh2 ⫽ 0.2 (Table 3).
achieve the first two purposes, and the second part is For the F2population, the means of the estimated
addi-to achieve the third purpose. In each part, the sample tive and dominance effects in the diploid model are
size is assumed to be 200. The first part assumes one also found to be very close to the predicted values in
QTL affecting the endosperm trait with two levels of both levels of heritability. For example, the mean of the
heritability (h2), 0.1 and 0.2. It includes four different
estimated additive effects for the first setting withh2⫽
parameter settings: (1)a⫽1,d1⫽ ⫺2,d2⫽ ⫺2 (G1⫽ 0.1 is 1.499 (predicted value 1.5), and the mean of the
3⁄2,G
2⫽ ⫺3⁄2,G3⫽ ⫺5⁄2, andG4⫽ ⫺3⁄2); (2)a⫽1,d1⫽ estimated dominance effects for the second setting with
2,d2⫽2 (G1⫽3⁄2,G2⫽5⁄2,G3⫽3⁄2, andG4⫽ ⫺3⁄2); (3) h2 ⫽ 0.2 is 1.010 (predicted value 1.0). The estimated
a⫽1,d1⫽ ⫺2,d2⫽ 0; (G1⫽ 3⁄2,G2⫽ ⫺3⁄2,G3⫽ ⫺1⁄2, residual variance by the diploid model is found to be
andG4⫽ ⫺3⁄2); and (4)a⫽ 1,d1⫽0,d2⫽0 (G1⫽3⁄2, upwardly biased in all cases as expected by Equation 12.
G2 ⫽ 1⁄2, G3 ⫽ ⫺1⁄2, and G4 ⫽ ⫺3⁄2). Among the four The most striking differences in power and estimation
settings, the QTL genotypes are complete-recessive type between the diploid and triploid models are found in
in the first and third settings, and they are complete- the first parameter setting when the additive and
domi-dominance type in the second setting. For each setting, nance effects are in the opposite direction andh2⫽0.2
the QTL is placed in the middle of a chromosome with (Table 2). The detecting powers of the diploid model
six 20-cM equally spaced markers, and data from both are 0.160 and 0.100, respectively, in the two different
the one- and two-stage designs in the backcross and F2 populations. The detecting powers of the triploid model
populations were generated. The number of simulation are 0.508 and 0.926, respectively, under the one-stage
replicates is 500. Both the diploid and triploid methods design, and they increase to 0.980 and 0.998,
respec-were used to detect the QTL using the generated data tively, under the two-stage design. For QTL position,
sets. The results are shown in Tables 1 and 2. The second the means of position estimates by the diploid model
part assumes three chromosomes each with six 20-cM are 46.46 (SD 28.58) and 49.63 (SD 11.10), respectively,
equally spaced markers, and each chromosome contains in the two populations. The means of position estimates
only one QTL. The three unlinked QTL,QA,QB, and provided by the triploid model under the two-stage
de-sign are 49.77 (SD 7.08) and 50.21 (SD 5.68), respectively,
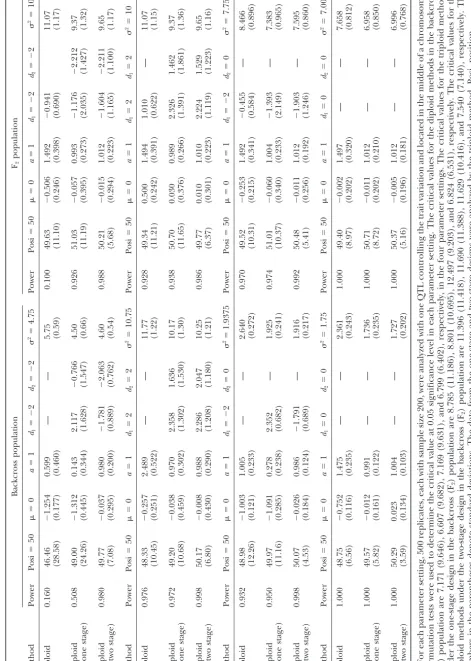
and they are 49.00 (SD 24.26) and 51.03 (SD 11.19) under the one-stage design, respectively. Therefore, the triploid model performs significantly better than the diploid model in this setting. In other settings, the triploid model under the two-stage design is also found to be much more powerful and precise than the diploid model, but the triploid model under the one-stage design seems to provide power and precision (in position estimation) similar to the diploid model. For example, in the third
setting of the backcross population with h2 ⫽ 0.1, the
diploid model has power 0.400 and mean estimated position 49.03 (SD 23.68; Table 1). For the triploid model, they are 0.406 and 50.33 (SD 23.67) under the one-stage design, and they are 0.800 and 49.15 (SD 12.38) under the two-stage design. In the second setting
of the F2 population with h2 ⫽ 0.1, the diploid model
has power 0.668 and mean estimated position 49.66 (SD 19.16). For the triploid model, they are 0.648 and 49.85 (SD 19.05) under the one-stage design, and they are 0.796 and 49.86 (SD 12.35) under the two-stage design. A similar pattern can also be found for the other settings in Tables 1 and 2.
The triploid model is found to have better perfor-mance under the two-stage design than under the one-stage design in this study. Under the two-one-stage design, the triploid model can provide higher power for QTL detection and more precise estimates for positions and
effects. For example, in the first setting with h2 ⫽ 0.1
in the backcross population, the powers are 0.190 and 0.730, respectively (Table 1), and the means of the posi-tion estimates are 47.48 (SD 29.98) and 49.39 (SD 15.10), respectively, under the two different designs. In
the second setting withh2 ⫽0.2 in the F2population,
the powers are 0.938 and 0.986, respectively (Table 2), and the means of the position estimates are 50.70 (SD 11.65) and 49.77 (SD 6.37), respectively, under the two different designs. Besides, the triploid model under the one-stage design seems to have problems in correctly estimating the effects in the backcross population when the additive and dominance effects are in opposite
direc-tion. For example, in the first setting (a ⫽ 1, d1 ⫽ ⫺2,
andd2⫽ ⫺2), the means of the effect estimates by the
triploid model under the one-stage design are 0.199
(SD 0.452), 1.587 (SD 2.342), and⫺0.589 (SD 2.202),
respectively, forh2⫽0.1 (Table 1), and they are 0.143
(SD 0.344), 2.117 (SD 1.628), and⫺0.766 (SD 1.547),
respectively, forh2⫽0.2 (Table 2). These estimates are
highly biased and imprecise under the one-stage design. Similar problems can also be found in the third setting
(a⫽1,d1⫽ ⫺2, andd2⫽0) for the backcross
popula-tion. Such estimation problems, however, do not occur
in the F2population or under the two-stage design (see
Tables 1 and 2), which may suggest that the F2
tion is a better population than the backcross popula-tion and the two-stage design might be a more suitable design than the one-stage design for mapping
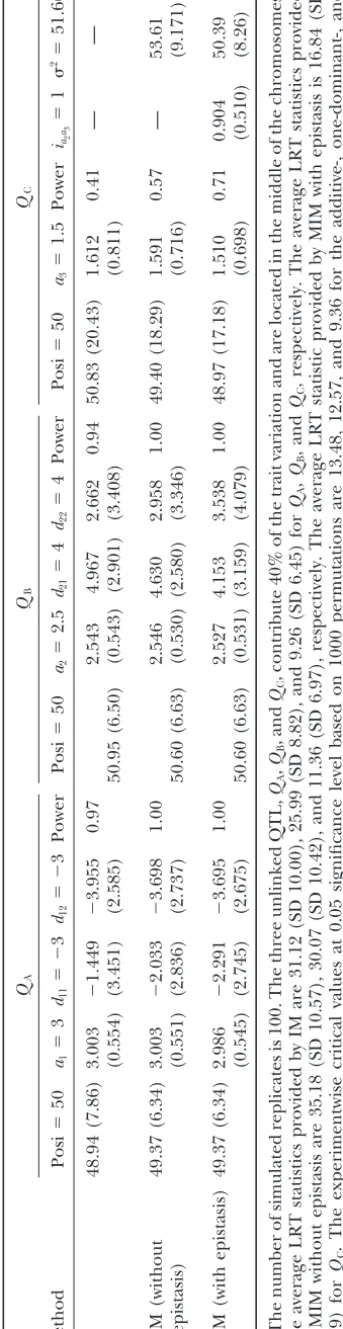
endo-TABLE 3 Simulation results of QTL mapping using the IM-and M IM-based triploid methods Q A Q B Q C Method Posi ⫽ 50 a1 ⫽ 3 d11 ⫽⫺ 3 d12 ⫽⫺ 3 P ower Posi ⫽ 50 a2 ⫽ 2.5 d21 ⫽ 4 d22 ⫽ 4 P ower Posi ⫽ 50 a3 ⫽ 1.5 Power
iaa2
The simulation in the second part aims to evaluate the power to detect QC is 0.57 (average LRT statistic
11.36 with SD 6.97) if only the additive effect (a3) is
and compare the differences between the proposed
MIM-based and the current IM-based methods in map- considered (Table 3). The power decreases to 40% (36%)
if the one-dominant-effect (complete-effect) model is con-ping endosperm traits. The results are shown in Table
3. When the IM-based method is used to detect QTL, sidered (not shown). The means of the position
esti-mates are 49.37 (SD 6.34), 50.60 (SD 6.63), and 49.40 three different models, the additive-effect model (with
aonly), the one dominant-effect model (withaandd1), (SD 18.29) for the three QTL, respectively, which
be-come more precise as compared to those by the
IM-and the complete-effect model (witha,d1, andd2), will
be implemented in the search. The experimentwise crit- based method. If epistasis is taken into account to search
for the third chromosome, many different types of epis-ical values at 0.05 significance level are found to be
9.36, 12.57, and 13.48 for the three different models, tasis can be considered. For illustration, only the
addi-tive-by-additive epistatic effect between QTL is consid-respectively, by 1000 permutations. For the
additive-effect model, the powers to detectQA,QB, andQCare ered (see alsogenetic model of endosperm traitsfor
first taking the additive-by-additive effect into account). 0.97, 0.96, and 0.41, respectively. For the one
dominant-effect model, the powers to detect the three QTL are Among the three possible additive-by-additive effects,
only the consideration ofia2a3improves the QTL
detec-0.97, 0.95, and 0.31, respectively. For the complete-effect
model, the powers are 0.97, 0.94, and 0.31, respectively. tion. The power increases to 71% (Table 3) whenia2a3
The three models have similar powers to detectQAand is considered in the MIM model (m⫽3 with epistasis)
to search for QC (critical value 12.57 by permutation
QB, and the additive-effect model has greater power
than the other two models to detectQC. Among the 100 tests; average partial LRT statistic 16.84 with SD 7.79).
The mean estimate ofia2a3is 0.904 (SD 0.510), and the
replicates, the three models can detect either both or
one ofQAandQBin each replicate. The results of map- mean estimate of2 is 50.39 (SD 8.26). The mean of
position estimate forQCbecomes 48.97 (SD 17.18), and
pingQAandQBby the complete-effect model and
map-pingQCby the additive-effect model are presented in the mean of the estimated effect is 1.510 (SD 0.698),
which is more precise than that obtained by ignoring Table 3. In Table 3, the means of the position estimates
for the three QTL are 48.94 (SD 7.86), 50.95 (SD 6.50), epistasis.
and 50.83 (SD 20.43), respectively. The average LRT statistics are 31.12 (SD 10.00), 25.99 (SD 8.82), and 9.26
CONCLUSION AND DISCUSSION
(SD 6.45), respectively, for the three QTL. This shows
that the larger QTL,QAandQB, can be detected with The endosperm of a seed is a triploid tissue and has a
more complicated genetic mechanism than the diploid higher power and better precision as compared to the
small QTL,QC. Besides, the estimates of additive effects tissues. Therefore, the traditional QTL mapping
meth-ods (Lander and Botstein 1989; Haleyand Knott
generally are more precise than those of dominance
effects. For example, the mean ofaˆ1is 3.003 (SD 0.554), 1992;Jansen1993;Zeng1994;ChurchillandDoerge
1994;Kao et al.1999; Kao and Zeng 2002) designed
and the means ofdˆ11anddˆ12are⫺1.449 (SD 3.451) and
⫺3.995 (SD 2.585), respectively. One of the advantages for traits under diploid control are not appropriate
ap-proaches to map for QTL underlying the endosperm of the MIM-based method is that it is capable of fitting
the detected QTL into the model in further searching traits because they ignore the triploid nature of
endo-sperms.Wuet al. (2002a,b) and Xu et al. (2003) first
for the other QTL. When the MIM-based method
con-siders only one QTL in the model (m⫽1), the mapping considered the triploid inheritance of endosperms to
propose IM-based triploid methods in the detection of results are identical to those obtained by the IM-based
method. Among the 100 replicates analyzed by the IM- the underlying QTL. In this article, a new triploid
ap-proach based on the MIM method is developed to take based method, most of the replicates (91 replicates)
have both QA and QB detected. For the remaining 9 multiple QTL into account in the model for mapping
endosperm traits. The proposed method can be
imple-replicates, eitherQA orQBis detected. If the detected
QA(QB) is fitted into the MIM-based model in the search mented to analyze data from either the one-stage design
using only maternal genotypes or the two-stage design
(m ⫽ 2), the undetected QB (QA) in the 9 replicates
can be identified and the already detectedQB(QA) in using both maternal and embryo genotypes in the
back-cross and F2 populations. As shown in this article, the
the other replicates will have a larger LRT statistic by
including either their partial or complete effects in the triploid MIM method can provide better detection power
and estimation precision, and it can analyze and search
model (that is, the power for detectingQA and QB is
1.0 for MIM withm⫽ 2). To shorten the article, only for epistatic QTL directly in comparison with the
cur-rent IM-based methods when mapping endosperm
the results of considering complete effects of QA and
QBin the analysis are presented (Table 3). The average traits. Some important issues in mapping endosperm
traits, such as the problems of using the diploid mapping
(partial) LRT statistics ofQAandQBincrease to 35.18
(SD 10.57) and 30.07 (SD 10.42), respectively. Further, methods, the relation between the diploid and triploid
methods, the variance components of genetic variance, if these two detected QTL are fitted into the MIM model
the relative efficiency of the diploid and triploid models sperm traits by several researchers (Tanet al.1999;Wang
under different experimental designs, are also investi- andLarkins2001;Wanget al.2001). Such applications
gated analytically or by simulation. generally violate the traditional belief that the
endo-The triploid mapping method can provide better sperm traits are under the control of triploid
mecha-power in detection and more precise estimation under nisms (Benner et al. 1989; Zhu and Weir 1994; Wu
the two-stage design than under the one-stage design et al. 2002a,b). If the diploid methods are applied to
in mapping endosperm traits as shown in the simulation mapping endosperm traits, the confounding problem
study (Tables 1 and 2) and also demonstrated by Wu in estimation will occur (Equations 9–11), and the
sam-et al.(2002b). This is because the two-stage design, which pling variances of the estimates will inflate.
Conse-provides both the maternal and embryo marker geno- quently, the diploid methods can cause some problems,
types, is more informative than the one-stage design, such as bias in estimation and loss in power, in mapping
which offers only the maternal marker genotype, in infer- endosperm traits. Although the diploid methods have
ring the conditional probabilities of the endosperm QTL these problems, the simulation study indicates that, in
genotypes (see the website http://www.stat.sinica.edu.tw/ some parameter settings, its performance (in power and
chkao/ for the conditional probabilities under different position estimate) can be similar to the triploid method
experimental designs). In the backcross population, the under the one-stage design (Tables 1 and 2) due mainly
one-stage design provides only 4 different marker geno- to the correlation between the genomes of the maternal
types, and these marker genotypes are noninformative plant and its endosperms. Therefore, the diploid method
in inferringQ Q Q,Q Qq, andQqq as equal conditional can still be used as a preliminary method in mapping
probabilities are assigned to them. The two-stage design, endosperm traits. By taking the triploid mechanism into
however, can provide 16 different marker genotypes, account, the triploid method, especially under the
two-and the marker genotypes are not informative only for stage design, can effectively solve the problems and
sig-Q sig-QqandQqq. In the F2population, the one- and two- nificantly improve the mapping of endosperm traits.
stage designs can provide 9 and 25 marker genotypes, The proposed MIM-based triploid method is a
multi-respectively, and each marker genotype in either design ple-QTL model. This multiple-QTL approach
distin-is noninformative only for the genotypesQ QqandQqq. guishes itself from the current IM-based methods ofWu
Therefore, the two-stage design is generally more
infor-et al. (2002a,b) andXuet al.(2003) by the ability to use
mative than the one-stage design, and the F2population multiple-marker intervals simultaneously to fit multiple
is generally more informative than the backcross design
QTL into the model in mapping endosperm traits. As in inferring the conditional probabilities. As these
con-a result, the proposed method ccon-an provide grecon-ater ditional probabilities are the mixing proportions in the
power and precision, and it can readily analyze and normal mixture likelihood, they play a very important
search for epistatic QTL in endosperm trait mapping. role in the quality estimation of QTL parameters for
Besides, the estimation procedures between these meth-the model. A more informative design or population
ods are different. The likelihood of the MIM-based can provide more detailed information in inferring the
method is a mixture of 4m normals and will become
conditional probabilities and thus can help improve the
increasingly unwieldy in maximization as the number estimation of QTL parameters. This argument can
ex-of QTL (m) fitted into the model increases. To solve
plain the reasons why the performance of the triploid
the maximization problem with large m, the general
method is generally poor under the one-stage design
formulas proposed byKaoandZeng(1997) are applied
in the backcross population as compared to the
perfor-to obtain the MLE of QTL effects as well as their vari-mance under another data structure (see, for example,
ance-covariance matrix (seethe mim model for
map-the simulation results in Tables 1 and 2 when map-the additive
ping endosperm traits). The procedure of the general and dominance effects are in the opposite directions) and
formulas is a maximum-likelihood approach based on why the triploid method under the two-stage design can
the EM algorithm. The method by Xu et al. uses an
perform well with satisfactory power and precision in all
iteratively reweighted least squares (IRWLS) procedure, the parameter settings. The two-stage design generally
which is a second-order approximation to the maximum requires more genotyping work as both the genomes
likelihood, and it has problems in estimating the two of the plants and their seeds need to be genotyped, and
dominance effects separately as pointed out by Xuet al.
different sampling strategies for allocations of a given
The estimation procedure in Wuet al.also implements
sample size between the two generations should be
con-a mcon-aximum-likelihood con-approcon-ach vicon-a the EM con-algorithm,
sidered for cost control. Besides,Wuet al.(2002b) also
but it needs additional procedures in the M-step to pointed out that the different sampling strategies for
obtain the MLE if some QTL effects are not considered allocations can affect the parameter estimation.
There-in the model (seeappendix binWuet al.2002b). The
fore, the best strategy of allocation for the two-stage design
general formulas, however, do not have these problems under the consideration of cost and estimation deserves
and are relatively straightforward and simple to max-further investigation in practical QTL mapping.
imize. An initial version of the triploid MIM program The traditional diploid methods proposed for
Churchill, G. A., and R. W. Doerge, 1994 Empirical threshold
on the worldwide web (http://www.stat.sinica.edu.tw/
values for quantitative trait mapping. Genetics138:967–971.
chkao/). Dempster, A. P., N. M. LairdandD. B. Rubin, 1977 Maximum
It has been pointed out that the critical value for likelihood from incomplete data via the EM algorithm. J. R. Stat.
Soc.39:1–38.
claiming QTL detection is a very complicated issue and
Gale, M. D., 1976 High␣-amylase breeding and genetical aspects
deserves further investigation (Lander andBotstein of the problem. Cereal Res. Commun.4:231–243.
1989;Jansen1993;Zeng1994;Kaoet al.1999). Gener- Haldane, J. B. S., 1919 The combination of linkage values and the
calculation of distances between the loci of linked factors. J.
ally, the critical value depends on the number and size
Genet.8:299–309.
of intervals, different levels of heritability (size of QTL), Haley, C. S., andS. A. Knott, 1992 A simple regression method
different numbers of (linked or unlinked) QTL, and for mapping quantitative trait loci in line crosses using flanking
markers. Heredity69:315–324.
linked QTL in the same or opposite direction of effects.
Jansen, R. C., 1993 Interval mapping of multiple quantitative trait
VisscherandHaley(1996) pointed out that the
criti-loci. Genetics135:205–211.
cal value should be reduced after a QTL of large effect Kao, C.-H., and Z-B.Zeng, 1997 General formulas for obtaining the
has been detected. The determination of critical value MLEs and the asymptotic variance-covariance matrix in mapping
quantitative trait loci when using the EM algorithm. Biometrics
in mapping endosperm traits will be more complicated
53:359–371.
as each QTL can have three possible effects and many Kao, C.-H., and Z-B.Zeng, 2002 Modeling epistasis of quantitative
different types of epistasis, and more different experi- trait loci using Cockerham’s model. Genetics160:1243–1261.
Kao, C.-H., Z-B.Zengand R. D.Teasdale, 1999 Multiple interval
mental designs (the one-stage or two-stage design with
mapping for quantitative trait loci. Genetics152:1203–1216.
different allocations in the backcross or F2population)
Lander, E. S., andD. Botstein, 1989 Mapping Mendelian factors
can be considered. In this article, the permutation tests underlying quantitative traits using RFLP linkage maps. Genetics
byChurchillandDoerge (1994) are used to deter- 121:185–199.
Lou, X.-Y., andJ. Zhu, 2002 Analysis of genetic effects of major
mine the critical value for claiming QTL detection in
genes and polygenes on quantitative traits. II. Genetic models
endosperm trait mapping. It is found that the critical for seed traits of crops. Theor. Appl. Genet.105:964–971.
value for the triploid model in the two-stage design is Louis, T. A., 1982 Finding the observed information matrix when
using the EM algorithm. J. R. Stat. Soc. Ser. B44:226–233.
larger than that in the one-stage design (Tables 1 and
Mazur, B., E. KrebberandS. Tingey, 1999 Gene discovery and
2). Given the same heritability, the critical value in the
product development for grain quality traits. Science285:372–
F2population is larger than that in the backcross popula- 375.
Mo, H.-D., 1987 Genetic expression for endosperm traits, pp. 478–
tion except for the third setting. More efforts are needed
487 inProceedings of the Second International Conference on Quantita-to unravel the issue of critical value in mapping
endo-tive Genetics, edited byB. Weir, E. J. Eisen, M. M. Goodmanand
sperm traits. The understanding of QTL underlying the G. Namkoong.Sinauer Associates, Sunderland, MA.
endosperm traits is very important to cereal breeding in Pooni, H.-S., I. KumarandG. S. Khush, 1992 A comprehensive
model for disomically inheritant metric traits expressed in
trip-improving yield potential and grain quality. This
MIM-loid tissues. Heredity69:166–174.
based triploid method can serve as an effective tool to
Sadimantara, G. R., T. AbeandT. Sasahara, 1997 Genetic analysis
estimate the parameters associated with the underlying of high molecular weight protein in rice (Oriza sativaL.)
endo-sperm. Crop Sci.37:1177–1180.
QTL in mapping endosperm traits. Another important
Stuart, A., and J. K.Ord,1991 Kendall’s Advanced Theory of Statistics,
issue worth pursuing is to investigate the properties of
Ed. 5, Vol. 2. Oxford University Press, New York .
different genetic models in mapping endosperm traits. Tan, Y. F., J. X. Li, S. B. Yu, Y. Z. Xing, C. G. Xuet al., 1999 The
Besides, several researchers (Zhu and Weir 1994; three important traits for cooking and eating quality of rice grains
are controlled by a single locus in an elite rice hybrid, Shanyou Mazuret al.1999;van der Meeret al.2001;Wuet al.
63. Theor. Appl. Genet.99:642–648.
2002b;Xuet al.2003) have pointed out that the mater- van der Meer, I. A., A. G. BovyandD. Bosch, 2001 Plant-based
nal and offspring genomes could jointly affect the seed- raw material: improved food quality for better nutrition via plant
genomes. Curr. Opin. Biotech.12:488–492.
or endosperm-specific traits. Therefore, it is important
Visscher, P. M., andC. S. Haley, 1996 Detection of the putative
to take the genome information about the two successive
quantitative trait loci in line crosses under infinitesimal genetic
generations into account in mapping those traits and, models. Theor. Appl. Genet.93:691–702.
more importantly, to do so on the basis of a multiple- Wang, X.-L., andB. A. Larkins, 2001 Genetic analysis of amino
acid accumulation in opaque-2 maize endosperm. Plant Physiol.
QTL model approach.
125:1766–1777.
The author is grateful to two anonymous reviewers for helpful Wang, X.-L., Y.-M. Woo, C.-S. KimandB. A. Larkins, 2001 Quantita-comments and to Pei-Ying Shih and Chu-Chun Chen for the derivation tive trait locus mapping of loci influencing elongation factor 1 alpha content in maize endosperm. Plant Physiol.125: 1271– of variance components. This work was supported by grants
NSC92-1282. 2118-M-001-038 from the National Science Council, Taiwan, Republic
Wu, R.-L., X.-Y. Lou, C.-X. Ma, X. Wang, B. A. Larkinset al., 2002a
of China.
An improved genetic model generates high-resolution mapping of QTL for protein quality in maize endosperm. Proc. Natl. Acad. Sci. USA99:11281–11286.
Wu, R.-L., C.-X. Ma, M. Gallo-Meagher, R. C. Littell and G.
LITERATURE CITED Casella, 2002b Statistical methods for dissecting triploid
endo-sperm traits using molecular markers: an autogamous model.
Benner, M. S., R. L. Philips, J. A. KiriharaandJ. W. Messing, 1989
Genetics162:875–892. Genetic analysis of methionine-rich storage protein accumulation
Xu, C., X. HeandS. Xu, 2003 Mapping quantitative trait loci
under-in maize. Theor. Appl. Genet.78:761–767.
lying triploid endosperm traits. Heredity90:228–235.
Bogyo, R., C. M.Lance, P.Chevalierand R. A.Nilan, 1988
Ge-Zeng, Z-B., 1994 Precision mapping of quantitative trait loci.
Genet-netic models for quantitatively inherited endosperm characters.