2017 2nd International Conference on Manufacturing Science and Information Engineering (ICMSIE 2017) ISBN: 978-1-60595-516-2
Research on Underwater Target Detection
Based on Wavelet Transform
Haitao Zhao, Yishuo Tong and Wenrui Hou
ABSTRACT
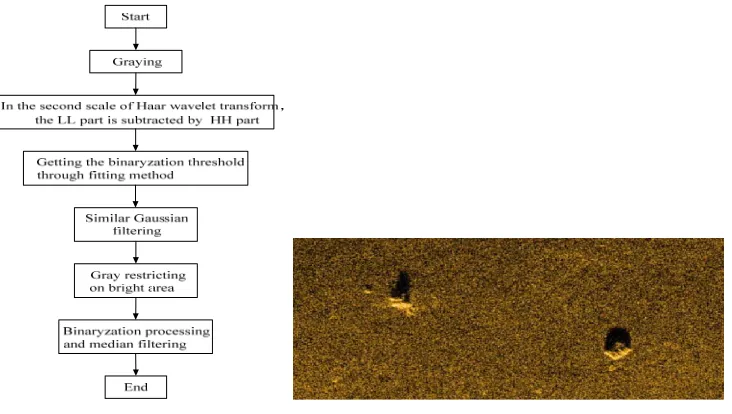
For poor target segmentation effect, the fewer detail features of underwater target are always lost in Fourier transform. According to amounts of analyzing statistical, a new underwater target detection method based on wavelet transform is proposed in the paper. First of all, multi-resolution processing of Haar wavelet transform is used to retain target features. Then, fitting an exponential function to confirm the initial smoothing interval and calculating the binary processing threshold through iteration. Thirdly, a statistical eight neighborhood grey information method is used to restrain the interferences around the targets. Finally, according to the above threshold ,the small man-made target could be detected from the background. The processing result is satisfied after a median filtering.1
INTRODUCTION
In sonar image, the small sunken man-made targets are always imagined at short range, which means some morphological features and target de-tails are retained. So it is easier for the targets to be segmented from the background than the long range target. But some parts of the small sunken man-made targets are always cover by the silt. The outline shape can be hardly distracted completely. Meanwhile, for the sake of the manufacturing material characteristic, the men-made target appears as high-luminance district in sonar image, which is very different from the nearby background. So the frequency domain of this image can be used to analyze. But in
1Haitao Zhao, Naval Electromechanical System Representation Bureau in Nanjing, Nanjing, Jiangsu, China.
Yishuo Tong, Naval University of Engineering, Wuhan, Hubei, China.
the mean-time, for the short range imaging, some rocks and silt also shows high-luminance district, which is only a little different from the men-made targets. As a result, the target segmentation effect would be influenced. In this condition, filtering the interferences must be taken into the consideration when designing the tar-get segmentation method.
In the past years, Fourier transform is the theory fundamental of the transform domain image process. It is convenient for the researcher to design the algorithm in frequency domain. But Fourier transform only provides the frequency information. Some important partial data might be lost in the transforming process. The wavelet transform contains changing frequency and limited lasting time. It is a signal time scale analyzing method. It is also a multi-resolution method, which has higher frequency resolution and lower time resolution in low frequency segment while higher time resolution and lower frequency resolution in high frequency segment. It's quite fit for detecting normal signal which carries transient abnormal phenomena and showing its components[1-3]. Above all the theory analysis, in order to improve
[image:2.612.121.487.456.663.2]Haar Wavelet Transform
In figure 2, it is an original image data from high resolution imaging sonar. After the fundamental graying process, the image could be transformed by wavelet. In the paper, the Haar wavelet is taken because it is an ancient and easy orthogonal wavelet. The matrix form is as followed[4]:
T
T HFH (1)
Where:
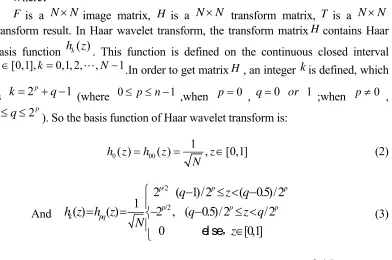
F is a N N image matrix, H is a N N transform matrix, T is a N N transform result. In Haar wavelet transform, the transform matrixHcontains Haar basis function ( )h zk . This function is defined on the continuous closed interval
[0,1], 0,1, 2, , 1
z k N .In order to get matrixH, an integer kis defined, which
is k2p q 1 (where 0 p n 1 ,when p0 , q0 or 1 ;when p0 ,
1 2p
q
). So the basis function of Haar wavelet transform is:
0 00
1
( ) ( ) , [0,1]
h z h z z
N (2) And /2 /2
2 ( 1)/2 ( 0.5)/2
1
( ) ( ) 2 , ( 0.5)/2 /2
0 [0,1]
p p p
p p p
k pq
q z q
h z h z q z q N z
el se,
(3)
The ith row of Haar transform matrix contains element h zi( ) ,in which
0 / ,1/ , 2 / , , ( 1) /
z N N N N N.For example, when N 4,the respective value
of ,k p and q are as followed in table 1:
[image:3.612.106.498.217.477.2]Haar transform is discrete. After the image data is decomposed in multi-resolution by Haar basis function, the pixel number of the result is the same as that of the original image data. In addition, there are still three advantages: Firstly, the partial statistical is relatively stable and the mathematical model is easy to establish. Secondly, most pixels‘ value is close to 0 ,which is convenient for subsequent image compression. Thirdly, it is possible to find much more feature details in the processed image than in the original image[5-8].
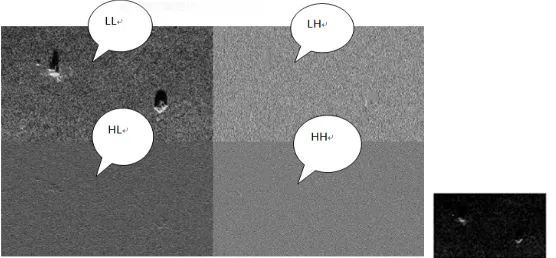
The result of Haar wavelet is four images, which is reduced to 1/4 of the original image(showed in figure 3). The small image in upper left corner can be regarded as the filtered result of the original image. It is also the low frequency information that contains large amount of original information. The small image in lower left corner is HL image(H means horizontal high frequency information, L means vertical low frequency information); The upper right is LH image, which represents horizontal low frequency and vertical high frequency information. And the lower right is HH image, which means horizontal and vertical high frequency information. To be clear: the essence of HH image is doing horizontal and vertical subtraction on all the original image neighborhood. And the LL image is opposite, which represents addition operation. It is similar to the mean filtering result. Then, the relative normalized HH image data is subtracted from LL image data[9]. After that, the target with more clearer edge could be got.
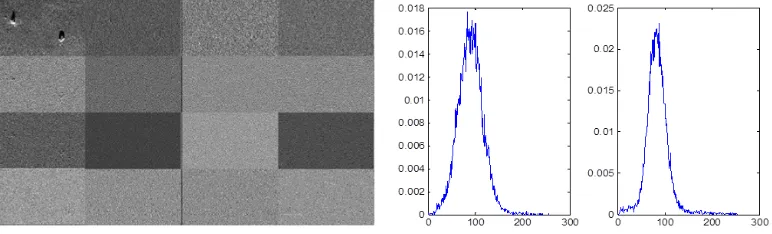
[image:4.612.101.449.86.167.2] [image:4.612.162.440.513.642.2]Suppose the target is completely white and the pixel value is 255. The background is completely black and the pixel value is 0. Under these circumstances, the only difference between LL image and the original image is just size. And in the HH image , the target edge is clear and all the other place is in the same color. So after the HH image data is subtracted from the LL image data, the target edge could be more clearer(showed in figure 4). In order to further highlighten the target edge, two times of Haar wavelet transform is used in the proposed method. The second layers of the Haar wavelet transform is in figure 5.
Figure 5. The second layers of the Haar wavelet. Figure 6. The histogram of two images.
Binary Processing Threshold
With the above processed result, a threshold based on the histogram is needed to carry on binary processing for the sonar image to segment the targets. For the direct result of the Ostu algorithm is very rough, so after every image data is processed by Ostu algorithm, a derivative on the histogram is estimated. The respective histograms of two images are showed in figure 6. Then, the gray value on the histogram that is relevant to the derivative is used as the binary processing threshold[10].
[image:5.612.108.479.402.523.2]
Figure 7. The smoothing process. Figure 8.The final smoothing result.
the new inflexion points. And the inflexion points are taken as the boundary points of the new interval in next round of iterations. In figure 7, the red and green lines represent different intervals. As the iteration keeps happening, the interval is becoming smaller and smaller. The final smoothing result is showed in figure 8.
In order to use the above algorithm, how to determine the initial interval is very important. The gray value difference and the peak amount of the peak and the position after peak 1/4 times are taken as the parameters to confirm the initial interval. Under the principle of the steeper the curve, the thinner the interval, a function of exponential style is fitted. The independent variable refer is as followed:
0.75
(0.25 )- ( )
PeakVal refer
f PeakVal relevant percentage f PeakVal relevant percentage
(4)
The histogram peak is PeakVal , the histogram relation is supposed as
( ), 1
gray f p p ,p is the area under histogram curve whose gray value is lower than gray.The function value is the initial interval size. The fitting result is as followed:
50 0.8091 exp( 1766 ) 3
nScale refer (5)
According to large amount of calculating and analyzing on this kind of sonar images, the initial interval are always fluctuating at 24.
Interference Restriction
In the experiment, we found that if the threshold calculated in the previous section is directed used to segment the image, there would be amounts of interferences appeared in the image. The reason for this phenomenon is possibly that there are larges area of bright interferences, whose light is similar to the target, such as in figure 9. These interferences need to be eliminated specially. In the paper, the whole image is divided into multiple grids( The grid area is a little bigger than the target). And the average of every grid is calculated. Then, in the eight neighborhood of every grid, if the number of a grid with similar gray value is more than three, that grid’s gray value is reduced by half[11-15]. The result after the interference restriction is showed in figure 10. The block of dark area is the area that has been restricted.
Figure 9. the original sonar image. Figure 10. the interference restriction result.
[image:7.612.98.504.373.521.2]Figure 11. the result. Figure 12. the result.
TABLE 2. THE CALCULATING SPEED OF THE FIRST 20 TIMES.
Sequence 1 2 3 4 5 6 7 8 9 10 Average times /s
Operating
time/S 24.0 23.3 23.7 22.8 23.0 23.0 23.2 23.0 23.1 23.1 23.2
Sequence 11 12 13 14 15 16 17 18 19 20 Average times /s
Operating
time/S 23.2 23.1 23.5 23.3 23.1 23.24 23.41 23.00 23.06 23.27 23.2
CONCLUSIONS
In order to verify the engineering value of the algorithm proposed, the algorithm operational stability, the memory usage rate and the calculating speed are all testified. The testing object is a synthetic sonar image data with the size of 8800×
5760 and 464MB. The computer configuration is: a Lenovo laptop, Windows 7 operating system, Intel (R) Core(TM)i5-3337U CPU @ 1.80GHz,4.00 G memory (3.88 GB available). The operating software is Visual Studio 2008.
maintained in a stable range, the algorithm is considered stable. The algorithm is repeatedly operated 200 times.
From the table 2, the operating speed could be controlled below 24 seconds in a personal PC, it means the algorithm could be used as the post-processing module in a imaging sonar underwater men-made target detection system. If the algorithm can operate on a higher computer workstation, it is much more possible to increase the speed. For the hardware limitation, there is no more tests in the pa-per. Additionally, the binary processing threshold is statistically calculated from the image histogram information, it is common for the same kind of data source. But when a new image data is much different from this kind of image data, it is essential to fit a new mathematical function to confirm the threshold.
REFERENCES
1. Sun Hongjin. Image Multiresolution Decomposition and Reconstruction Based on Haar Wavelet [J]. Coal Technology, 2010, 29 (11): 157-159.
2. Xu Zhi Ping, Zhang Hai Chao. Face recognition based on Haar wavelet transform and block DCT [J]. Image Processing and Multimedia Technology, 2009, 21: 25-28.
3. Wang Lejia, Wang Xin. Double Haar wavelets based edge detection [J]. Mathematical Application, 2009, 21: 25-28.
4. Rafael C. Gonzalez, Richard E. Woods. Digital Image Processing [M]. 2nd Edition. Tennessee: Pearson Education, 2002.
5. Zhao Guangchao, Xiao Bin, Guo Chuang, Gao Fengshun. The image denoising based on wavelet analysis [J]. Image Processing and Multimedia Technology, 2011, 30(19): 35-37.
6. Sang Enfang, Shen Zhengyan, Gao Yunchao. Adaptive sonar image enhancement in the wavelet domain [J]. Journal of Harbin Engineering University, 2009, 30 (4)): 411-416.
7. Li Qingwu, Ma Guocui, Huo Guanying. New segmentation method of side-scan sonar image based on edge detection in NSCT domain [J]. Chinese Journal of Scientific Instrument, 2013, 34(8): 1795-1801.
8. Liu Guangyu, Bian Hongyu, Shen Zhengyan, Shi Hong. Sonar image spectral matting segmentation based on normalized cut [J]. Journal of Harbin Engineering University, 2012, 33(3): 308-312.
9. Liu Guangyu, Bian Hongyu, Shen Zhengyan, Shi Hong. Research on level set segmentation algorithm for sonar image [J]. Transducer and Microsystem Technologies, 2012, 31(1): 29-31. 10. Li Juanjuan, Ma Shuo, Zhu Feng, Hao Yingming, Gao Lei. Recognition method of mine in sonar
image based on active contour [J]. Application Research of Computers, 2014, 31(12): 3841-3844. 11. Zhao Chun-hui, Ma Mei-zhen, Shang Zheng-guo. Sonar image recognition based on lifting
scheme and fractal dimension [J].Technical Acoustics, 2007, 26(5): 811-816.
12. Fu Xiao, Chen Liuwei, Sun Yanjun. A Threshold De-noising Algorithm Based on Wavelet Analysis [J]. Artificial Intelligence and Identification Techniques, 2012, 04: 90-91.
13. Liu Guangyu, Bian Hongyu, Shihong. Sonar image segmentation based on spectral matting using morphological operations [J]. Journal of Jilin University, 2012, 42(1): 228-233.
14. Wang Chao, Jiang Keyu. An Image Segmentation Method For Mine Detecting Sonar Image [J]. Command Control & Simulation, 2012, 34(4): 128-131.