Study of Shock-Wave Boundary-Layer Interaction Control Using an Array
of Steady Micro-Jet Actuators
S.B.Verma†, Manisankar, C.‡
and Akshara, P
§Council of Scientific and Industrial Research, National Aerospace Laboratories,
Experimental Aerodynamic Division, Bangalore – 560017, INDIA
Abstract
An experimental investigation was conducted to control the amplitude of shock unsteadiness associated with the interaction induced by a (i) 24o compression corner and, (ii) a cylindrical obstruction on a flat plate in a Mach 2 flow. The control was applied in the form of an array of steady micro air-jets of different configurations with variation in pitch angle (β) and skew angle (α) of the jets. The overall flow interaction gets modified for all control configurations and shows a reduction in both separation- and bow-shock strengths and in triple-point height. A significant reduction in σmax /Pw
value is also observed in the intermittent region of separation for each case. On the other hand, pitching or skewing the jets to 45o or both reduces the obstruction component considerably that initially, at lower control pressure, shows lower effectiveness (relative to 90o pitched jets). But at higher control pressure, the effectiveness of these configurations continues to increase unlike the 90o pitched jets.
I. Introduction
Shock-wave boundary-layer interactions (SWBLI) in supersonic flows are initiated by the strong adverse pressure gradient imposed by the interacting shock on the incoming boundary-layer that leads to flow separation. The process of separation in supersonic flows is generally associated with low-frequency oscillations of the separation shock (with frequencies lower than the temporal scales of the incoming flow [1-2]) resulting in an increase in flow unsteadiness in the region of influence (which increases with increase in shock strength or intensity [2]). As such the region of flow interaction is subject to increased aerodynamic drag, heat transfer and unsteady pressure loads, and hence are important design factors. Recently, exploratory studies have been carried out to diminish the detrimental effects of Shock-wave boundary-layer interactions (SWBLI) using flow control by altering the characteristics of the incoming boundary-layer such as introducing fullness to the velocity profile. In general, flow control techniques rely on the generation of vortices near the wall by the use of either static systems or mechanical vortex generating (VG) devices such as micro-ramps, vane-type VG fixed at an angle to the main flow [3-5], steady micro air-jets [6-8] or pulsed-jets using actuators,
† Principal Scientist, Experimental Aerodynamics Division, NAL Bangalore – 560017, Email:
Scientist, Experimental Aerodynamics Division, NAL Bangalore – 560017, Email: [email protected] § Masters Student, PGRPE, ACSIR, NAL Bangalore
at an appropriate distance upstream of the region of interaction. The aim in either case is to reduce the shock strength and hence, reduce wave drag or reduce the extent of separation with the aim of reducing shock unsteadiness or both [3-8].
The present paper reports the results of an exploratory study conducted to control the amplitude of shock unsteadiness associated with the SWBLI on a (i) 24o compression corner and, (ii) cylindrical obstruction using an array of steady micro air-jets of different configurations.The primary objective was to study the effect of (i) pitch angle (β) of micro air-jets and, (ii) air-jet supply pressure, Poj, on
the amplitude of pressure fluctuations in the intermittent region of separation. Detailed investigation of the interaction is made using color-schlieren, real-time pressure measurements using fast piezo-resistive Kulite pressure sensors and surface-oil visualization.
II. Experimental Set Up and Procedure A. Wind Tunnel Facility and Model Details
Tests were conducted in the 0.46m×0.3m blow-down tri-sonic wind-tunnel at National Aerospace Laboratories (NAL). The compression corner (CC) and the cylindrical protuberance (CP) model were mounted on a sting along the tunnel centerline in order to avoid effects of noise levels from turbulent boundary-layer generally present on wind-tunnel walls. The freestream Mach number (M∞) was
2.05±0.02 for the CC tests and 2.18±0.02 for CP tests. The stagnation pressure (P0) was 208.5kPa±2%
(absolute) and 275.8±1.2%, respectively while the stagnation temperature was 298K±0.4%. The wall temperature was approximately adiabatic. The flat plate of the model is 28cms long with a span of 11cms, Fig. 1. The Reynolds number based on the plate length distance is 7.07×10⁶. No side-fences are used in order to facilitate schlieren imaging. A boundary-layer trip, made of 60 grit carborundum particles spanning 4mm in length and placed at 17mm from the leading edge, Fig. 1, is used to ensure sufficiently thick turbulent boundary-layer.
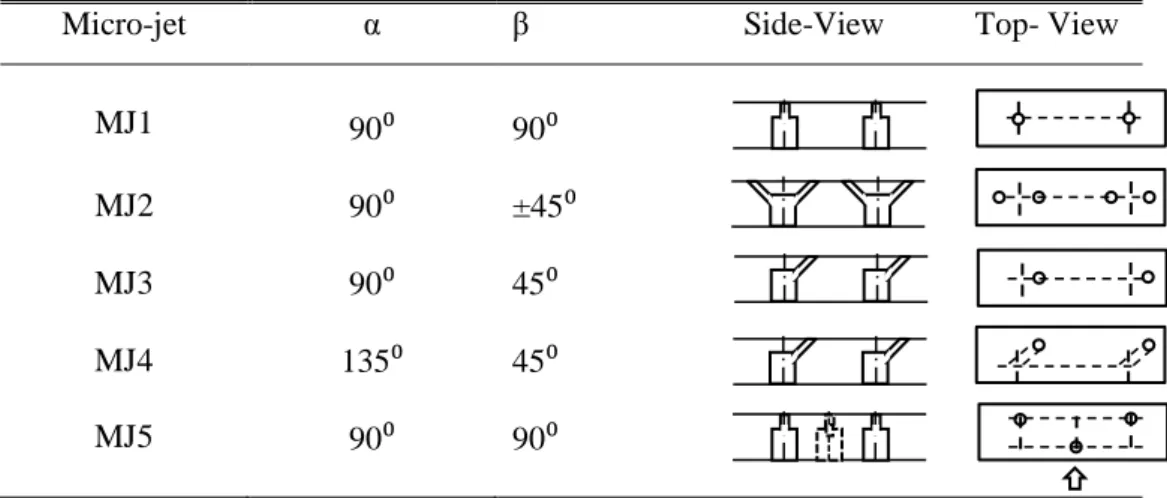
Control devices in the form of an array of steady sonic micro air-jets are used to modify the flow interaction. Figure 2 shows the schematic of a micro-jet (MJ) configuration while Table 1 shows the different configurations tested. These configurations were primarily chosen to study the effect of pitch angle (β) of air-jets in controlling the amplitude of shock unsteadiness in the intermittent region of separation. Here the pitch angle, β, is defined [21] as the angle between the jet-hole centerline and the wall while the skew angle (α) can be thought of as the angle between the major axis of the ellipse and the streamwise direction, Fig. 3. These MJ devices are introduced 12.5δ and 20δ upstream of the compression corner (ramp angle θ =24o) and the CP model, as shown in Figs. 1, where the boundary-layer thickness (estimated from schlieren pictures) is approximately 3.85mm. During estimation of δ from schlieren images, an error of ±0.02 to ±0.03 is encountered (since each pixel in the image represents a certain dimension). The freestream velocity, Ue, of the cross-flow was 523ms-1. The
from 1.25×10⁴ to 5.83×10⁴ for the range of Poj tested. Table 2 shows the flow details related to micro
air-jets in Mach 2 flow (P∞=23kPa). The level of under-expansion (Pj /P∞) varied from 3.2 to 14.3
while the momentum flux ratio (q) varied from 0.77 to 3.43, respectively, for the range of Poj tested.
The array of micro jets was supplied with dry nitrogen gas through 8 polyamide tubes of 3mm diameter each plugged into a stagnation chamber (to avoid air-jet differences). Simultaneous wall pressure measurements along the centerline were made using fast piezo-resistive transducers (Kulite model XCQ-093). According to the manufacturer’s specifications, these transducers have a natural frequency of approximately 250kHz. The sensitivity of the transducers is typically 3-4mV/psi. These transducers were calibrated statically. The transducer data was acquired using truly simultaneous data acquisition card NI4495 DC series (with 24-bit resolution) at a sampling frequency of 50kHz. Each sensor was powered by a DC power supply, and the signal was passed through an amplifier and a signal conditioner. A low-pass filter of 20kHz was applied during data processing. For each transducer channel, 200 records of 4096-point were acquired yielding a total of 819,200 data points per channel per tunnel run. For spectral analysis, a 4096-point narrowband fast Fourier transform (FFT) was performed and later averaged for 200 records, giving a frequency resolution of 12.2Hz. A total of 15 kulites were used for the CC tests while for CP tests, a total of 22 mean pressure ports and 8 kulite transducers were used.
The Schlieren system used in the study is a Z-type setup where the continuous illumination source is provided by a Halogen lamp (250W) light source (with an effective light source slit of 1mm width), and uses two 3.0 m focal length spherical mirrors to collimate and refocus the illumination source at the knife-edge location. A vertical band RGB color filter was used at the knife-edge location and ahead of the camera to capture the flow-field interaction. The color filter was adjusted in a way that the green color represents refractive index gradient near zero. Color schlieren images were captured using a Nikon 1X digital camera with a 300mm zoom lens. The exposure time was set at 125μs. A mixture of titanium dioxide (TiO2) powder and vacuum pump oil with a few drops of oleic acid (to
improve the dispersion of the pigment in oil) is used for surface oil visualization. The mixture was then sprinkled on the model using a tooth brush.
III. Results and Discussion
Figures 4 and 5 show the schlieren images of the SWBLI on a flat plate with a CC and CP models with no control and with control, respectively. It can be seen that relative to no control, the severity of the interaction is considerably reduced with control. The separation shock distance as well as the height of the triple point is seen to get reduced when control is applied. Such modifications in the overall interaction are also seen with all other micro-jet configurations used.
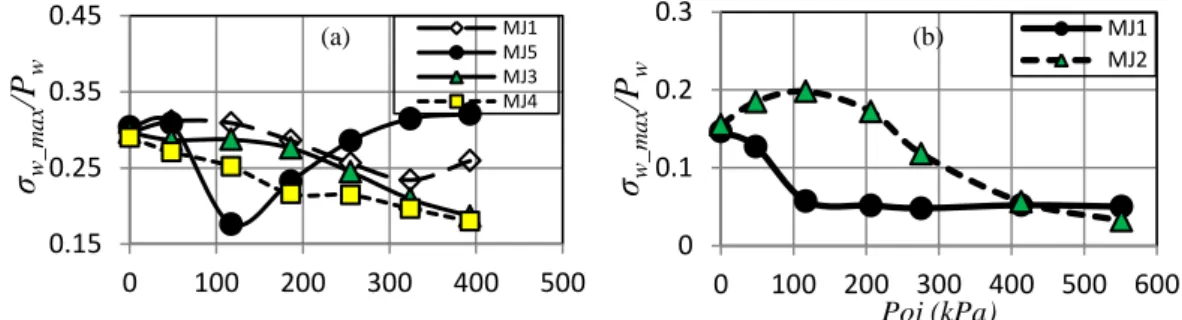
Figure 6 (a) and (b) shows the variation of maximum rms (σw_max /Pw) as a function of micro-jet
control pressure (Poj) for SWBLI on a compression ramp and a cylindrical protuberance models,
respectively. Here, σw_max /Pw represents peak in streamwise distribution of rms value that is
experienced in the intermittent region of separation. For the CC model, the MJ1 configuration as opposed to MJ2 seems to be very effective in bringing down the amplitude of separation shock oscillations by almost 65% when Poj equivalent to the stagnation pressure of the flow (117kPa) is
applied. The effectiveness of the MJ control can also be seen for the flow interaction with a CP model. Almost all types of MJ configurations show good control with increasing Poj value. The
staggered 90o pitched micro-jets however show the best control (40% reduction) at Poj =117kPa after
which the effectiveness is seen to get lost gradually. One reason for the latter could be the closely spaced jets in staggered mode which on increasing Poj form a corrugated shock in lateral direction
thereby reducing the overall effectiveness. As a result the spacing (λ) between the jets is an important parameter and needs to be studied.
Applying control helps to reduce the amplitude of pressure fluctuations in the separation location for both MJ configurations, Fig. 7 (a) and 7 (b), and is seen to drop significantly with increase in Poj. This
trend is consistent with the results of shock unsteadiness shown in Fig. 6 (a). A comparison of the general trend of the spectra for each case shows that as compared to MJ2 configuration, MJ1 is more successful in reducing the amplitude of fluctuations as soon as control is applied in CC which is also consistent with the results of shock unsteadiness. The variation in the spectral content for the CP model test configurations also show reduction in the amplitude of shock oscillations for frequencies less than 1kHz. The effect of MJ pitch and skew angle is clearly seen. The MJ5 configuration, as seen in Fig. 8 (a), shows the best ability for control at Poj =208kPa. The trends change with increase in
control pressure (Figs. not shown). On the other hand, an increase in Poj continues to improve the
control effectiveness of MJ3 configuration, Fig. 8 (b), as discussed earlier.
IV. Conclusions
An experimental study was conducted to investigate the ability of micro-jets in controlling the amplitude of shock unsteadiness associated with the interaction induced by a (i) 24o compression corner and, (ii) a cylindrical obstruction on a flat plate using an array of steady micro air-jets of different configurations. The main objective was to study the effect of (i) pitch angle (β) and skew angle (α) of micro air-jets and, (iii) air-jet supply pressure, Poj, in controlling the amplitude of
pressure fluctuations in the intermittent region of separation.
For all MJ configurations, relative to no control, the separation shock is seen to move downstream with a consequent reduction in the height of the triple point. For the CC induced interaction, although separation shock does not move further downstream, the height of the triple point continues to
decrease with increase in Poj. However in the case of CP induced interaction, the separation shock
continues to move downstream along with a reduction in triple-point height with increase in Poj.
Further, with control, a significant reduction in both separation- and bow-shock strengths is seen for the CP interaction. A significant reduction in σmax /Pw value is also observed in the intermittent region
of separation for each case. A maximum of 67% reduction in σmax /Pw value is observed for the CC
induced interaction while a 40% reduction is observed for the case of cylindrical protuberance.
Micro-jet control has shown to be a very effective flow control system that helps to reduce the amplitude of shock oscillations significantly. The pitch and skew angles along with the jet spacing are important parameters that need more thorough investigation for optimization of such controls.
Acknowledgements
The authors wish to thank the Aeronautical Research and Development Board (AR&DB) of India for supporting this project. The technical support of Mr. Ravi Dodamani during the model design and fabrication and of Mr. Perinaygam, Mr Janardhan and Mr. Muthuswamy, staff of the 0.3m wind tunnel facility at NAL during the test campaigns, is gratefully acknowledged. Special thanks to Mr. Gangadhar, Mr. Shanmogan and Mr Charan Singh of NAL model shop Belur for model fabrication.
References
[1] Kistler, A.L., ``Fluctuating Wall Pressure Under Separated Supersonic Flow’’, Journal of Acoustical Society of America, Vol. 36, March 1964, pp. 543-550.
[2] Dolling, D.S. and Murphy, M.T., ``Unsteadiness of the Separation Shock Wave Structure in a Supersonic Compression Ramp Flowfield,’’ AIAA Journal, Vol. 21, No. 12, 1983, pp.1628-1634. [3] Blinde, P.L., Humble, R.A., Oudheusden, B.W. and Scarano, F.,``Effects of Micro-Ramps on a Shock Wave/Turbulent Boundary Layer Interaction’’, Shock Waves, Vol. 19, pp. 507-520, 2009 [4] S.B.Verma, Manisankar, C. and C. Raju,`` Control of Shock Unsteadiness in Shock Boundary-Layer Interaction on a Compression Corner Using Mechanical Vortex Generators’’, Shock Waves, Vol. 22, Issue 4, July 2012, pp. 327-339, DOI 10.1007/s00193-012-0369-8
[5] Babinsky, H., Makinson, N.J. and Morgan, N.J.,``Micro-vortex Generator Flow Control for Supersonic Engine Inlets’’, AIAA Paper 2007-0521.
[6] Szwabe, R.,``Shock Wave Induced Separation Control by Streamwise Vortices’’, Journal of Thermal Sciences, Vol. 14, No.3, 2005, pp. 249-253.
[7] Souverein, L.J. and Debiève, J.-F,``Effect of Air Jet Vortex Generators on a shock wave Boundary Layer Interaction, Experiments in Fluids, Vol. 49, 2010, pp. 1053-1064.
[8] S.B.Verma and Manisankar,``Shock-Wave Boundary-Layer Interaction Control on a Compression Ramp using Steady Micro Air-Jets’’, AIAA Journal, Vol. 50, No. 12 (2012), pp. 2753-2764. doi: 10.2514/1.J051577
L2 = 120 L3 = 100 micro-jet array 17 k1 k2 k3 k4 k5 k6 k7 k8 k12 flow base plate section
ramp section leading edge section trip
X Y L1=160 50 12.5δ L2 = 160 17 k1 k8 k6 flow
base plate section
trip
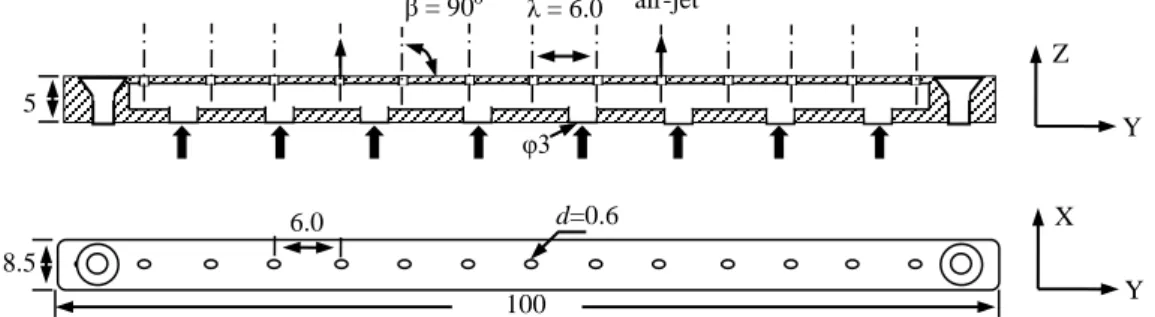
leading edge section X Y L1=160 78 or 20 δ micro-jet array 8.5 100 X Y 6.0 d=0.6 5 φ3 Z Y λ = 6.0 β = 90o air-jet
Figure 2: Schematic of the air-jet vortex-generating set up used in the present study for 90o pitched steady air-jet configuration. All dimensions are in mm
β α jet-hole centerline Z X Y major-axis minor -axis -cross-flow, Ue
Figure 3:
Choice of axis and the co-ordinate system showing the pitch (
β
)
and skew (
α
) angles for AJVG2 configuration
Figure 1: Schematic showing the (a) compression ramp and, (b) cylindrical obstruction model details with the pressure sensor locations; MJ location 12.5δ and 20δ, respectively. All dimensions are in mm
(b) Cylindrical protuberance model assembly (a) Compression corner model assembly
(b) MJ1 interaction shock separation shock additional shock ζ (a) no control separation shock reattachment shock undisturbed b’layer reattached b’layer ζ (c) MJ2 interaction shock undisturbed b’layer separation shock reattachment shock
Micro-jet α β Side-View Top- View
MJ1 90⁰ 90⁰ MJ2 90⁰ ±45⁰ MJ3 90⁰ 45⁰ MJ4 MJ5 135⁰ 90⁰ 45⁰ 90⁰ Poj(kPa) Poj / P∞ Pj (kPa) Pj /P∞ q 139.6 6.07 73.7 3.21 0.77 208.5 9.06 109.6 4.77 1.15 298.2 12.96 157.2 6.85 1.64 367.1 15.96 193.7 8.44 2.03 505.0 21.95 266.1 11.6 2.78 642.9 27.95 328.2 14.3 3.43
Figure 4: Schlieren images of the flow on a compression ramp (a) no control, (b) MJ1 and, (c) MJ2; Poj = 208.5 kPa
Table 2: Micro air-jet flow details in a Mach 2 cross-flow
Table 1: Pitch and Skew Angles of the Micro-Jets configurations
Poj(kPa) Poj / P∞ Pj (kPa) Pj /P∞ q 139.6 6.07 73.7 3.21 0.77 208.5 9.06 109.6 4.77 1.15 298.2 12.96 157.2 6.85 1.64 367.1 15.96 193.7 8.44 2.03 505.0 21.95 266.1 11.6 2.78 642.9 27.95 328.2 14.3 3.43
Figure 5: Schlieren images of the flow on a cylindrical protuberance (d=15.2mm, h=53mm), (a) no control, (b) MJ5 and (c) MJ3; Poj = 256 kPa. (a) no control separation shock bow shock separation bubble MJ injection triple point interaction shock (b) MJ5 (c) MJ3 MJ injection triple point interaction shock h/d=3.4 h/d=3.4 h/d=3.4
1kHz (e) MJ1 (b) MJ2 2kHz
Figure 6: Variation of peak rms value in the intermittent region of separation for (a) a 24deg. compression ramp and, (b) cylindrical protuberance model
Figure 7: Comparison of spectral content in the intermittent region of separation using (a) MJ1 and (b) MJ2; θ=24o compression ramp model
Figure 8: Comparison in the spectral content of the pressure signal in the intermittent region of separation in region1 (X=43mm) showing (a) effect of different MJ configurations (for Poj=208
kPa) and, (b) effect of Poj variation using MJ3 configuration
0.15 0.25 0.35 0.45 0 100 200 300 400 500