RP-HPLC Method Development And Validation For
Simultaneous Estimation Of Metformin And
Teneligliptin In Bulk And Pharmaceutical Dosage Form
Aejaz Ahmed*
1, Khan G.J
2, Tanveer Patel
3, Molvi K.I
4, Ansari Yaasir
5,
1,2,3,4Department of Quality Assurance, Ali-Allana College of pharmacy, Akkalkuwa-425415, North Maharashtra
University, Jalgaon.
5Lecturer at Jamia College of Pharmacy, Akkalkuwa, dist Nandurbar-425415.
Email: [email protected]
Abstract- RP-HPLC method for simultaneous estimation of Metformin hydrochloride (MET) and Teneligliptin (TENE) in tablet dosage form was developed and Validated with latest ICH guidelines. Chromatographic separation was achieved on a BDS hypersil C18, 250 mm × 4.6 mm diameter column, 5µ (particle size), and thermo scientific. The mobile phase comprised of Methanol : Water : OPA (30:70:0.05 v/v/v) (Phosphate buffer pH 3.0 was adjusted with H3PO4) at flow rate of 1 mL/min and all eluents were detected at 242 nm.The retention times were 2.4500 ± 0.10 and 6.6833 ± 0.10 min for Metformin hydrochloride and Teneligliptin respectively. Calibration curves at seven levels for MET and TENE were linear in the range of 50-250 µg/mL and 2-10 µg/mL, with r2 = 0.999, respectively. Accuracy for both MET and TENE were studied in the range of 80-120 % quality control standard levels. Validated method was found to be accurate and reproducible, linear, precise and robust.
Index Terms: HPLC; Metformin; Teneligliptin; Development; Validation.
1. INTRODUCTION:
Teneligliptin hydrobromide hydrate (TENE) is chemically described as {(2S, 4S)-4-[4-(3-methyl-1phenyl-1H-pyrazol-5-yl) piperazin-1-yl] pyrrolidin-2-yl} (1,3-thiazolidin-3-yl) methanone hemipentahydrobromide hydrate is a dipeptidyl peptidase inhibitor. The inhibition of DPP-4 increases the amount of active plasma incretins which helps with glycemic control Metformin hydrochloride (MET) is 1,1-dimethylbiguanide hydrochloride, a biguanide antidiabetic. It is given orally in the treatment of type 2 diabetes mellitus and is the drug of choice in overweight patients.
For effective control of blood sugar in diabetic patients more than one medication is required. TENE shows effective control of blood sugar when combined with MET. Chemical structures of both the drugs are shown in Figure-1 & 2. However, the development of simultaneous estimation of TENE and MET in combined dosage form has not yet been reported by any method. Hence, this method is the first to describe the development and validation of TENE and MET in combined dosage form simpler, sensitive, precise, accurate and cost effective chromatographic methods for the simultaneous determination of TENE and MET in combined tablet formulation.
Literature survey revealed various analytical method validations for metformin including UV-spectrophotometric method with Teneligliptin hydro bromide hydrate1, RP-HPLC with sitagliptine2
RP-HPLC with rosigglitazone3 RP-HPLC with canagliflozin4 RP-HPLC with pioglitazone.
Fig.1 Structure of MET
Fig.2 Structure of TENE
2. MATERIALS AND METHODS:
system. All solvents and reagents were of analytical grade.
Preparation Of Standard Solutions:
Accurately weighed quantity of MET and TENE 500 and 20 mg respectively, was transferred into 100mL volumetric flask, was added 100 and 50 ML respectively, of diluent then sonicated for 10 minutes. Final volume of solution was made up to mark with diluent to get stock solution containing 5 and 0.02 mg/mL respectively of MET and TENE in 100 mL volumetric flask, the resultant stock solution of MET and TENE having strength of 5000 and 200 μg/mL respectively.
Preparation Of Mobile Phase:
Methanol : Water : OPA (30:70:0.05 v/v/v) :30 mL of water added into 70 mL of methanol then adjusted PH at 0.05 using o-phosphoric acid. Sonicate for 30 minute and filter through 0.20 μ size membrane filter. Diluent: Mobile Phase.
Optimization Of Chromatographic Conditions: The chromatographic conditions were optimized by different means (Using different column, different buffer and different mode of HPLC run). The chromatographic elution was carried out in isocratic mode using a mobile phase consisting of Methanol: Water: OPA (30:70:0.05 v/v/v) (Phosphate buffer pH 3.0 was adjusted with H3PO4) and the column was maintained at ambient temperature. The analysis was performed at a flow rate of 1.0mL/min with a run time of 10 min. The eluent was monitored at wavelength of 242nm. The 25μl volume of sample was injected by autosampler.
3. RESULT AND DISCUSSION:
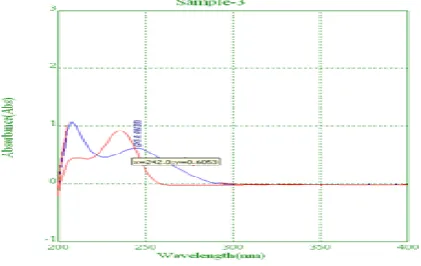
Optimization Of Chromatographic Conditions: The wavelength of maximum absorption for both the drugs MET and TENE observed at 225 nm (λ1) and 242nm (λ2) respectively. The wavelength selected for the determination was 225 nm and 242 nm. A representative chromatogram is shown in Figure-3.
Fig.3 The overlain spectrum of MET and TENE
The column selection has been done by back pressure, resolution, peak shape, theoretical plates and day-to-day reproducibility of the retention time and resolution
between MET and TENE peak. Satisfactory results were found with Thermo scientific BDS Hypersil C18, 250 mm × 4.60 mm, 5µ was selected.
The selection of methanol and buffer were based on chemical structure of both the drugs. Best results were obtained with 0.05 % O-phosphoric acid pH adjusted to 3 that improved the peak shapes of Metformin Hydrochloride and Teneligliptin. For the selection of organic constituent of mobile phase, methanol is chosen to reduce the longer retention time and to attain good peak shape. Therefore, final mobile phase composition consisting of a mixture of buffer-pH 3.0 (0.05% Ortho phosphoric acid): methanol: water (30:70 v/v). Flow rates between 0.5 to1.2 mL/min were tried. Flow rate of 1 mL/min was observed to be enough to get both the drugs eluted with in less than 10 min. the column temperature was set at 30 OC. Optimized method was providing good resolution and peak shape for MET and TENE. Under above described experimental conditions, all the peaks were well defined and free from tailing. The concern of small deliberate changes in the mobile phase composition, flow rates, and column temperature on results were evaluated as a part of testing for methods robustness.
Optimized chromatographic conditions for estimation
of MET and TENE are finalized as shown in Table 1.
The proposed method was validated according to the ICH guidelines for system suitability, Specificity, linearity & Intraday precision .Under the validation study, the following parameters were studied.
System suitability
The Retention time of Metformin Hydrochloride and Teneligliptin using optimum conditions was 2.45min and 6.68min respectively. For two of them, the peak symmetries were <1.5 and the theoretical plates numbers were >2000 and % RSD of areas of six standard injections of MET and TENE was less than 2. These values are within the acceptable range of United States pharmacopoeia definition and the chromatographic conditions. The results obtained are shown in Table 2.
Column
Thermoscientific, BDS hypersil C18,
4.6 x 250 mm, 5μ Flow rate 1.0 mL/min.
Mobile Phase
Methanol : Water : OPA (30:70:0.05 v/v/v)(pH 3.0 by o-phosphoric acid)
Detection 242 nm
Injection
Volume 20 μl Runtime 10 Minute
[image:2.595.76.287.578.711.2]Table 2: Observed system suitability parameter
Sr. No
.
Parameters
MET TENE
1.
Avg. peak area of
standard 1148.65 69.99
2. No. of theoretical plates 2445.4 8916.7
3. Retention time (min) 2.4500 ± 0.10
6.6833 ± 0.10
4. Asymmetry 1.4000 1.1667
5. % RSD 0.94 % 0.57 %
6. Resolution - 14.941
2
4. SPECIFICITY:
The specificity of the method was evaluated by assessing interference from excipients in the pharmaceutical dosage form prepared as a placebo solution. Optimized Chromatogram of MET and TENE is shown in Figure-4 clearly shows the ability of the method to assess the analyte in the presence of other excipients.
Fig.4 Optimized Chromatogram of MET and TENE
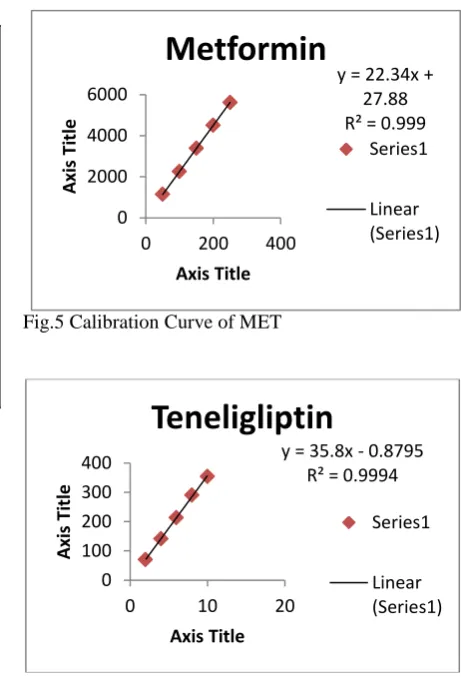
Linearity And Range:
Linearity was assessed for the two oral anti diabetic drugs at concentration ranges 50-250μg/ml for MET and 02-10 μg/ml for TENE. A linear relationship was established at these ranges between Area under the peak (AUP) and concentration. Good linearity was proved by high values of coefficient of determinations
(Figure-5. and Figure-6). The results were tabulated in Table 3 and 4.
[image:3.595.295.526.71.410.2]The correlation coefficient (R2) was found to be 0.999 and 0.9994 for MET and TENE which are greater than 0.990, ensure that a good correlation existed between the peak area ratio of sample with Internal standard and analyte concentration.
Fig.5 Calibration Curve of MET
[image:3.595.72.281.383.529.2]Fig.6 Calibration Curve of TENE
Table 3: Calibration data for standard MET
Sr. No
. % Con c.
Conc. (μg/m
L)
Peak Area mean* SD
%RS D
1 50 50 1144.41 5.99 0.52
2 100 100 2256.25 44.92 1.99
3 150 150 3382.15 29.85 0.88
4 200 200 4507.74 28.95 0.64
5 250 250 5613.56 84.39 1.50
Correlatn Coefficient 0.999 Regression Equation y=22.34x+27.88
y = 35.8x - 0.8795 R² = 0.9994
0 100 200 300 400
0 10 20
A
xi
s
Ti
tle
Axis Title
Teneligliptin
Series1
Linear (Series1) y = 22.34x +
27.88 R² = 0.999
0 2000 4000 6000
0 200 400
A
xi
s
Ti
tle
Axis Title
Metformin
Series1
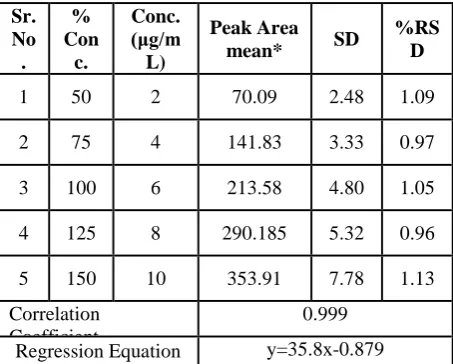
[image:3.595.304.531.488.672.2]Table 4: Calibration data for standard TENE
Sr. No
. % Con c.
Conc. (μg/m
L)
Peak Area mean* SD
%RS D
1 50 2 70.09 2.48 1.09
2 75 4 141.83 3.33 0.97
3 100 6 213.58 4.80 1.05
4 125 8 290.185 5.32 0.96
5 150 10 353.91 7.78 1.13
Correlation Coefficient
0.999
Regression Equation y=35.8x-0.879
Intraday Precision:
The precision of an analytical method is the degree of agreement among individual test results when the method is applied repeatedly to multiple sampling of homogeneous sample. The precision of analytical method is usually expressed as the standard deviation or relative standard deviation (Coefficient of variation) of series of measurements. The sample solution was analysed by injecting five times in to the HPLC and record the chromatogram.
The sample solution was analyzed by injecting 5 times in to the HPLC and record the retention time and peak. Average retention times ± standard deviation for MET and TENE are 2.38 ± 0.074, and 6.28 ± 0.064 min, respectively, for six replicate analyses. % RSD of peak area for MET and TENE were 0.13 and 0.55 respectively. The %RSD for retention time is ≤ 1 and %RSD for peak area is ≥ 2 the values are within the acceptable criteria.
Table 5: Intraday precision for MET and TENE
MET TENE
Conc Ppm
Peak Area
Mean SD % RSD
Conc Ppm
Peak Area Mean SD
% RSD
100 2330.76 3.75 0.16 04 143.58 2.84 1.98
150 3365.95 5.37 0.16 06 216.56 1.77 0.82
200 4486.40 1.88 0.04 08 286.91 1.99 0.69
Assay of Marketed Formulation:
Twenty tablets were collected, weighed and powdered. The powder equivalent to 500 mg of MET and 20 mg of TENE were transferred to a 100 mL volumetric flask and dissolved in mobile phase. The solution was ultra sonicated for 30 min and filtered through 0.20 micron membrane filter to obtain concentration about 5000 μg/mL MET and 200μg/mL TENE respectively. Then, this solution was forwarded for chromatographic study.
5. CONCLUSION:
A novel RP- HPLC method has been developed for the simultaneous estimation of Metformin and Teneligliptin in marketed formulations. The method gave good resolution for both the drugs with a short analysis time below 6 minutes. The developed method was validated. It was found to be simple, precise and accurate. The % RSD was also less than 2 % showing high degree of precision of the proposed method. The proposed method can be used for routine analysis of Metformin and Teneligliptin in combined dosage form. It can also be used in the quality control in bulk manufacturing.
REFERENCES
[1] Sen AK, Hinsu DN, Sen DB, Zanwar AS, Maheshwari RA and Chandrakar VR (2016): Analytical method development and validation for simultaneous estimation of Teneligliptin hydrobromide hydrate and Metformin hydrochloride from its pharmaceutical dosage form by three different UV spectrophotometric methods. Journal of Applied Pharmaceutical Science, 6(09), pp. 157-165.
[2] Loni AB, Ghante MR and Sawant SD (2012): Method development and validation for simultaneous determination of sitagliptin phosphate and metformin hydrochloride by RP-HPLC in bulk and tablet dosage form. Asian Journal of pharmaceutical sciences and research, 2(8), pp. 23-37.
[3] Madhusudhan P, Reddy RM and Devanna N (2015): A RP HPLC method development and validation for simultaneous estimationof metformin HCL and rosiglitazone in bulk and tablet dosage form. Der pharmacia letter, 7(3), pp. 180-187.
[4] Ansari Yaasir Ahmed*, Dr. Gulam Javed khan, Ansari Abdul Aleem, Ansari Abubakar (2016): Comparative Assessment of Analytical Methods of orally Disintegrated Tablet of Ondansetron. Asian Journal of Pharmaceutical Technology & Innovation, 04 (21), pp. 01 – 09.
Nifedipine in Bulk and Tablet Dosage Form. Journal of Emerging Technologies and Innovative Research, 6(2), pp. 29-36.
[6] Reddy NP and Chevela NT (2015): RP-HPLC method development and validation for the simultaneous estimation of metformin and canagliflozin in tablet dosage form. International Journal of Pharma Sciences, 5(4), pp. 1155-1159.
[7] Gangrade D and Sharma A (2015): Validated RP-HPLC method for simultaneous estimation of metformin hydrochloride and sitagliptin phosphate in bulk drug and pharmaceutical dosage form. Der Pharmacia Sinica, 6(1), pp. 6-10.
[8] Patel MG, Patil PO and Bari SB (2012): Validated RP-HPLC method for simultaneous estimation of metformin hydrochloride and benfotiamine in bulk drug and in pharmaceutical dosage form. International Journal of Analytical and Bioanalytical Chemistry, 2(3), pp. 196-200. [9] Raja T and Rao AL (2012): Validated
RP-HPLC method for simultaneous estimation of metformin hydrochloride and sitagliptin phosphate in bulk drug and pharmaceutical formulation. International journal of pharmaceutical, chemical and biological sciences, 2(4), pp. 696-702.
[10] Indian Pharmacopoeia (2007): Government of India, Ministry of Health & Family Welfare, Volume-2, Ghaziabad, The Indian Pharmacopoeia Commission. pp. 1358-59. [11] The Merck Index (2001): Merck & Co Inc,
White House Station, New Jersey, USA, 13th Edition. Pg. 1061.