IMT Institute for Advanced Studies Lucca, Italy
Application-Aware Image Compression
and Sensing Platform for Plant
Phenotyping
Ph.D. Program in Computer Science and Engineering XXVI Cycle
By
Massimo Minervini 2015
The dissertation of Massimo Minervini is approved.
Advisor: Sotirios A. Tsaftaris, IMT Lucca, Italy
The dissertation of Massimo Minervini has been reviewed by: Prof. Tony Pridmore, University of Nottingham, United Kingdom Prof. Béatrice Pesquet-Popescu, Télécom ParisTech, France
IMT Institute for Advanced Studies, Lucca 2015
Table of Contents
List of Figures ix
List of Tables xi
Vita and Publications xii
Abstract xiv
I Introduction and background
1
1 Introduction 2
1.1 The importance and evolution of plant phenotyping . . . . 2
1.2 Problem statement . . . 6
1.3 Challenges and scientific contributions . . . 9
2 Background and literature review 12 2.1 State-of-the-art in image-based plant phenotyping . . . 12
2.1.1 Phenotype acquisition . . . 13
2.1.2 Image analysis for phenotyping . . . 15
2.2 Computer vision challenges in plant phenotyping . . . 19
2.2.1 From the microscopic to the macroscopic: Chal-lenges and dimensions . . . 20
2.2.2 A timely and unique challenge . . . 29
2.3 Summary . . . 31
II Affordable sensor and image analysis on the cloud 33
3 An affordable image sensor 34 3.1 Introduction . . . 343.2 Affordable sensing solutions . . . 36
3.2.1 A smart sensor based on the Raspberry Pi . . . 36
3.2.2 Imaging plants using a commercial camera . . . 38
3.3 Imaging Arabidopsis plants . . . 39
3.3.1 Imaging setup . . . 40
3.3.2 Plant material and growing conditions . . . 41
3.4 Finely-grained annotated datasets . . . 43
3.4.1 Overview of semantic hierarchy . . . 44
3.4.2 Expert segmentations . . . 44
3.4.3 Computer vision tasks and datasets . . . 46
3.5 Summary . . . 54
4 Plant image analysis with learning and active contours on the cloud 55 4.1 Introduction . . . 55
4.2 Plant delineation from complex background . . . 56
4.2.1 Image segmentation with incremental learning and active contours . . . 58
4.2.2 Results and discussion . . . 70
4.3 Web application for plant image analysis on the cloud . . . 83
4.3.1 The swiss army knife for plant phenotyping . . . . 84
4.4 Phenotypic analysis of Arabidopsis . . . 86
4.4.1 Visual trait descriptors of rosette plants . . . 87
4.4.2 Results and discussion . . . 90
4.5 Leaf segmentation and counting . . . 93
4.6 Summary . . . 96
III Application-aware image compression
97
5 Effects of image compression in plant phenotyping applications 98 5.1 Introduction . . . 985.2 Materials and methods . . . 100
5.2.1 Images and image compression . . . 100
5.2.2 Metrics for image quality evaluation . . . 102
5.2.3 Employed image and video codecs . . . 105
5.3 Case studies: Compression affects phenotypic analysis . . 109
5.3.1 Example 1: Size of a rosette plant evaluated by PLA 109 5.3.2 Example 2: Quantifying local root growth by REGR 112 5.3.3 Example 3: Manual delineation of root images . . . 113
5.4 Performance of compression in plant applications . . . 115
5.4.1 Lossless coding . . . 115
5.4.2 Segmentation-based shoot image analysis . . . 117
5.4.3 Local growth estimation of leaves and root tips . . . 120
5.4.4 Encoding and decoding execution times . . . 122
5.4.5 Discussion . . . 123
5.5 Summary . . . 128
6 Application-aware image compression for distributed plant phe-notyping 129 6.1 Distributed sensing and analysis framework . . . 129
6.2 Application-aware image compression . . . 131
6.3 Summary . . . 133
7 Saving bits in space 134 7.1 Introduction . . . 134
7.2 Saving bits in space: plant image compression based on regions of interest . . . 135
7.2.1 ROI estimation with feedback . . . 136
7.2.2 Results and discussion . . . 140
7.3 Computationally efficient image segmentation metrics . . . 144
7.3.1 Approximate metrics via learning . . . 145
7.3.2 Selection algorithms . . . 148
7.3.3 Results and discussion . . . 151
7.4 Summary . . . 156
8 Saving bits in color representation 158 8.1 Introduction . . . 158
8.2 Learning the color transform from the data . . . 160
8.2.1 The aKLT: A low-complexity unsupervised data de-pendent transform . . . 161
8.2.2 A supervised approach to an application-dependent color transform . . . 164
8.2.3 Combining unsupervised and supervised approaches167 8.3 Results and discussion . . . 168
8.3.1 Experimental settings . . . 168
8.4 Summary . . . 179
9 Application-aware rate-distortion optimization 181 9.1 Introduction . . . 181
9.2 Classification-aware distortion metric for rate-distortion optimization . . . 183
9.2.1 Rate-distortion optimization: Notation and problem statement . . . 183
9.2.2 On the relation between compression and classifica-tion . . . 185
9.2.3 Proposed classification-aware distortion metric . . . 186
9.3 Application-aware rate-distortion optimization in HEVC . 190 9.3.1 Overview of theλ-domain rate control algorithm . 190 9.3.2 Rate-distortion modeling using the proposed metric 192 9.4 Results and discussion . . . 193
9.4.1 Experimental settings . . . 193 9.4.2 Results . . . 195 9.5 Summary . . . 196 10 Conclusions 198 10.1 Concluding remarks . . . 198 10.2 Future directions . . . 200 A Appendix 202 A.1 Rpisensing solution . . . 202
A.2 Canonsensing solution . . . 207
List of Figures
1.1 Increasing food demand and declining agricultural land . 5
1.2 Distributed sensing and analysis framework . . . 8
2.1 Shape variability in Arabidopsis plants . . . 16
2.2 Challenging images due to changing conditions . . . 17
2.3 Example plant phenotyping setups and images . . . 21
3.1 Examples annotations on a plant image . . . 36
3.2 Sensing solution based on the Raspberry Pi . . . 37
3.3 Sensing solution based on a commercial camera . . . 38
3.4 Acquisition setup for ‘Ara2012’ and ‘Ara2013’ datasets . . . 41
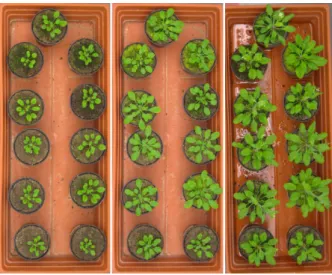
3.5 Example images from ‘Ara2012’ and ‘Ara2013’ datasets . . 42
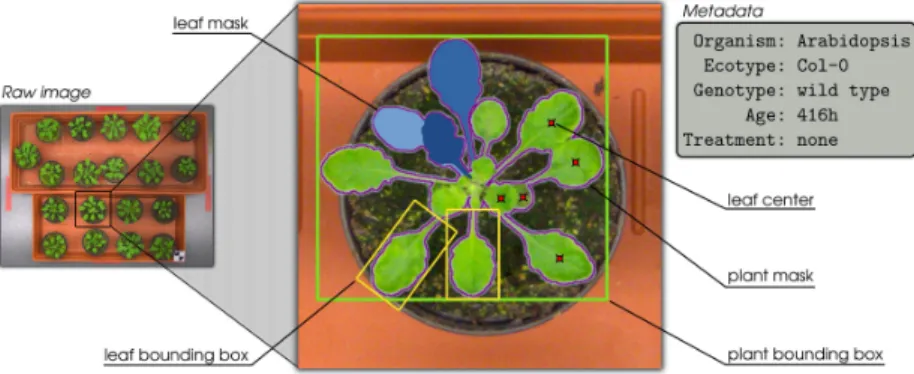
3.6 Hierarchy of data, metadata, and annotations . . . 45
3.7 Leaf annotation workflow . . . 46
3.8 Examples of plant images and leaf masks . . . 47
4.1 Image analysis pipeline for plant phenotyping . . . 59
4.2 Examples of color and texture features . . . 62
4.3 Comparison of plant segmentation approaches . . . 71
4.4 Comparison of plant segmentation approaches (details) . . 74
4.5 Segmentation accuracy over time . . . 76
4.6 Growth pattern of Arabidopsis via rosette area . . . 77
4.7 Segmentation results of several state-of-the-art methods . . 79
4.8 Segmentation outputs illustrating the pipeline components 80 4.9 Web-based interface: PhidiasAnnotate . . . 85
4.10 Web-based interface: PhidiasModel . . . 86
4.11 Web-based interface: PhidiasAnalyze . . . 87
4.12 Ara2013 genotypes and growing plant . . . 89
4.13 Phenotyping results for different genotypes of Arabidopsis 91 4.14 Validation of vision-based measurement against manual . 92 4.15 Examples of leaf segmentation and counting . . . 93
5.1 Schematic of typical lossy image encoding/decoding . . . 101 5.2 Compression affects growth observations in Arabidopsis . 110
5.3 Example images used for root growth analysis . . . 112
5.4 Compressed images of root systems . . . 114
5.5 Performance of lossless compression . . . 116
5.6 Compression performance of color images of plant shoots 118 5.7 Image and segmentation errors due to compression . . . . 120
5.8 Lossy compression of image data for optical flow analysis . 121 6.1 Distributed sensing and analysis architecture . . . 130
7.1 ROI masks obtained with different methods . . . 141
7.2 Reconstructed image after compression with ROI coding . 142 7.3 PSNR and application accuracy results . . . 143
7.4 Example segmentations and MHD values . . . 151
7.5 Examples of synthetic segmentation errors . . . 153
7.6 Prediction accuracy of the sparse linear models . . . 156
8.1 Typical encoding/decoding process of a color image . . . . 160
8.2 Comparison between KLT and FST approaches . . . 165
8.3 Example test images of Arabidopsis . . . 169
8.4 PSNR results using data-dependent color transforms . . . 171
8.5 Example image projected in a variety of color spaces . . . . 173
8.6 Class separability of the supervised transform . . . 175
8.7 R-D performance using different color transforms . . . 177
8.8 Examples of reconstructed images after compression . . . 179
9.1 Proposed distortion metric for classification accuracy . . . 187
9.2 R-λcurve fitting . . . 193
9.3 R-D performance using the proposed distortion metric . . 196
9.4 Example of post-compression classification . . . 197
A.1 Sensing solution based on the Raspberry Pi (setup) . . . . 203 A.2 Web-based interface to operate the Raspberry Pi solution . 204 A.3 Canon camera and buttons to operate the CHDK firmware 208
List of Tables
2.1 Online resources for plant phenotyping . . . 32
3.1 Summary of information of the Arabidopsis datasets . . . 40
4.1 Segmentation accuracy results . . . 78
4.2 Breakdown of the proposed system . . . 81
4.3 Contribution to segmentation accuracy of each component 81 4.4 Results of the Leaf Segmentation Challenge 2014 . . . 95
5.1 ANOVA of PLA error . . . 111
5.2 Execution times for encoding/decoding still images . . . . 123
5.3 Execution times for encoding/decoding sequences . . . 124
7.1 Example regression coefficients and theirR2 . . . 154
7.2 Selection rates for inclusion of the metrics in the model . . 154
7.3 R2results of the linear models . . . 155
8.1 Comparison of KLT approaches . . . 163
8.2 PSNR results on the plant dataset . . . 172
8.3 aKLT using different initializations . . . 174
Vita
April 16, 1984 Born, Terlizzi (BA), Italy 2002–2008 B.Sc. in Computer ScienceMark: 110/110 cum laude University of Bari
Bari, Italy
2008–2010 M.Sc. in Computer Science Mark: 110/110 cum laude University of Bari
Bari, Italy
2014–2015 Research Collaborator
Pattern Recognition and Image Analysis Research Unit IMT Institute for Advanced Studies
Lucca, Italy
Publications
[1] M. Minervini, S. A. Tsaftaris, “Classification-aware distortion metric for HEVC intra coding,” submitted to theInternational Conference on Visual Communica-tions and Image Processing, 2015.
[2] H. Scharr, M. Minervini, A. P. French, C. Klukas, D. M. Kramer, X. Liu, I. Lu-engo Muntión, J.-M. Pape, G. Polder, D. Vukadinovic, X. Yin, S. A. Tsaftaris, “Leaf segmentation in plant phenotyping: A collation study,” submitted for
publication toMachine Vision and Applications, 2015.
[3] M. Minervini, A. Fischbach, H. Scharr, S. A. Tsaftaris, “Finely-grained anno-tated datasets for image-based plant phenotyping,” submitted for publication toPattern Recognition Letters, 2015.
[4] M. Minervini, H. Scharr, S. A. Tsaftaris, “The significance of image compres-sion in plant phenotyping applications,”Functional Plant Biology, 2015, to appear.
[5] M. Minervini, H. Scharr, S. A. Tsaftaris, “Image analysis: The new bottleneck in plant phenotyping,”IEEE Signal Processing Magazine, vol. 32, 2015.
[6] M. Minervini, C. Rusu, S. A. Tsaftaris, “Computationally efficient data and application driven color transforms for the compression and enhancement of images and video,” inColor Image and Video Enhancement. Springer, 2015, ch. 12.
[7] M. Minervini, C. Rusu, S. A. Tsaftaris, “Unsupervised and supervised ap-proaches to color space transformation for image coding,” in21stInternational Conference on Image Processing, Oct. 2014, pp. 5576–5580.
[8] M. Minervini, M. M. Abdelsamea, S. A. Tsaftaris, “Image-based plant pheno-typing with incremental learning and active contours,”Ecological Informatics, vol. 23, pp. 35–48, Sep. 2014, S. I. on Multimedia in Ecology and Environment. [9] H. Scharr, M. Minervini, A. Fischbach, S. A. Tsaftaris, “Annotated image datasets of rosette plants,” Forschungszentrum Jülich GmbH, Jülich, Ger-many, Tech. Rep. FZJ-2014-03837, Jul. 2014.
[10] M. Minervini, C. Rusu, M. Damiano, V. Tucci, A. Bifone, A. Gozzi, S. A. Tsaf-taris, “Large-scale analysis of neuroimaging data on commercial clouds with content-aware resource allocation strategies,”International Journal of High Performance Computing Applications, 2014.
[11] M. Minervini, C. Rusu, S. A. Tsaftaris, “Learning computationally efficient approximations of complex image segmentation metrics,” in8thInternational Symposium on Image and Signal Processing and Analysis, Sep. 2013, pp. 60–65. [12] M. Minervini, S. A. Tsaftaris, “Application-aware image compression for low
cost and distributed plant phenotyping,” in18thInternational Conference on Digital Signal Processing, Jul. 2013, pp 1–6.
[13] M. Minervini, M. Damiano, V. Tucci, A. Bifone, A. Gozzi, S. A. Tsaftaris, “Mouse Neuroimaging Phenotyping in the Cloud,” in3rdInternational Confer-ence on Image Processing Theory, Tools and Applications, Oct. 2012, pp. 55–60. [14] G. Casalino, N. Del Buono, M. Minervini, “Nonnegative matrix
factoriza-tions performing object detection and localization,”Applied Computational Intelligence and Soft Computing, vol. 2012, Jan. 2012.
[15] D. Dell’Agnello, A. M. Fanelli, C. Mencar, M. Minervini, “Serendipitous fuzzy item recommendation with ProfileMatcher,” inFuzzy Logic and Applications, vol. 6857, Aug. 2011, pp. 220–227.
[16] M. Minervini, “Serendipity injection in a fuzzy recommender system,” in
Abstract Booklet of the First AI*IA Doctoral Consortium, Dec. 2010.
[17] N. Del Buono, M. Minervini, “Nonnegative matrix factorizations perform-ing object detection,” Technical Report 14/10, Department of Mathematics, University of Bari, Bari, Italy, Jul. 2010.
Abstract
Plant phenotyping investigates how a plant’s genome, interacting with the environment, affects the phenome (i.e. the observable traits of a plant). Quantitative assessment of phenotypes is central to our quest towards efficient and sustainable agriculture. Image-based approaches to plant phenotyping are gaining momentum and, on par with growing scientific and commercial interest, exciting computer vision problems arise. Cur-rently available solutions for image-based plant phenotyping are either destructive and low-throughput or high-throughput and costly. We pro-pose an affordable solution based on a distributed sensing and analysis framework. Time-lapse sequences of the scene are acquired by afford-able sensors (as such, they will have limited computational power and knowledge access). The images are transmitted to the cloud, where high computational resources permit the extraction of fine-grained phenotypic information. For the automated analysis of such images, we develop a multi-channel active contour segmentation with probabilistic priors on plant appearance. To validate our approach we collect two image datasets of growing Arabidopsis plants, portions of which are manually annotated and publicly released. However, the transmission of large volumes of image data necessitates compression to meet bandwidth constraints. After demonstrating that lossy image compression does affect vision-based mea-surement of plant traits and can jeopardize phenotypic analyses, we inves-tigate application-aware compression strategies on resource-constrained devices to reduce transmission and storage cost of the acquired images without compromising analysis accuracy. The possibility of sharing in-formation between sensor and receiver is exploited: the receiver feeds back to the sensor information to optimize image compression. We inject application knowledge at different levels of the lossy encoding process. The sensor estimates regions of interest within an image and applies dif-ferent levels of compression to foreground (plants) and background. We also save bits in color representation, using an orthogonal transform with class separation capabilities obtained with supervised learning. Finally, we investigate application-aware distortion metrics for pixel-level classifi-cation accuracy, and their implementation in the rate control algorithm of the High Efficiency Video Coding (HEVC) standard. We hope with such an affordable solution to increase adoption of image-based approaches to plant phenotyping by small labs and breeders, and also in developing countries, in pursuance of the democratization of science and technology.
Part I
Introduction and
background
1
Introduction
1.1 The importance and evolution of plant
phe-notyping
Plants have always been a crucial source of food, feed, fiber, and fuel. The domestication of plants and livestock caused a revolution in human evo-lution: we went from being hunter-gatherers to forming pastoral, rooted communities. Farmers, since that day, plant, collect the seed (or fruit) of their farm, and retain seeds of those plants that exhibited a behavior (essentially a trait) that was better than the average plant in their crop (we use loosely the word crop here to refer to any plant of agricultural interest). This is known collectively as selective breeding, and modern-day breeders still follow the same practice to create new varieties.
Essentially, those traits are the phenotypes we seek after even to this day. A ‘phenome’ is the set of all phenotypes expressed by an organism (e.g., a plant), resulting from the interaction between its ‘genome’ (i.e. the
This chapter is partly based on:
• M. Minervini, H. Scharr, S. A. Tsaftaris, “Image analysis: The new bottleneck in plant phenotyping,”IEEE Signal Processing Magazine, vol. 32, 2015.
genetic material) and the surrounding environment [77, 97, 135]: Phenome=Genome×Environment
Typical plant phenotypes of interest are, e.g., how fast it grows, how it reacts to water or nutrient shortage, how many seeds (or fruits) it produces, its final weight. Depending on the type of farming, different traits are important. On the other hand, typical environmental factors influencing a plant’s behavior and performance include temperature, light intensity, humidity, soil, nutrients, disease, stress.
In the (not so distant) past, such collection of phenotypes was largely based on direct experience: the farmer would just observe what was ‘different’ with a particular plant in his crop and such visual scoring is still an important skill of breeders. As scientific means entered agriculture, and the pioneering work of Mendel on genetics, breeding took a completely different turn.
Nowadays, plant scientists are devoted to identifying how the genotype (i.e. the genetic material) affects the phenotypes of plants and how those traits can be selected and introduced to future varieties. They do this not only working on classical plants and crops (e.g., corn, rice, barley, or soybean) but also relying on model plants (e.g.,Arabidopsis thaliana[205]) that due to small size and short growth cycle can be used to accelerate phenotype measurement (‘phenomics’ [135]) and genotype association. Uncovering a gene’s exact properties and function (‘functional genomics’ [25, 132]) is of great practical interest, because important functions can be matched with agronomically important traits, of interest to breeders [88].
Working on model plants (such as Arabidopsis), combined with re-markable advances in genotyping, has revolutionized our understanding of plant biology [87]. The rate of throughput for acquiring genetic infor-mation (with sequencing and microarrays) has achieved game-changing levels [195]: modern sequencing mechanisms can produce the sequence (i.e. the genetic information) of a plant within a few days and with min-imal cost, in the order of few thousands of dollars. Comparatively, 10 years ago, it took approximately 10 years to sequence the human genome, and cost $3.4B. Once a plant’s genome has been fully sequenced (an ap-proach that is already of high throughput), algorithms exist to compare sequences of unknown genes with genes whose function is already known. Following the isolation of the mutated gene, experiments are necessary to screen collections of mutant plants and quantify their phenotype. The actual phenotyping process is extremely time and effort consuming. To
discover valuable agricultural traits (e.g., growth rate, root density, grain size, drought tolerance, product quality, yield potential, etc.), replicated trials need to be carried out across multiple environments over a number of seasons, with a considerable amount of manual work for taking mea-surements. In addition, many phenotyping techniques are destructive for the plants, i.e. they involve removing parts of the plant or even harvesting early in the life-cycle. Precision and high throughput in genotyping has ac-celerated the need for precision in phenotyping [30], favoring approaches that provide quantifiable phenotyping information, which could be better used to find associations in the genotype [231].
The combination of novel technologies such as noninvasive imaging, spectroscopy, image analysis, robotics, and high-performance comput-ing has been identified as key to address the so-called ‘phenotypcomput-ing bottleneck’ [104]. The development of robust imaging equipment has helped in the acquisition of phenotypes and image-based approaches are gaining attention among plant researchers to measure and study vi-sual phenotypes of plants. In the last decades, there has been a growing interest towards developing solutions for the automated analysis of visu-ally observable traits of the plants [113]: a variety of approaches based on images have been developed to measure such traits in an automated fashion [115, 150, 318] and analyze the image data acquired during ex-periments [18, 71, 124, 220, 310, 318, 339]. What was previously tedious manual work, typically consisting of measuring actual plants either non-destructively (e.g., to measure leaves with a caliper) or non-destructively (e.g., to weigh a plant or fruit), it is becoming a matter of collecting a series of imaging data [182, 292]. And as automation advanced, this image collec-tion became even more simplified and higher throughput. However, the task of measuring phenotypes with images remained at large a manual process: instead of working on the plant, scientists are working on its ‘digital self’, using image analysis tools to measure objects on images [269].
This process until recently remained satisfactory.
However, our way of life is facing significant challenges due to climate change, population increase, change in our diets and need for biofuels (cf. Figure 1.1). In fact, according to the Food and Agriculture Organization of the United Nations (FAO) [37], by 2050 the population is expected to reach 9 billion while arable land would expand by only 5%, with irrigation limited by lack of infrastructure. Crop yields are expected to increase, albeit at a lower pace. Furthermore, different trends of the above within regions and between developing and developed countries, have been
Figure 1.1: Opposing trends of increasing food demand and declining agricultural land per capita are observed between 1960 and 2015, empha-sizing the importance of high-performance agriculture and knowledge based bio-economy to face loss of water resources and agricultural land mass, due to climate change, erosion, and the increasing trends of using plants for energy. Figure adapted from [24] (source: WRI, Aquila, Robeco).
observed. The report concludes that we need to increase yield, under the constraints of using less energy, water, and fertilizer, and identifies large scale phenotyping as one of the most promising approaches. Together with the breeding industry, researchers try to identify, improve, and breed key traits to satisfy the growing demands, increase resistance to parasites and diseases, reduce environmental impact (less water, less fertilizer), always striving to a more sustained agriculture [241].
Towards this goal, 1.700 seed banks, where seeds and genetic material are collected, have commenced an effort to identify the diversity of this material, with the hope of finding genotypes that could meet the above constraints tailored to local regional characteristics. Notice, however, that one bank alone may contain hundreds of thousands of different cultivars (i.e. cultivated varieties of a plant created or selected for desirable charac-teristics and thereafter maintained by cultivation). One possible avenue to identify those, is through large scale experiments under different environ-mental conditions, to identify which phenotypes exist and which gene(s)
are related, i.e. the so-called genome-wide association studies (see e.g. [17] for Arabidopsis). The complexity of genotype×environment (including cultivation) produces a tremendous amount of data. Exhaustive search, i.e. experiments covering all genotypes at all environmental conditions, is simply not possible. As experimental scale increases, thousands of plants per experiment are in reach and necessary. Furthermore, phenotyping can be either forward or reverse, where known genotypes (genes, or cultivars) are sieved for valuable traits, or the reverse of this process, were unique traits are observed and the desirable genotype (gene or genes) need to be identified. However, the rate at which phenotypes are extracted in the field or in the lab, is not matching the speed of genotyping and is creating a bottleneck [135].
While previously the bottleneck was in the equipment (the hardware) it is now also the analysis (the software). There is a need to develop accurate, robust and automated analysis algorithms that can extract phenotypic information from experiments on the small (cell) or large scale (field), in 2D or 3D (plus time for dynamics), in the lab but more importantly in the field on real crops. These algorithms should be coupled with affordable sensing platforms and should be capable of dealing with the immense amount of data typically produced in these experiments (requiring in some cases ‘Big Data’ approaches). The analysis of imaging data currently appears to be the the weakest, or even missing, link due to the major chal-lenges in computer vision and image processing we are currently facing (cf. Chapter 2 for a discussion of image and signal processing challenges arising in the context of plant phenotyping).
1.2 Problem statement
Currently, the majority of phenotype collection systems rely on commercial or several custom-built solutions, ranging from the small scale of growth chambers to the very large scale of automated greenhouses or field appli-cations. The commercial options are costly, requiring an initial investment that few laboratories can afford. Additionally, the hardware infrastructure is usually complemented by a highly integrated and proprietary analysis software; thus, the overall phenotyping solution needs to be used ‘as is’ when options are vendor locked. While costly phenotyping facilities may represent the best option for large research organizations and offer local high throughput, many labs (particularly also in developing countries)
and small companies (e.g., breeders) have limited financial resources, thus install base throughout the world remains limited.
As an effect of those limitations, many organizations willing to embrace the image-based approach but not appreciating the cost and vendor lock-in of commercial solutions, develop highly customized (hardware and image analysis) solutions tailored to their experimental setting and capable of addressing only specific phenotyping problems. Even when they are affordable, this variability in methods and setups creates standardization problems. Unfortunately, these solutions cannot be easily adopted by other labs with different experimental settings, since adjustments to the complex image pipeline or a redesign are necessary.
Therefore, affordable plant phenotyping solutions are desirable and are expected to increase the capability of investigating plant biology on a global scale, by reducing the entry barrier of high cost. Several labo-ratories have explored the potential of affordable industrial cameras for plant phenotyping, since imaging can cover a large span of phenotyping interests, in the lab or in the field when combined with affordable carri-ers (such as quadcoptcarri-ers). The experiences have shown that affordable sensors can suitably replace expensive ones, whilst maintaining adequate accuracy in phenotype measurement. The use of off-the-shelf commercial equipment could facilitate standardization across experiments, lower the entry barrier, offer affordable solutions, and help many labs adopt the image-based approach to plant phenotyping. However, to this day, most approaches remain customized, are not supported by an open community, and are typically focused on a small application range.
In this thesis, we propose a novel phenotyping solution,1which aims to provide a universal, turnkey, and modular platform based on distributed sensing and analysis. Figure 1.2 shows an overview of the proposed framework, on which we expand in the rest of the thesis. This distributed approach presents several key advantages. Affordable and easy-to-install sensors can be adopted in laboratories (growth chambers), the greenhouse, or the field, and they are free to move (e.g., when installed on board a tractor or a drone). Multiple affordable sensors can be readily deployed to cover areas larger than the field of view of a single camera, or to ob-tain higher resolution, before resorting to expensive solutions based on robotics and automation. Besides, outsourcing computation and storage to the cloud relieves the user from the cost of purchasing and maintaining
Phenotypic Results Compressed images Segmentation, features, etc. Feedback Image Processing and Analysis Smart Sensor(s) 1 2 3 4 5 6 7 8 9 10 11 12 13 14 15 16 17 0 2 4 6 8 10 12 14 16 18 20 2) Plan t Area (cm Time (days) time ... ... time ... ...
Figure 1.2:Smart and affordable camera sensors (e.g., based on the Rasp-berry Pi [280]) are deployed on site, and acquire time-lapse image se-quences of the scene, including one or multiple plants. In the proposed distributed sensing and analysis framework (cf. Chapter 6), the images are compressed and transmitted to a centralized, remote location (e.g., the cloud) that also acts as an ‘oracle’. Leveraging high computational power and a broad knowledge base, the oracle is able to run sophisticated com-puter vision tasks (e.g., feature extraction, leaf segmentation and tracking, optical flow analysis, 3D reconstructions) and feeds back to the sensor information to improve its ability to compress the images (or other tasks). Relying on web-based graphical user interfaces, phenotyping results are presented to the user for interpretation.
a high-performance computing infrastructure in situ. Importantly, it also permits consistency in experiments among different labs by standardiz-ing equipment and analysis. This centralized design, particularly when combined with an open architecture, can benefit the entire community, providing a modular and expandable architecture (by changing or adding new camera sensors), favoring software reuse (e.g., user-contributed al-gorithms can be adopted by other labs) and knowledge sharing (e.g., a common repository of acquired data and meta-data, and also the analysis application itself learning on the user’s feedback).
Overall, we believe that such a platform could represent an enabling factor to boost global high throughput in plant phenotyping. However, significant challenges are posed since data need to be transmitted over com-munication channels, and analysis has to occur remotely on compressed images.
1.3 Challenges and scientific contributions
Our proposed solution is based on affordable sensors and image analysis performed on the cloud. Due to the lack of publicly available imaging datasets, we devise an implementation of our sensor and setup a growth chamber to grow Arabidopsis plants and collect imaging data. To analyze the acquired images we investigate plant segmentation methodologies and to ease adoption of our solution we devise an implementation on the cloud. With sensing happening locally and analysis taking place (remotely) on the cloud, efficient transmission of the acquired images to meet bandwidth constraints becomes central, requiring compression approaches that save bits without jeopardizing accuracy of the analysis occurring on the cloud on the compressed images.The importance of increasing adoption of image-based phenotyping is striking, and emphasizes the need for suitable solutions to the chal-lenges that affordable phenotyping entails. The original contributions of this thesis are twofold: after introduction and background information (Part I), an affordable solution for image acquisition and automated analy-sis in a plant phenotyping context is presented in Part II. Subsequently, approaches to application-aware image and video compression are inves-tigated in Part III. The thesis is divided into nine chapters, each discussing aspects of the general framework described previously. In the following paragraphs we outline organization of the material, illustrating also the scientific and engineering contributions offered by the thesis.2
After an overview of image-based approaches to plant phenotyping, in Chapter 2we outline the key role of image processing and computer vision in plant phenotyping. To motivate the involvement of the broad computer vision community in this societally important problem we published this discussion in [214].
To balance cost and reliability constraints, we propose inChapter 3 an affordable sensing solution to acquire time-lapse sequences of plants and transmit them to a remote location for storage and analysis (further implementation details are inAppendix A). Its use is showcased in two experiments including different genotypes ofArabidopsis thaliana. Details on plant material, environmental conditions, and imaging setup and pro-cedures are published in [274]. To validate the approaches presented in this thesis we manually annotate the images collected during these plant
2To disseminate research work, parts of this thesis have been published by the author or
experiments. As a benefit for the scientific community, we curate and pub-licly release a comprehensive collection of annotated datasets aimed at the development and evaluation of computer vision algorithms in the context of plant phenotyping, a description of which is under consideration for publication [210].
InChapter 4we discuss issues related to the automated analysis of images in a plant phenotyping context. Focusing on accurate growth estimation, we propose a method (published in [209]) integrating an ac-tive contour model and prior knowledge on plant appearance for the segmentation and the analysis of time-lapse plant images from phenotyp-ing experiments in a general laboratory settphenotyp-ing, that can adapt to scene variability. To favor adoption of our system, a cloud-based software imple-mentation with a graphical web interface is also released to the scientific community. Additionally, results of leaf segmentation and counting are showcased, demonstrating the current state of the art. Leaf segmentation results stem from the Leaf Segmentation Challenge (LSC) organized in 2014, a description of which is under consideration for publication [275]. Affordability and remote processing, however, pose technical chal-lenges. The choice of optics and the fixed field of view restrict the quality (in resolution and sharpness) of the acquired images and the plants this setup can image (e.g., it may not be suitable for not co-planar plants). An affordable sensor will have limited computational power and knowledge access, thus, it requires low complexity algorithms to perform vision and information extraction tasks, and as such remote processing is necessary. Then, the transmission of (possibly) large volumes of image data from the sensor to the cloud necessitates lossy compression to meet bandwidth constraints.
However, this loss of information will affect the accuracy of vision tasks occurring at the analysis. It is demonstrated empirically in Chap-ter 5(based on several proof-of-concept experiments) that lossy image compression, albeit necessary to cope with the amount of imaging data at hand, does affect vision-based measurement fidelity, and errors intro-duced in plant trait extraction and analysis can be high. Hence, we identify via thorough comparisons of state-of-the-art approaches suitable compres-sion options for a variety of typical phenotyping applications. This work is currently under consideration for publication [215].
As the images acquired in an automated phenotyping context are not meant for the human visual system, general-purpose compression standards may not guarantee best results. Therefore, in Chapters 6 to 9
we investigate application-aware compression methodologies to optimize and tailor compression of the acquired images occurring at the sensor to the specific needs of the application that will use them.
InChapter 6we expand on the description of our distributed sensing and analysis framework, and discuss the concept of application-aware image compression. Next, inChapter 7we propose an application-aware image compression approach (published in [216]) based on low-complexity plant detection and a JPEG 2000 encoder capable of region-of-interest coding, that exploits feedback from the receiver to the sensor. To tune compression parameters at the sensor according to plant segmentation accuracy, we explore in [211] the possibility of approximating reliable and yet computationally complex image segmentation metrics such as the Hausdorff distance, based on a linear regression framework to learn from the data a sparse model and using as features simpler to compute metrics.
Color images are central to several plant phenotyping applications. To save bits in the color space representation, inChapter 8we describe two frameworks to obtain linear maps of the RGB color data that min-imize the loss of information due to compression. The first is a new data-dependent color transform (termed aKLT), that achieves compres-sion performance comparable to the Karhunen-Loève transform (KLT) at a fraction of the computational complexity and is suitable for adoption on resource-constrained devices. The second is an application-dependent color transform that aims at maximizing post-compression classifier perfor-mance, and is obtained with supervised learning methods by optimizing the Fisher discrimination criterion. This work is published in [212, 213].
A new application-aware distortion metric for pixel-level classification accuracy is defined inChapter 9. The proposed metric is implemented in the rate-distortion optimization framework of the recent HEVC (High Efficiency Video Coding) standard, and optimal model parameters for the
λ-domain rate control algorithm are derived by curve fitting procedures. This work is currently under consideration for publication [217].
Finally, inChapter 10we summarize the findings presented through-out thesis, and offer concluding remarks and possible directions for future work.
2
Background and literature review
2.1 State-of-the-art in image-based plant
pheno-typing
Plant phenotyping can occur on small scale (controlled laboratory settings of a growth chamber), in the greenhouse, or in the field [96, 320, 331]. While each setup aims to address different experimental questions, the majority of early stage experiments occur in growth chambers that offer controlled laboratory settings on a small scale using model plants.
A common framework can be identified, which is the key to the inter-pretation of all image-based plant phenotyping solutions designed in the last decade. A typical imaging pipeline for plant phenotyping involves the following steps:
This chapter is partly based on:
• M. Minervini, M. M. Abdelsamea, S. A. Tsaftaris, “Image-based plant phenotyping with incremental learning and active contours,”Ecological Informatics, vol. 23, pp. 35–48, Sep. 2014, Special Issue on Multimedia in Ecology and Environment.
• M. Minervini, H. Scharr, S. A. Tsaftaris, “Image analysis: The new bottleneck in plant phenotyping,”IEEE Signal Processing Magazine, vol. 32, 2015.
1. ‘sensing’ the plants in order to periodically acquire images, which are stored or transmitted to a processing unit (e.g., a workstation); 2. plants are identified in an image as regions of interest (there can be
more than one plant in each image);
3. single plants are then extracted, usually by means of image segmen-tation techniques, and each plant is identified, in order to follow its development throughout the experiment, which can last days or weeks;
4. finally, relevant measures are taken, such as plant size, color, leaf count, etc.
Performing such analysis for each plant in a period of weeks, generates a large amount of data, that can be analyzed and mined, in order to discover growth patterns and study response to treatments and external stimuli.
Among plant phenotyping techniques, a sharp distinction exists be-tween destructive and nondestructive approaches. Destructive approaches are such, in the sense that leaves or other parts of the plant need to be removed in order to be analyzed, or the whole seedling has to be prema-turely harvested. Techniques that belong to this class are usually cheap and simple to implement, since they rely on manual labor to take the samples and, for instance, use a scanner to acquire digital images to be an-alyzed by some software tool. On the contrary, nondestructive approaches involve much more elaborate hardware and software, as the goal is to minimize the human intervention, while injecting the highest degree of automation. The current research trends are more and more in the direc-tion of noninvasive and fully automated systems, which are capable of both growing the plants and registering all needed phenotyping traits.
In the following paragraphs, an overview is presented of recent note-worthy solutions for growth chamber phenotype acquisition and image processing approaches towards extracting phenotypes.
2.1.1 Phenotype acquisition
Until recently, due to lack of acquisition systems, phenotype analysis was usually performed by destructive techniques that required harvesting of whole plants or plant parts at regular time points. This broke down the continuity of experiments and required large numbers of replicates.
Alternatively, on site surveys were performed by experts without destruc-tion of the plant(s). For example, to assess plant growth users will either weight excised leaves or plants, or will use a caliper to get measurements nondestructively of plant leaves. To decrease the chance of error (due to measurement or biological noise) several repeated measurements were necessary. Nevertheless, both methods required specific measurements on each sample to be performed by a human, leading to high productivity loss and inherently low throughput. As imaging systems evolve (e.g., digital cameras, flatbed scanners) several users opt for capturing images of plants rather than relying on manual measurements obtained in nondestructive or destructive ways.
The introduction of automation and digital imaging allows the rapid collection of time-lapse images of plants in a nondestructive fashion [173]. These images are later analyzed offline mostly using expert analysis by manipulating photograph analysis software or semi-automated methods [173]. This has a particular impact on small scale experiments of model plants in growth chambers and several approaches have been proposed throughout the years. Most of the solutions are customized [15, 115, 173, 243, 306, 318], imposing strict experimental setups (e.g., uniform black background). Their cost and implementation complexity can range from a few hundred dollars [124, 165, 306] to a few thousands [115, 243, 310, 318], or to hundreds of thousands of dollars (e.g., the solutions provided by commercial entities such as LemnaTec,1CropDesign2[263], and Photon
Systems Instruments3). While the big investment entailed by commercial solutions is warranted, e.g., if to be offered as a service (i.e. where plant material of many labs is phenotyped) or for very large experimental studies, install base throughout the world remains limited.
High resolution images can also be captured in the visible and/or infrared spectrum. Optionally, also 3D depth information is acquired using high grade [6, 310] or lower grade (e.g., using Microsoft’s Kinect) hardware [56, 182]. However, their limited field of view requires that images are acquired with each plant in isolation and usually involves some robotic (or manual) placement of the plant (e.g., [124]) or the camera (e.g., [115, 318]), which lowers throughput or increases equipment cost.
On the other hand, some approaches assume static cameras with a fixed field of view [71, 124, 165, 306] and are largely used in growth-chamber
1http://www.lemnatec.com
2http://www.cropdesign.com
experiments of small model plants such as Arabidopsis. Such systems are simpler to deploy, are more affordable (since they do not use automation), and have higher throughput since they can image many plants at a time. However, due to the fixed camera, the per plant imaging resolution can be lower, and only few imaging angles are obtained (usually only a top-view is used), thus requiring sophisticated image analysis algorithms.
Overall, current image-based plant phenotyping solutions tightly cou-ple sensing and analysis: plant material, imaging equipment, and com-putational infrastructure reside in the same location. Albeit simpler in design, this approach presents major limitations: (a) it limits practical applications of image-based plant phenotyping (e.g., experiments taking place in the field or in remote locations would require an entirely different design); (b) image analysis software is integrated with the specific imaging setup and is typically proprietary and closed source; (c) cost of the hard-ware, accounting for a large part of the overall cost, is determined by the decision of the manufacturer (e.g., type and quality of imaging equipment, robotics). To overcome these limitations, in Chapter 6 we introduce our proposed distributed sensing and analysis framework for image-based plant phenotyping.
2.1.2 Image analysis for phenotyping
Plant segmentationOne undoubted effect of automation is the increase in the available data for analysis, which as expected called for automation also in the analysis component. In the following paragraphs we briefly describe approaches aiming at segmenting (i.e. delineating) a plant from the background, which in turn is used to measure plant growth or other color and shape traits.
To appreciate the segmentation problem at hand, Figure 2.1 shows the variability of appearance and shape: (i) among several mutants of the Arabidopsis family, (ii) through the life-cycle of the same plant, and (iii) within individuals of the same genotype. Although several other methods have been developed for the segmentation (and classification) of individual leaves [44, 70, 298] (e.g., for plant identification purposes [13, 110]), the analysis of plant vein structure [76,253], and the study of root or hypocotyl growth [102, 322], here we focus on those segmenting the whole plant.
The majority of articles in plant phenotyping, since they assume strict conditions as to the composition of the scene, follow simplified approaches
Figure 2.1:Arabidopsis images showing shape variability. Left: sketch representations of Arabidopsis mutants adapted from [208]. Center: two plants imaged at different growth stages, earlier shown left-most. Right: a top-view image showing many individual plants (all wild type, Col-0).
to the subsequent segmentation problem. They usually employ threshold-ing based approaches in one channel (e.g., the native green channel of an RGB acquisition or on one channel of other color spaces) or multiple chan-nels. Those with strict restrictions on the scene rely either on calibrated thresholds [124], or on histogram based methods such as Otsu’s thersh-olding or Gaussian mixture modeling of intensities to identify data driven thresholds [71, 170]. Some methods rely on combining more than one channel indirectly (e.g., in [71] individual segmentations from each chan-nel obtained via thresholding are combined) or directly via unsupervised clustering methods [61, 306]. A learning approach for weed classification in field applications is proposed by Haug et al. [125], based on a random forest classifier and Markov random field smoothing. However, changes in the scene can pose a challenge. Such changes occur frequently as Fig-ure 2.2 illustrates. For example, the soil can appear more or less dry, moss (which is green in appearance) can grow on the soil, reflections due to water and illumination distortions can be also present. While some users will remove such data from analysis, this lowers the number of instances used for analysis and consequently the statistical power of the experiment. Furthermore, approaches such as scratching the soil to remove out moss may change a plant’s position, breaking the location correspondence from previous images assumed by most approaches.
From an imaging perspective, few systems utilize additional infor-mation from other imaging sources or modalities (such as depth or in-frared information) to facilitate the segmentation approach [6, 56, 310]. For example, using color in combination with depth images or multiple
Figure 2.2:Examples of challenging images due to changing conditions during an experiment. Examples shown are: (left) drought where the soil appears more brown; (center) green moss growing on the soil; and (right) water residual in the tray causing reflections.
images for supervised or unsupervised plant segmentation is common practice [6, 29, 152, 257, 285, 290, 299, 321]. However, few laboratories have the capacity to deploy such sensing technology due to its higher cost and lower (in some cases) throughput.
On the other hand, one approach towards dealing with complex back-grounds and changes in the scene is to introduce prior knowledge into the segmentation approach itself. Although naturally one would consider to introduce shape priors in deformable models and contour formula-tions [66, 340], it would require defining and learning shape priors of all possible plant shapes. As Figure 2.1 illustrates, the complexity of shape even among mutants of the same plant or among samples of the same plant species can be significant. Thus, building appropriate plant models is rather complex and learning such shape models would require a large amount of previously labeled information; as a result, no such method exists in the literature.
Individual leaf segmentation
An alternative and more fine-grained approach towards growth estima-tion would be to rely instead on leaf models, and try to segment individual leaves within the scene. At first glance the problem of leaf segmentation appears similar to leaf identification and isolated leaf segmentation. Re-search on the latter has been motivated by several datasets showing leaves in isolation cut from plants and imaged individually, or showing leaves on the plant but with a leaf encompassing a large field of view (e.g., em-ulating imaging via a smart phone application). This problem has been addressed in an unsupervised [289, 328], shape-based [43], and interac-tive [40, 43] fashion. For example, Felzenszwalb [93] represents shapes by deformable triangulated polygons to detect precisely described objects, including maple leaves. In simplifying the shape descriptor, the authors in [44] propose a parametric active polygon model to take advantage of prior knowledge on leaf shapes to design a flexible time-efficient model, in a classification and leaf recognition problem. Although these methods are capable of segmenting individual leaves in isolation, they require prior training and large labeled datasets, usually they cannot handle occlusions, and they would require significant post processing to compose the final complete plant segmentation.
However, the problem at hand is radically different. The goal is not to identify the plant species (usually known in this context) but to segment accurately each leaf in an image showing a plant (cf. Figure 3.7 on page 46). This multi-instance segmentation problem is extremely complex in the context of this application, due to the variability in shape, pose, and appearance of leaves, but also due to lack of clearly discernible boundaries among overlapping leaves with typical imaging conditions where a top-view fixed camera is used.
Several authors have considered leaf segmentation in a tracking context, where temporal information is available. For example, Yin et al. [339] segment and track the leaves of Arabidopsis in fluorescence images using a Chamfer-derived energy functional to match available segmented leaf templates to unseen data. Dellen et al. [74] use temporal information in a graph based formulation to segment and track leaves in a high spatial and temporal resolution sequence of tobacco plants. Aksoy et al. [4] track leaves over time, merging segments derived by superparametric clustering by exploiting angular stability of leaves. De Vylder et al. [70] propose a probabilistic parametric active contour formulation that optimizes an
energy function by maximizing the probability that the contour is on the edge of a leaf, and use it to segment and track Arabidopsis leaves in time-lapse fluorescence images.
Even in the general computer vision literature, this type of similar appearance, multi-instance problem is not well explored. Although sev-eral interactive approaches exist [114, 226], user interaction inherently limits throughput. Therefore, here we discuss several interesting learning-based object segmentation approaches, which might be adaptable to leaf segmentation. Wu and Nevatia [335] present an approach that detects and segments multiple, partially occluded objects in images, relying on a learned, boosted whole-object segmentor and several part detectors. Given a new image, pixels showing part responses are extracted and a joint likelihood estimation inclusive of inter-object occlusion reasoning is maximized to obtain final segmentations. Notably, they test their approach on classical pedestrians datasets, where appearance and size variation does exist, so in leaf segmentation where neighboring leaves are some-what similar this approach might yield less appealing results. Another interesting work [266] relies on Hough voting to jointly detect and segment objects. Interestingly, beyond pedestrian datasets they also use a dataset of house windows where appearance and scale variation is high (as is common also in leaves), but they do not overlap. Pape and Klukas [239] rely on unsupervised clustering and distance maps to segment leaves. Finally, graphical methods have also been applied to resolve and segment overlapping objects [127], and were tested on datasets of horses.
Till now, the evaluation and development of leaf segmentation algo-rithms using a common reference dataset of individual images without temporal information is lacking, and the datasets described in Chapter 3 aim at filling this gap.
2.2 Computer vision challenges in plant
pheno-typing
Noninvasive plant investigations are done on different scales and modali-ties using a variety of sensors [77,182]. This includes optical, hyperspectral imaging to reveal rich pixel information on plant properties, and even magnetic resonance imaging (MRI) and positron emission tomography (PET). Spatial scales vary from the microscopic subcellular level to large outdoor fields. Typical problems in measuring a plant’s visible properties
comprise measuring size, shape, and other structural traits of whole plants, their organs (leaves, fruits, roots, etc.), or plant populations.
Plants are not static, but self-changing systems with complexity in shape and appearance increasing over time. They emerge below image resolution, and grow exponentially in time until, for a single leaf, growth levels off typically at several cm2 size, i.e. several orders of magnitude
change. Relevant time scales for cellular processes may be seconds or minutes, for growing leaves in the range of hours, and the status of whole plants changes over days or even months, in which the surrounding envi-ronmental (as well as measurement) conditions may also change. Environ-mental conditions add yet another dimension, not only to the plants, but also to imaging. In some cases images may be acquired under controlled conditions, but often are taken in challenging environments occurring in the field, in greenhouses, employing automated acquisition setups. Structural break due to resolution limitations (too small leaves) or due to spontaneous biological events (e.g., cell division) exist and algorithms need to deal with leaves (or new cells) emerging within the scene. Finally, the plant is a complex and adaptive organism: any attempt to measure phenotype must respect the complex biophysiological system of the plant and should not interfere or alter its behavior. For example, if the plant expects a dark environment (e.g., night conditions), we should not use lights to image it, because this may influence the circadian rhythm as the photo-systems of plants are highly sensitive.
2.2.1 From the microscopic to the macroscopic: Challenges
and dimensions
Algorithms must deal with the above complexity and the next paragraphs describe unique challenges by illustrating typical applications. Clearly, the list of applications can never be complete, as in principle phenotypic traits can be derived for every single detail known in plant physiology, but we present some of the major themes, together with different versions of the same theme arising from using different imaging modalities. Cells and organs: Detection, tracking, and structural breaks
One of the earliest forms of phenotyping where imaging based setups were used, is in the context of microscopy [77]. Plant tissue samples are excised from roots, leaves, etc. and imaged in a microscope to reveal the
A B C D E
F G H J K
M N O
L
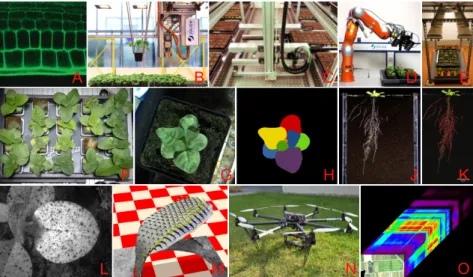
Figure 2.3:Example plant phenotyping setups and images. At the smallest scale, microscopy can image cells (A). Movable imaging setups (B, C, D) or a single overview camera setup (E) can be used to image many plants (F) or single plants (G). Roots can be imaged in rhizotrons (J), requiring delineation (K). Leaf segmentation (H) and optical flow tracking (L, M) can measure growth. Airborne vehicles, e.g. drones (N), can provide information on fields, e.g. hyperspectral images (O). Image (A) adapted from [254]; other images courtesy of: (B, C, N) Alexander Putz, (J, K) Kerstin Nagel, and (O) Uwe Rascher.
cellular structure of the underlying tissue (cf. Figure 2.3A). Typical need from an image processing perspective is the automated delineation of cell walls to establish cell morphology and cell count. Early on techniques relying on intensity or edge based segmentation approaches were used, while more recently advancements in connected snakes and level sets have been introduced to solve this problem in a more reliable and automated fashion.
However, more interesting problems arise from the use of recent tech-niques such as confocal microscopy, optical projection tomography and coherence microscopy (OPT and OCM), which permit the noninvasive quantification of cellular morphometry at a variety of scales and depths. These techniques enable observation of plant tissue dynamics on a short
(and long) time scale, so problems of tracking arise. These become partic-ularly challenging when cell genesis needs to be observed and quantified, since cell division and expansion impose high spatio-temporal fidelity requirements. This problem, which occurs also in other biomedical appli-cations, from a computer vision perspective entails the inference of time and location of when/where such events occur within the scene, a task radically different from the typical tracking of objects entering or leaving the scene.
As the resolution of these techniques increases the amount of data produced increases as well, however, it does not reach the high throughput requirements of other applications since usually few plants are studied and their preparation does require significant amount of expert handling. Until automation replaces the expert, in cell-level investigations the bottleneck will remain in the sample preparation and imaging steps and not in the image analysis.
Organ level: Detection and segmentation
Over the last decade, several controlled setups have emerged, that im-age top-down views of small rosette plants (referring to the circular and radial cluster of leaves they form when growing), such as e.g., Arabidop-sis or tobacco, acquiring either one plant per image or several plants at once (see Figures 2.3B–2.3G), housed in so-called growth chambers where environmental conditions are controlled. Even in this very restricted imaging scenario fully automatic segmentation of single plants can be a challenge due to, e.g., background clutter due to moss growing on the soil, plant-to-plant overlap, heavy contrast changes due to self-shadowing, leaf color changes due to stress (e.g., drought), different light conditions, and pathogen infections, plant shape or size variation due to genotypic differences (cultivars or mutants) and treatments.
Segmenting single leaves is a typical multi-instance segmentation task (see Figures 2.3G, and 2.3H). However, even though all the objects share a wide range of features (e.g., they are mostly green with similar brightness distributions), they show rich variation in shape and pose due to environ-mental influences or genotype, even for the same species. Leaves differ in size over several orders of magnitude, introducing a structural break due to resolution limitations, and algorithms need to deal with leaves emerging in the scene.
ba-sic shape, they overlap, bend, and vary in pose. Even for the same species, leaves may differ substantially, as leaf shape, size, color and overall ap-pearance of a plant depend on the genotype (e.g., there are thousands of mutants available for Arabidopsis alone), environmental factors (drought, low or high light, and temperature), and the age of each leaf. Readily ap-parent approaches based on learning shape from a labeled dataset reveal their limitations when having to deal with such shape diversity and differ-ent acquisition conditions. While counting and segmdiffer-enting leaves from such images can be simple for a human, there is no automated algorithmic solution available yet, which comes close to human performance. Whole plants: Anatomically correct 3D geometric modeling
For larger plants reconstruction from a single image and viewpoint is not sufficient. Most approaches aim at obtaining an as complete 3D shape re-construction as possible, modeling geometrically the overall above-ground part of a plant, i.e. the shoot. However, also details of parts are investigated like grains on an ear of corn, berries on wine grapes, flower development, early symptoms of wilting or pest infestation, multi-plant canopy prop-erties (e.g., for light distribution simulation within a field), etc. Imaging becomes more and more automated using conveyor-belt or robotized sys-tems (see Figures 2.3B–2.3D), allowing high throughput with thousands of plants. Automation of image analysis is then a must.
A variety of 3D measuring strategies is currently investigated, e.g., correspondence-based triangulation methods, silhouette-based carving, time-of-flight cameras or light detection and ranging (LiDAR) laser scan-ning (see [250] for a comprehensive overview). Setups are usually tailored to a particular species and conditions. This is for example due to size and image resolution constraints, flexibility and deformability of a plant when moved, or self-occlusion and self-similarity hampering triangulation.
Silhouette-based methods find a plants silhouette and project it back into the 3D volume – often represented by a voxel grid – where the plant shall be reconstructed. Intersecting the volumes refines the thus derived 3D model. Correspondence-based methods try to find similar image patches or feature points in images taken from different viewpoints. This allows triangulating 3D points, resulting in 3D point clouds. When visi-ble structure on leaves is too shallow, combining cameras with a pattern projector increasing local image contrast can help. Still, for more complex plants self-occlusion limits triangulation, as ensuring that patches are
visible from two or more viewpoints requires more and more viewpoints. Time-of-Flight cameras or LiDAR laser scanning yield point clouds inde-pendent of visual structure and without triangulation. Current drawbacks are either long acquisition times, high cost, or limited resolution.
A major challenge for all 3D measuring methods is plant motion during acquisition. Especially for outdoor measurements with wind, time delays due to scanning or sequential image acquisition lead to notable geometric distortions. Then the data cannot be described by a static model and all current approaches doing so fail one way or another.
From the 3D data, quantitative information about plant traits need to be extracted. Simple summary traits, such as covered volume or plant height, could be estimated from images alone without 3D reconstruction. But organ-wise traits, e.g., accurate leaf size or branching angle, require interpretation of 3D data and plant part models. Simple models are used today (e.g., fitting 2D surfaces to patches and merging them), but for most species new anatomically correct models are required.
Where imaging by acquiring light with cameras is not sufficient or pos-sible, volumetric imaging techniques can be applied. Magnetic Resonance Imaging (MRI) and x-ray Computed Tomography (CT) are the most com-mon modalities on plant shoot scale, and are sometimes combined with Positron Emission Tomography (PET) in order to investigate metabolic processes and carbon transport. Their main strength, however, is root system analysis in soil, where classical, light-based imaging techniques are extremely limited.
Whole plants below ground: Cluttered images of roots
It is not possible to look through soil by naked eyes. Thus, classical root sys-tem analysis is invasive, meaning that plants are dug out, the roots washed and photographed or scanned using flatbed scanners – a destructive and low-throughput process. Usual image analysis then applies threshold-based segmentation, connected component labeling, and skeletonization, followed by estimation of traits such as overall graph length, branch-ing angles and others. All solutions available to date have only limited effectiveness when root systems are heavily entangled. Obviously, no time-series analysis can be performed when plants are dug out.
Noninvasive methods using standard camera imaging require other substrates than opaque soil. Well-established are aeroponics (growing in air or mist), hydroponics (water), transparent agar or gellan gum filled
Petri dishes or tubes, or paper or other flat surfaces kept wet with nutrient solution. In aeroponics or hydroponics root systems are not well formed and roots stick together. In transparent agar or gellan gum root systems are well visible and can be well segmented or even be reconstructed in 3D when imaged from multiple views. However, roots grown in soil look quite different.
In soil, roots can be imaged noninvasively using so-called rhizotrons [223], i.e. flat pots with large vertical windows, such that parts of the roots visibly grow along the window (see Figures 2.3J, and 2.3K). In dark soil and at high spatial resolution, segmentation of bright roots may be done with solutions developed, e.g., for angiograms in medicine; but under real-istic conditions this is difficult: even with high-resolution cameras (in the 30 megapixel range) fine roots may be only few pixels wide, blurred and with poor contrast to the surrounding soil. Many current segmentation solutions are slow or even break down when applied to such large images. Thus, computational efficiency is an issue. In addition, windows can get scratched by frequent use and soil contains all sorts of clutter. To date, reliable segmentation of such images can only be done semi-automatically, requiring user assistance. Even learning based methodologies yield unim-pressive results, which point to needs in finding (or learning) better feature representations.
Using penetrating radiation or modalities such as MRI, PET, and CT [218], roots can be imaged in soil in 3D, where different imaging techniques yield complementary contrast information and metabolic func-tion (e.g., with PET). MRI has high contrast between root and soil for not too wet soils. Then, even fine roots with sub-resolution diameter can be measured due to the so-called ‘partial volume effect’. Segmentation proce-dures are similar to angiogram segmentation in medical image processing. X-ray CT features much higher spatial resolution than MRI, however at the cost of lower soil-root contrast. 3D positron emission tomography (PET) can be used to visualize metabolic processes and carbon transport within plant tissue. For this, radioactive11CO2is fed to a plant and radioactive decay is measured. Modeling and quantifying transport is an active re-search topic. Challenges are similar to medical applications including proper (co-)registration of time-series of deforming objects of potentially different modalities, disentangling objects, measuring geometric traits, etc. However, artifacts and structures are different.
Adding dynamics: Tracking, flow, and growth estimation
For many plant traits temporal dynamics are of high relevance. Growth analyses on local tissue level are typically performed on image sequences with frame rates in the range of one per minute. A long-established tech-nique restricts the leaf of interest to a plane by pulling it flat, and images it using a single camera. Growth is then calculated as divergence of an estimated optical flow field. Unfortunately, with this simple engineering solution, gene expression analyses have shown that ‘tension-stress genes’ are turned on during such experiments, and thus the observed growth may be influenced on the molecular level. For non-fixed leaves moving in 3D, calculating scene flow from multi-camera ‘light-field’ image sequences has been investigated (see Figures 2.3L, and 2.3M). This allows precise translation and rotation field estimation. Local growth can also be esti-mated from divergence, however, signal-to-noise-ratio is relatively poor. To date, no reliable local growth measuring technique without fixating leaves is available.
When growth analysis in terms of summary growth over an organ is aimed for, segmentation or reconstruction techniques as described earlier are needed. For simple plant architectures, e.g., young tobacco with up to 8 leaves, or Gossypium with up to 6 leaves well separated by long stem parts, leaf-wise tracking in temporally sufficiently high-resolved datasets has been demonstrated [74]. When time intervals become larger, or plant complexity is higher, no reliable method for leaf-wise tracking has been reported in literature so far. Clearly, when leaf segmentation and tracking are solved, growth analysis in terms of size change over time becomes trivial.
Spectral image analysis: Spanning all scales
Multi-spectral and thermal imaging has become increasingly popular as sensors become affordable. Spectral resolved imaging is applied at various scales (cf. Figure 2.3O), typically ranging from small (plant parts) to large (remote sensing from unmanned aerial vehicles (UAVs) for field operations, or even from satellites), allowing for noninvasive functional analysis even at night or under low-light conditions.
A multitude of modalities intersect with a variety of applications [119]. Infrared thermography carries functional information in terms of tempera-ture allowing to study, e.g., heat dissipation and photosynthetic efficiency,
water status (to help regulate irrigation regime or water resource manage-ment), response to drought, or water deficit. Imag