METHOD FOR THE DETERMINATION OF CLADRIBINE
BULK AND IN TABLET DOSAGE FORM
A Dissertation submitted to
THE TAMILNADU Dr. M.G.R. MEDICAL UNIVERSITY, CHENNAI – 600 032
In partial fulfillment of the requirements for the award of the degree of MASTER OF PHARMACY
IN
PHARMACEUTICAL ANALYSIS
Submitted By M.VENKATESH Reg. No:261630704
Under the guidance of
Dr. P.KALAISELVI, M. Pharm., Ph.D., Associate Professor
DEPARTMENT OF PHARACETICAL ANALYSIS JKKMMRF’S – ANNAI JKK SAMPOORANI AMMAL
COLLEGE OF PHARMACY, KOMARAPALAYAM – 638 183
CONTENTS
CHAPTER
NO. CONTENTS
PAGE NO.
1 INTRODUCTION 1
2 DRUG PROFILE 36
3 LITERATURE REVIEW 40
4 AIM AND PLAN OF WORK 43
5 MATERIALS AND MERTHOD 44
6 RESULTS AND DISCUSSION 53
7 SUMMARY AND CONCLUSION 83
FIGURE
NO.
SUBJECT
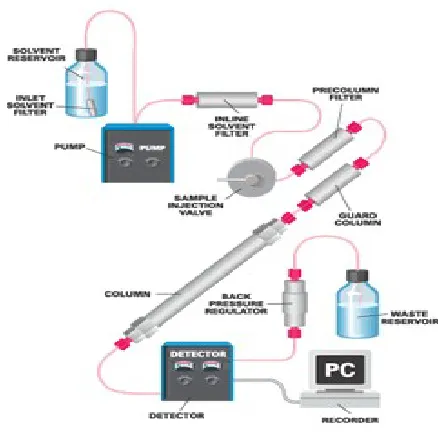
1 Flow diagram of an HPLC system
2 Calibration Curve of Standard Addition Method
2a UV spectrum of Cladribine in Phosphate Buffer pH 3.5 : acetonitrile(30 : 70 %v/v)
3 Chromatogram of Cladribine Blank Phosphate Buffer pH 3.5:Acetonitrile 30: 70%V/V by RP-HPLC method
4 Chromatogram of Cladribine in Water : Methanol 50: 50 %V/V by HPLC 5 Chromatogram ofCladribine in Water: Acetonitrile 40: 60 %V/V by HPLC 6 Chromatogram of Cladribinein Phosphate Buffer pH3:Methanol 50:
50%V/V
7 Chromatogram ofCladribine in Phosphate Buffer pH3.5:Methanol 40: 60%V/V
8 Chromatogram ofCladribine in Phosphate Buffer pH3.5:Acetonitrile40: 60%V/V
9 Chromatogram of Cladribine in Phosphate Buffer pH3.5:Acetonitrile30: 70%V/V
10 Optimized Chromatogram of Cladribine by HPLC method
11 Linearity chromatogram of Cladribine 10 µg/ml by HPLC method 12 Linearity chromatogram of Cladribine 20 µg/ml by HPLC method 13 Linearity chromatogram of Cladribine 30µg/ml by HPLC method 14 Linearity chromatogram of Cladribine 40µg/ml by HPLC method 15 Linearity chromatogram of Cladribine 50µg/ml by HPLC method 16 Calibration Curve of Cladribine by HPLC method
17 Chromatogram forLODofCladribine by HPLC method 18 Chromatogram forLOQofCladribine by HPLC method
% Percentage
% RSD Percentage Relative Standard Deviation
Hg Microgram
Pi Microliter
m Micrometer
API Active Pharmaceutical Ingredient AAS Atomic Absorption Spectroscopy Avg, Average
AMD Automated Multiple Development Cm Centimeter
CI Confidence Interval
DAA Direct-Acting Antiviral Agent DSC Differential Scanning Colorimetry DMSO Dimethyl Sulfoxide
DMF Dimethyl Formamide
GC Gas Chromatography
HCV Hepatitis C Virus
HIV Human Immunodeficiency Virus
HPLC High Performance Liquid Chromatography HPTLC High Performance Thin Layer Chromatography HSTLC High Speed TLC
LC Liquid Chromatography LOD Limit of Detection LOQ Limit of Quantitation mg Milligram
ml Milliliter mm Millimeter min Minutes ng Nano gram nm Nanometer
NMR Nuclear Magnetic Resonance NMT Not more than
ODS Octa Decyl Silane
OPLC Over Pressured Layer Chromatography R Regression coefficient
r2 Correlation coefficient
Rf Retention factor
RP- HPLC Reverse Phase High Performance Liquid Chromatography RPL Rotation Planer Chromatography
SD Standard Deviation SE Standard Error
SFC Super Critical Fluid Chromatography S.NO Serial number
1. INTRODUCTION
Analytical chemistry is a measurement science consisting of a set powerful ideas and methods that is useful in all fields of science and medicine. Analytical Chemistry is applied throughout industry, medicine and all the sciences.
Analytical chemistry can be split in to two main types a. Qualitative Analysis
b. Quantitative Analysis
a. Qualitative Analysis
Qualitative Analysis reveals the identity of the elements and compounds in a sample.
b. Quantitative Analysis [Skoog, et al., Fundamentals of Analytical Chemistry 2007] Quantitative Analysis indicates the amount of each substance in a sample. More commonly a separation step is a necessary part of the analytical process.
Quality control is a concept which strives to produce a perfect product by series of measures designed to prevent and eliminate errors at different stages of production. The decision to release or reject a product is based on one or more type of control action. With the growth of pharmaceutical industry during last several years, there has been rapid progress in the field of pharmaceutical analysis involving complex instrumentation. Providing simple analytical procedure for complex formulation is a matter of most importance. So, it becomes necessary to develop new analytical methods for such drugs. In brief the reasons for the development of newer methods of drugs analysis are
A proper analytical procedure for the drug may not be available in the literature due to Patent regulations.
The Nature of Analytical Chemistry
Change Chemical
Carry out Chemical dissolution No
Measurable Property Yes Eliminate
Measure Property
Calculate Results
Estimate reliability of results Select Method
Acquire sample
Process sample
Factors affecting the choice of Analytical Methods
Analytical techniques have different degrees of sensitivity, Selectivity and Sophistication. An important task for the analyst is to select the best procedure for a given determination.
a) The type of analysis is required.
b) The problem arising from the material to be investigated (Sample).
c) Possible interference from components of the material other than those of interest.
d) The concentration range. e) The accuracy required.
f) The facilities available, particularly the instruments. g) The time required to complete the analysis.
h) Similar type of analysis to be performed.
Different types of modern pharmaceutical analytical techniques used in pharmaceutical analysis
A.Titrimetry Methods
1. Acid – Base titration 2. Precipitation titration 3. Redox titration
B. Gravimetric Methods
1. Weigh drug after extraction.
C.Spectrophotometric Methods
1. Colorimetric method
2. UV method
3. Flourimetric method
4. Flame photometry
5. Atomic absorption spectroscopy
6. Infrared spectroscopy
7. Raman spectroscopy
8. X-Ray spectroscopy
9. Mass spectroscopy
10. Dye complex method
D.Electro Analytical Methods
1. Potentiometry
2. Voltametry
3. Conductance techniques
E. Chromatographic Methods
1. Thin layer chromatography
2. Column chromatography
3. Paper chromatography
4. Gas chromatography
5. High Performance Liquid Chromatography
F. Hybrid Techniques
1. LC-MS
2. HPLC/ESI-MS
3. LC-DAD
Table No: 1 Types of instrumental methods [Gurdeep R Chatwalet al., 2006]
Signal Instrumental Methods
Emission of radiation Emission spectroscopy, flame photometry,
Fluorescence, radio chemical methods.
Absorption of radiation
Spectrophotometric and photometry (X-ray, UV, visible, IR); photo acoustic spectroscopy; nuclear magnetic resonance and electron spin resonance spectroscopy
Scattering of radiation Turbidimetry; nephelometry; Raman spectroscopy
Refraction of radiation Refractometry; Interferometry
Diffraction of radiation
X-Ray and electron diffraction methods
Rotation of radiation Polarimetry; optical rotary dispersion;
Circular dichroism
Electrical potential Potentiometry; chronopotentiometry
Electrical charge Coulometer
Electrical current Polarography; Amperometry
[image:13.612.86.528.80.707.2]Mass-to-charge ratio Mass spectrometry
Rate of reaction Kinetic methods
Thermal properties Thermal conductivity and enthalpy
Radioactivity
Activation and isotope dilution methods
1.1 Ultra Violet Spectroscopy [Sharma, 1994]
Spectrophotometric is used for both qualitative and quantitative investigations of samples. Ultra Violet absorption spectroscopy deals with the measurement of energy absorbed when electrons are promoted to higher energy levels. The UV spectrum of a molecule results from transitions between electronic energy levels accompanied by changes in both vibrational and rotational states.
The UV spectrum may be divided in to the following regions a. Far (or) Vaccum UV (10 – 200nm)
b. Near (or) Quartz UV (200 – 400nm) c. Visible region (400 – 800nm)
Choice of solvent [Sharma 1994; Gurdeep R. Chatwal, et al., 2006]
1. The solvent used should be high purity generally referred to as “Spectrograde”. 2. A good solvent should be transparent over the desired range of wavelengths.
4. A solvent should be chosen so that it does not react chemically with the sample.
Detectors
A detector is a transducer converting electromagnetic radiations in to an electron flow and subsequently in to a current flow (or) voltage in the read out circuit. Detectors used in UV- Visible Spectrophotometers can also be used as Photometric Detectors. The most commonly used detectors are,
1. Barriers Layer Cell or Photo Voltaic cell 2. Photo tubes or photo emissive cells and 3. Photo Multiplier tubes.
1.2 INTRODUCTION TO CHROMATOGRAPHY
[Sharma,
et al.,
2002;
Beckett
et al
., 2007]
Chromatography may be defined as a method of separating a mixture of components through equilibrium distribution between two phases (Stationary Phase and Mobile Phase) Chromatography is a technique for separating mixtures into their components in order to analyze, identify, purify, and/or quantify the mixture or components.
1.2.1 INTRODUCTION TO HPLC (Sethi P. D,2007, 2008)
HPLC was referred to as High pressure liquid chromatography but nowadays the term High Performance Liquid Chromatography. High performance liquid chromatography is the fastest growing analytical technique for the analysis of drugs. Its simplicity, high specificity and wide range of sensitivity make it ideal for the analysis of many drugs in both dosage forms and biological fluids. The principle of separation ii normal phase mode and reverse phase mode. Liquid chromatography is an analyticalchromatographic technique that is useful for separating ions or molecules that are dissolved in a solvent. RP-HPLC usually is used because of convenience, wide applicability.Most of the multi component dosage forms can be analyzed by HPLC because of several advantages.
1. No need any tedious extraction & Isolation process. 2. Greater sensitivity (Due to several detectors).
3. Better resolution due to wide variety of stationary phases. 4. Instrumentation tends itself to automation and quantitation.
1.2.2 Different Types of Principles [Jeffery et al., 1989; Mendham et al., 2002; H. H Willard et al., 1986]
HPLC can be classified into several types, which are as follows: 1. Normal Phase Chromatography (NPC)
2. Reverse – Phase Chromatography (RPC)
3. Liquid – Solid Chromatography or adsorption HPLC 4. Liquid – Liquid Chromatography or Partition HPLC 5. Ion exchange Chromatography or Ion exchange HPLC 6. Size exclusion or gel permeation or steric exclusion HPLC
1. Normal Phase Chromatography (NPC)
Normal phase HPLC (NP-HPLC) in this method separation of analytes is based on polarity. If Compounds containing non polar groups means normal phase mode is used. In normal phase stationary phase is polar and Mobile phase is non polar. Sample retention in normal phase chromatography increases with the polarity of mobile phase decreases. They are eluted and detected in the order of increasing polarities. Hence this technique is not widely used in pharmacy.
2. Reverse – Phase Chromatography (RPC)
components get eluted first and non polar compounds are retained for a long time. Almost all the pharmaceuticals and the drugs are polar in nature and so they are not retained for a longer time and eluted faster.
Water < Methanol < Acetonitrile < Ethanol <Tetrahydrofuran< Propanol < Methylene chloride.
3. Liquid – Solid Chromatography or adsorption HPLC
The principal of separation is by means absorption. Separation of the components takes place because of the difference in affinity of components towards stationary phase. The interaction between the solute and the adsorbent is optimum when solute overlap with the absorbents. The adsorbent is made up of silica and alumina. This principle is seen in both NP-HPLC and RP-HPLC.
4. Liquid – Liquid Chromatography or Partition HPLC
5. Ion exchange Chromatography or Ion exchange HPLC
The principle of separation of is by reversible exchange of ions between the ions present in the solution and those present in the ion exchange resin. Ion exchange is probably the most frequently used chromatographic technique for the separation and purification of proteins, polypeptides, nucleic acids, polynucleotide’s and other charged bio molecules. In this type of chromatography, the use of a resin (the stationary solid phase) is used to covalently attach anions or cations onto it. Solute ions of the opposite charge in the mobile liquid phase are attracted to the resin by means of electrostatic forces.
6. Size exclusion or gel permeation or steric exclusion HPLC
Gel Chromatography is a simple and reliable method for separating molecules according to size. A gel is used to separate the components from a mixture. Selectivity is based on steric factors between the adsorbate and the adsorbent is utilised in achieving in achieving specific separations through gel chromatography. It is usually applied to large molecules or macromolecular complexes such as proteins and industrial polymers. Gel chromatography has been used with great success in the separation of the sugars, polypeptides, proteins, liquids, asphalts, silicon polymers and others.
1.2.3 INSTRUMENTATION OF HPLC: [http://webstore.idex-hs.com]
regulator and/or solvent sparing system. The function of each of these components is briefly described below.
HPLC system begins with the solvent reservoir, which contains the solvent used to carry the sample through the system. The solvent should be filtered with an inlet solvent filter to remove any particles that could potentially damage the system's sensitive components. Solvent is propelled through the system by the pump. This often includes internal pump seals, which slowly break down over time. As these seals break down and release particles into the flow path, an inline solvent filter prevents any post-pump component damage.
The next component in the HPLC system is the sample injector, also known as the injection valve. This valve, equipped with a sample loop of the appropriate size for the analysis being performed, allows for the reproducible introduction of sample into the flow path. Because the sample often contains particulate matter, it is important to utilize either a sample filter or a pre column filter to prevent valve and column damage.
Next to the injector, an analytical column allows the primary sample separation to occur. This is based on the differential attraction of the sample components for the solvent and the packing material within the column. However, a sacrificial guard column is often included just prior to the analytical column to chemically remove components of the sample that would otherwise foul the main column.
presence in the flow cell prompts an electrical response from the detector, which is digitized and sent to a recorder. The recorder helps analyze and interpret the data.
[image:21.612.156.375.447.664.2]As a final system enhancement, a back pressure regulator is often installed immediately after the detector. This device prevents solvent bubble formation until the solvent is completely through the detector. This is important because bubbles in a flow cell can interfere with the detection of sample components. Alternatively, an inert gas sparing system may be installed to force dissolved gasses out of the solvent being stored in the solvent reservoir. Each of the components described above requires fittings to couple it into a system. It is important to note that improper selection or installation of these fittings can lead to leaks or the formation of dead volume, both of which can result in poor HPLC performance
1. Pump (H. H Willard et al., 1986; Douglas A Skooget al., 2007; Sharma, 2002)
Pumping system is one of the most important features of an HPLC system. There is a high resistance to solvent flow due to the narrow columns packed with small particles and high pressures are therefore required to achieve satisfactory flow rates. The main feature of a good pumping system is that it is capable of output of at least 3.4 × 10⁷ Pa (5000 p.s.i.) and ideal there must be no pulses of flow through the system. This provides the constant and continuous flow of the mobile phase through the system; most modern pumps allow controlled mixing of different solvents from different reservoirs. The performance characteristics of the chromatographic pump and gradient makers fundamentally define and limit the kind of separations that can be performed on a liquid chromatographic system.
Three types of pumps are available,
1. Reciprocating pumps (90% of Commercial HPLC; produce pulse flow) 2. Pneumatic pumps (cannot do gradient and pressure less than 2000 psi)
3. Displacement pumps (produce flows that are independent of viscosity and back pressure)
4. The former works by uniform displacement of fixed volume of mobile phase.
Modern pumps have the following parameters: Flow rate range: 0.01 to 5 ml/min
Flow rate stability: not more than 1%
It is desirable to have an integrated degassing system, either helium purging, or membrane filtering.
2. Injector
Injector is required in LC than in GC since unwanted or interfering compounds, or both, may often be extracted, or eliminated, by selective detection. Sample introduction can be accomplished in various ways. The simplest method is to use an injection valve. In more sophisticated LC systems, automatic sampling devices are incorporated where the sample is introduced with the help of auto samplers and microprocessors. In liquid chromatography, liquid samples may be injected directly and solid samples need only be dissolved in an appropriate solvent. The solvent need not be the mobile phase, but frequently it is judiciously chosen to avoid detector interference, column/component interference, loss in efficiency or all of these. It is always best to remove particles from the sample by filtering over a 5 µm filter, or centrifuging, since continuous injections of particulate material will eventually cause
blockages in injection devices or columns.
3. Columns
Typical HPLC columns are 5, 10, 15 and 25 cm in length and are filled with small diameter (3, 5 or 10 µm) particles. The internal diameter of the columns is usually 4.6 mm; this is considered the best compromise for sample capacity, mobile phase consumption, speed and resolution. However, if pure substances are to be collected (preparative scale), then larger diameter columns may be needed. Packing the column tubing with small diameter particles requires high skill and specialized equipment. In general, LC columns are fairly durable and one can expect a long service life unless they are used in some manner which is intrinsically destructive, as for example, with highly acidic or basic eluents, or with continual injections of 'dirty' biological or crude samples. It is wise to inject some test mixture (under fixed conditions) into a column when new, and to retain the chromatogram. If questionable results are obtained later, the test mixture can be injected again under specified conditions. The two chromatograms may be compared to establish whether or not the column is still useful.
Different types of columns are used in HPLC. They are: a. Analytical column
b. Inline filters
c. Short column
d. Narrow bore column e. Guard column
4. Detectors
These are placed at the end of column and should be able to recognize when a substance zone eluted from the column. Nowadays optical detectors are used most frequently in liquid chromatographic systems. These detectors pass a beam of light through the flowing column effluent as it passes through a low volume (~ 10 µl) flow cell. The variations in light intensity caused by UV absorption, fluorescence emission or change in refractive index, from the sample components passing through the cell, are monitored as changes in the output voltage. These voltage changes are recorded on a strip chart recorder and frequently are fed into a computer to provide retention time and peak area data. The most commonly used detector in LC is the ultraviolet absorption detector. A variable wavelength detector of this type, capable of monitoring from 190 to 400 nm, will be found suitable for the detection of the majority samples.
Other detectors in common use include: Photo Diode Array UV detector (PAD) Refractive index (RI),
Fluorescence (FLU), Electrochemical (EC).
1.3 VARIOUS METHODS OF QUANTITATIVE ANALYSIS IN HPLC
[Lloyd R Slyder
et al
., 1997; Sharma, 2002]
Quantative analysis in HPLC is used know the details about the developed peak and to describe various methods for obtaining quantitative information from chromatograms such as normalising peak areas, internal standards, external standards and standard addition methods in the chromatography. Once the peak height or the peak areas are measured, there are five principle evaluation methods for quantifying the solute.
1. Normalising Peak Areas Method 2. Internal Standard Method
3. External Standard Method 4. Standard Addition Method 5. Calibration by Standards
1. Normalising Peak Areas Method
2. Internal Standard Method
The internal standard methodis a variation on the above, and is recommended for accurate quantitative work. It eliminates the need for accurate injections since a reference standard is included in each sample analysed. Then a quantity of the internal standard is added to the raw sample prior to any sample pre treatment or separation operations.
The peak area of the standard in the sample is allowed to run and is compared with the peak area when the standard is also run separately. This ratio serves as a correction factor for the variation in sample size for losses in any preliminary pre treatment operations or for incomplete elution of the sample. The material selected for the internal standard must be completely resolved from adjacent sample components and should not interfere with the sample components and should never be present in samples
standard internal of Area sample of Area Ratio Area standard the of ion Concentrat x standard internal of Area Sample of Area ion Concentrat Sample
3. External Standard Method
This method separates the injection of a fixed volume of sample and standard solution. Here the peaks are integrated and concentration of the sample is calculated.
4. Standard Addition Method
Standard addition methodis used in many techniques in analytical chemistry. It is of limited use in chromatography because of the difficulty of injecting accurately known amounts of sample. A sample mixture is analysed for the analytes of interest by adding a specified amount of this analytes to the sample, thus increasing its concentration. The analysis is then repeated and the resulting increase in peak area due to addition of the standard amount is noted. Hence, the concentration of the analytes in the original sample may be calculated. If only few samples are to be chromatographed, it is possible to employ the method of standard addition (s).
If an instrumental reading (area/height) ‘Rx’ is obtained, from a sample of unknown ‘x’ and a reading ‘Rt’ is obtained from the sample to which a known concentration ‘a’ of analytes has been added, then ‘x ’ can be calculated from.
Rx
t R
X R a X
X
A correction for dilution must be made if the amount of standard added changes the total sample volume significantly. It is always advisable to check the result by adding at least one other standard.
4. Calibration by Standard
Calibration curves for each component are prepared by using pure standards and by using identical injection volumes of operating conditions for standards and samples. The concentration of solute is read from its curve if the curve is linear.
X = K x Area. Where,
X = Concentration of solute.
K = Proportionality constant (slope of the curve).
In this method of evaluation only the area of the peaks of interest is measured. Relative response factors are considered when converting the areas to volume and when the response of a given detector differs for each molecular type of compounds.
1.4 VALIDATION OF ANALYTICAL METHOD IN PHARMACEUTICAL
ANALYSIS
[Q2A- ICH Guidelines, 1994; Q2B- ICH Guidelines, 1996]
in the pharmaceutical industry. The International Conference on Harmonisation (ICH) has provided definitions of validation issues included in “analytical procedures” for the fields of bio analytical methodology, pharmaceutical and biotechnological procedures. Likewise the US Pharmacopeia (USP) has published guidelines for method validation for analytical methods for pharmaceutical products. However the guidelines from ICH and USP are not as detailed as those from the FDA, and in the analytical biotechnology area there exists no detailed validation guidelines. The most common validation parameters will be briefly described below.
1.4.1 TYPES OF ANALYTICAL PROCEDURES TO BE VALIDATED (Q2A- ICH Guidelines, 1994; Q2B- ICH Guidelines, 1996)
The validation of analytical procedures is directed to the three most common types of analytical procedures
Quantitative tests for impurities' content. Limit tests for the control of impurities.
Quantitative tests of the active moiety in samples of drug substance or drug product or other selected component(s) in the drug product.
Identification tests are intended to ensure the identity of an analytes in a sample this is normally achieved by comparison of a property of the sample to that of a reference standard.
Assay procedures are intended to measure the analytes present in a given sample. The same validation characteristics may also apply to assays associated with other analytical procedures.
The objective of the analytical procedure should be clearly understood since this will govern the validation characteristics which need to be evaluated. Typical validation characteristics which should be considered are listed below:
1. Accuracy
2. Precision
a. Repeatability
b. Intermediate Precision
c. Reproducibility
3. Specificity
4. Detection Limit & Quantitation Limit
5. Linearity
6. Range
7. Robustness
1. Accuracy
“The accuracy of an analytical procedure expresses the closeness of agreement between the value which is accepted either as a conventional true value or an accepted reference value and the value found”. Accuracy can be demonstrated by the following approaches:
Inferred from precision, linearity and specificity.
Comparison of the results with those of a well characterised, independent procedure.
Application to a reference material (for drug substance)
Recovery of drug substance spiked to placebo or drug product (for drug product).
Recovery of the impurity spiked to drug substance or drug product (for impurities).
For the quantitative approaches, at least nine determinations across the specified range should be obtained.
2. Precision
“The precision of an analytical procedure expresses the closeness of agreement (degree of scatter) between a series of measurements obtained from multiple sampling of the same homogeneous sample under the prescribed conditions. Precision may be considered at three levels; repeatability, intermediate precision and reproducibility.
a. Repeatability
b. Intermediate Precision
Intermediate precision includes the influence of additional random effects within laboratories, according to the intended use of the procedure, for example, different days, analysts or equipment, etc.
c. Reproducibility
Reproducibility is the precision between laboratories (collaborative or inter Laboratory studies), is not required for submission, but can be taken into account for standardisation of analytical procedures.
3. Specificity
Specificity is the ability to assess unequivocally the analytes in the presence of components which may be expected to be present. Typically these might include impurities, Degradants, Matrix, etc. Lack of specificity of an individual procedure may be compensated by other supporting analytical procedure. If specificity is not assured in the method, method Accuracy, precision and linearity all are seriously compromised. Method specificity should be reassessed continually during validation and subsequent use of the method
4. Detection Limit & Quantitation Limit
The detection limit of an individual analytical procedure is the lowest amount of analytes in a sample which can be detected but not necessarily quantitated as an exact value.
The detection limit (LOD) may be expressed as LOD = 3.3 s/ S
Where,
s = the standard deviation of the response.
S = the slope of the calibration curve (of the analytes).
The quantitation limit of an individual analytical procedure is the lowest concentration of analytes in sample which can be quantitatively determined with suitable precision and accuracy.
Quantitation Limit (LOQ) may be expressed as LOQ = 10 s/S
Where,
s = the standard deviation of the response.
5. Linearity
The linearity of an analytical procedure is its ability (within a given range) to obtain tests results which are directly proportional to the concentration (amount) of analytes in the sample. It may be demonstrated directly on the analytes, or on spiked samples using at least five concentrations over the whole working range.
6. Range
The range of an analytical procedure is the interval between the upper and lower concentration (amounts) of analytes in the sample (including these concentrations) for which it has been demonstrated that the analytical procedure has a suitable level of precision, accuracy and linearity. The range of concentrations examined will depend on the type of method and its use.
7. Robustness
8. Ruggedness
The ruggedness of an analytical method is the degree of reproducibility of test results obtained by the analysis of the same samples under a variety of conditions, such as different laboratories, different analysts, different instruments, different days, etc. Ruggedness is normally expressed as the lack of influence on test results of operational and environmental variables of the analytical method. Ruggedness is a measure of reproducibility of test results under the variation in conditions normally expected from laboratory to laboratory and from analyst to analyst.
Table No: 2 ACCEPTANCE CRITERIA OF VALIDATION FOR
HPLC AND UV
S.No Characteristics Acceptance Criteria
1 Accuracy Recovery 98-102% with 80,
100,120% spiked sample. 2 Precision
2.a Repeatability RSD < 2%
2.b
Intermediate precision
RSD < 2%
3
Specificity/
selectivity No interference 4 Quantitation Limit S/N > 10
5 Detection Limit S/N > 2 or 3
6 Range 80-120%
7 Linearity r > 0.999
1.4.2 SYSTEM SUITABILITY PARAMETERS [U.S.P, 1995]
System suitability is that checking of a system to ensure the system performance before or during the analysis of unknown/newer drug substances i.e., these tests are used to verify that the resolution and reproducibility for the analysis to be done.
These are numerous guidelines which explain the expected limits for typical chromatography methods. In the current FDA Guidelines on “Validation of chromatography methods” the following acceptance limits are proposed as initial criteria.
1. Retention or Capacity factor (KA) 2. Separation factor (α)
3. Resolution (Rs) 4. Selectivity (a)
5. Theoretical factor or Column efficiency (N) and 6. Peak asymmetry factor (As)
1. Retention or Capacity factor (KA)
compound).The ideal value of K’ ranges from 2-10. Capacity factor can be determined by using the formula.
0 t 0 t r t K
tr = Retention time measured from time o injection to time of elution of peak maximum.
to = Void volume (Initial time)
Simply capacity factor is used to identify the location of the Sample (or) Specific peak.
2. Separation factor (α)
The separations of two peaks relative to each other is described by the selectivity (or) separation factor(α) which is determined by the ratio of the capacity factors of the two peaks. Separation factor represents the separation power o particular adsorbent to the particular Components. The ideal value of α is 2. It can be calculated by using the formula
0 t 1 tr 0 t 2 tr ' 1 K ' 2 K α
K1’ = Capacity factor of first peak
K2’ = Capacity factor of second peak
tr1 = Retention time of first peak
t0 = Initial time
3. Resolution (Rs)
The degree of separation of one component from another is described by the resolution (RS) measured as the difference in retention time of the two solutes divided by their average peak width.
For base line separation the ideal value of RS is 1.5. It is calculated by using the formula.
) 2 w 1 (w 0.5 1 tr 2 tr RS
Rt1 and Rt2 are the retention times of components 1 and 2
W1 and W2 are peak widths of components 1 and 2
These parameters may be within the ideal value means we can achieve better resolution.
4. Selectivity (a)
The selectivity (or separation factor) a, is a measure of relative retention of two components in a mixture. The ideal value of selectivity is 2. It can be calculated by using the formula, 1 V V 1 V 2 V α Where,
V2 and V1 are the retention volumes of the second and the first peaks respectively.
5. Theoretical factor or Column efficiency (N)
The efficiency of the chromatographic column is achieved by reducing the band spreading i.e., the more efficient the column, the smaller will be the width of the peak at a given retention time. It efficiency can be measured by the number of theoretical plates/meter (N) or plate height (H).Increase in the theoretical plates will show better column efficiency and system performance and it shows the less band spreading of a peak.
2 W
2 Rt 16
N
Where,
Rt is the retention time and W is the peak width.
6. Peak asymmetry factor (As)
It can be used as a criterion of column performance. The peak half width ‘b’ of a peak at 10 % of the peak height divided by the corresponding front half width ‘a’ gives the asymmetry factor.
a b
2. DRUG PROFILE
[www.Drugbank.com]Structure
Cladribine
Chemical name : 2-Chloro-2'-deoxyadenosine
Chemical formula : C10H12ClN5O3 Molecular weight : 285.687 g/mol
Category : hairy cell leukemia, B-cell chronic lymphocytic leukemia,
B-cell chronic lymphocytic leukemia and relapsing remitting multiple sclerosis
Description : White to off-white powder.
Solubility : Freely soluble in water and in glacial acetic acid.
Indication
For the treatment of active hairy cell leukemia (leukemic reticuloendotheliosis) as
defined by clinically significant anemia, neutropenia, thrombocytopenia, or disease-related
symptoms. It’s also used as an alternative agent for the treatment of chronic lymphocytic
leukemia (CLL), low-grade non-Hodgkin's lymphoma, and cutaneous T-cell lymphoma.
Mechanism of action
Cladribine is structurally related to fludarabine and pentostatin but has a different
mechanism of action. Although the exact mechanism of action has not been fully
determined, evidence shows that cladribine is phosphorylated by deoxycytidine kinase to
the nucleotidecladribine triphosphate (CdATP; 2-chloro-2′-deoxyadenosine
5′-triphosphate), which accumulates and is incorporated into DNA in cells such as
lymphocytes that contain high levels of deoxycytidine kinase and low levels of
deoxynucleotidase, resulting in DNA strand breakage and inhibition of DNA synthesis and
repair. High levels of CdATP also appear to inhibit ribonucleotidereductase, which leads to
an imbalance in tri-phosphorylateddeoxynucleotide (dNTP) pools and subsequent DNA
strand breaks, inhibition of DNA synthesis and repair, nicotinamide adenine dinucleotide
(NAD) and ATP depletion, and cell death. Unlike other antimetabolite drugs, cladribine
has cytotoxic effects on resting as well as proliferating lymphocytes. However, it does
cause cells to accumulate at the G1/S phase junction, suggesting that cytotoxicity is
associated with events critical to cell entry into S phase. It also binds purine nucleoside
phosphorylase (PNP), however no relationship between this binding and a mechanism of
Pharmacokinetics
Cladribine is absorbed rapidly and oral bioavailability is 34 to 48%. 4.5 ±2.8 L/kg
volumes should be distributed. Patients with hematologic malignancies 9L/kg volumes
should be distributed. Cladribine is metabolized in all cells with deoxycytidine kinase
activity to 2- chloro-2’deoxyadenosine- 5 –triphosphate. It is excreted by urine.
Toxicity
Symptoms of overdose include irreversible neurologic toxicity (paraparesis/
Quadriparesis), acute nephrotoxicity and severe bone marrow suppression resulting in
neutropenia, anemia and thrombocytopenia.
Side effects:
constipation
diarrhea
dizziness
headache
joint pain
muscle pain
nausea
overall feeling of discomfort or illness
sleeping problems
unusual tiredness
3. LITERATURE REVIEW
Literature review was carried out to enumerate the reported analytical methods for the selected drugs individually or in combination with other drugs.
Panel James et al., 1994 High-performance liquid chromatography/mass spectrometer (HPLC/MS) was used to identify and structurally characterize the modified nucleoside cladribine (2-chloro-2′-deoxy-β-adenosine) and 13 synthesis-related byproducts in bulk drug. Confirmation of compound identity was accomplished by spectral analysis (1H and 13C NMR spectroscopy, mass spectrometry, and UV absorption spectroscopy) of
the related compounds as isolated from crude mixtures of the drug substance and by spiking experiments with authentic standards. The use of on-line mass spectrometric analysis (i.e., LC/MS) to augment UV absorption spectra permitted rapid identification of many of the compounds of interest.
Gajewska Met al., 1995A quantitative fluorescence assay for 2-chloro-2'-deoxyadenosine (cladribine, leustatin, 2-CdA) in human plasma is described. The drug was isolated from plasma by ethyl acetate extraction and derivatized by a two-step procedure in which 2'-deoxyisoguanosine (2'-diG) was first prepared by UV irradiation of 2-CdA and was then treated with chloroacetaldehyde to form the fluorescent derivative, 1,N6-etheno-2'-deoxyisoguanosine. Fluorescence intensity of the solutions was measured using an excitation wavelength of 275 nm and emission of 397 nm. The analytical measuring range of the method extends from about 1 microgram/l to at least 100 micrograms/l.
consisted of a Shimadzu LC-9A pump, a 3 μm, 250 x 2.0 mm I.D. high speed C18 column
(Jupiter®), preceded by a 5 μm 4 x 4 mm I.D. C18 guard column (Licrocart), an Agilent
Model 1050 UV-VIS detector and a 3395 Integrator. The mobile phase was made up of 0.01M KH2PO4 (pH 5): methanol: acetonitrile (90:5:5). The system was operated at
ambient temperature with a flow rate of 0.3 mL/min, and UV wavelength at 265 nm, and an operating pressure of 1.56 kpsi. Extraction of cladribine and AZT from plasma was achieved by solid phase extraction using 100 mg/mL C18 SPE columns (Extra-sep). The
assay was validated for sensitivity, precision, specificity and application for pharmacokinetic study in rats. Under these conditions, the average retention times of CdA and AZT were 13.5 and 21 min, respectively and recoveries were between 80 – 95%. Standard curve constructed from plasma standards was linear from 0.1 ug/mL to 1 ug/mL with regression coefficient (r2) 0.99 or greater. Sensitivity assessed by on column injection
was < 1 ng. Using a 50-uL plasma sample size, the mean intra-assay variations at 0.1ug/mL were 7%, and inter-assay variations over aperiod of 3 months for 5 separate batches were less than 20 %. The assay was used to study a singledose pharmacokinetic study of CdA in rats after a 2mg/kg subcutaneous injection. The described HPLC assay has adequate sensitivity and specificity to study pharmacokinetics of CdA in rats, and could be adapted also to clinical pharmacokinetic studies.
4. AIM AND PLAN OF WORK
Cladribineis an anti-neoplastic agent used in the treatment of lympho proliferative diseases including hairy-cell leukemia. According to literature survey, very few analytical methods were reported especially in human plasma by spectrofluroimetry and Characterization of Cladribine and its related compounds was determined by HPLC/MS. Only one HPLC method was reported.
The mobile phase consisted of methanol: acetonitrile: water in the ratio of 64:22:14%v/v/v used for the existing method. Review of literature show that no HPLC methods have been reported for the drug with the selected mobile phase. Hence in this proposed project, an attempt shall be made to develop, optimize, reduce retention time and validate a HPLC method for the determination of cladribine bulk and in tablet dosage form as per ICH guidelines.
PLAN OF WORK
1. Identification, selection and collection of Cladribine for analysis.
2. Development of simple and accurate RP-HPLC method using UV detection for the estimation of cladribinein bulk and in tablet dosage form.
3. Statistical analysis of the developed analytical method.
5. MATERIALS AND METHOD
MATERIALS USED
a. Drug samples and formulations
Cladribinepure samples and tablet formulation containing 10mg of were generously gifted by Apotex Research Private limited, Bangalore.
b. Chemicals and Solvents used
S.No Chemicals used GRADE MAKE
1 Distilled Water HPLC
grade
Millipore
2 Acetonitrile
HPLC
grade Merck
3 Potassium di hydrogen phosphate
AR grade Merck
c. Instruments
Instruments employed for the study were
1. Waters 2695 series HPLC with Empower 2 software with UV Detector 2. Electronic balance (AFCOSET ER-200A)
3. pH meter (ADWA AD 1020)
5.2 METHOD
The analysis of Cladribinewas done by the following method RP-HPLC
RP-HPLC DEVELPOMENT AND OPTIMIZATION OF CHROMATOGRAPHIC
PARAMETERS
Method Development
In RP-HPLC, the retention of a compound is determined by its polarity, Pka, molecular weight, experimental conditions, mobile phase, column and temperature. The column (typically octyl (C8) and octadecyl (C18 ) bonded phase) is less polar than the water
- organic phase, usually an almost or entirely mobile phase. Sample molecules partition between the polar mobile phase and non-polar C8 and C18 stationary phase and more
Selection of chromatographic method
Proper selection of the method depends upon the nature of sample,polarity, molecular weight, Pka value and solubility. The drug Cladribine for the present study waspolar. Hence Reverse phase chromatographic technique was selected by using C18
column as a stationary phase and phosphate buffer (pH3.5): acetonitrile (70:30%v/v) as mobile phase.
Detection of wavelength
For many samples, good analytical results will be obtained only by careful selection of the wavelength used for detection. The sensitivity of HPLC depends upon proper selection of wavelength of detection. In order to determine the proper wavelength of the cladribinein mobile phase, spectra were scanned on UV-Visible spectrometer in the range of 200-400 and recorded the spectrum.It was found that cladribinehave marked absorbance at 235 nm and can be effectively used for the estimation of cladribine without interference. Therefore 235nm was selected as detection wavelength for the analysis of cladribine by RP-HPLC method with an isocratic elution technique.
Preparation of Phosphate buffer
Preparation of mobile phase
300 ml (30%) of phosphate buffer and 700 ml of Acetonitrile HPLC (70%) were mixed and degased in ultrasonic water bath for 5 minutes. Then the solution was filtered through 0.45 µ filter under vacuum filtration.
Initial Separation Condition
Mode of operation : Isocratic Instrument : HPLC Waters
Detector : UV detector
Column : Symmetry C18 (4.6 x 150mm, 5 m, Make: XTerra) Temperature : Ambient
Flow rate : 1.0 ml/min Wave length : 235 nm
Runtime : 5 min
Sample size : 20 l
Diluent : Water: Methanol (50:50 % v/v) Quantification Method: External standard Calibration Method
Effect of composition of mobile phase
Effect of pH of mobile phase
The different pH solutions were tried i.e. 2.5, 3.0, 3.5 and the chromatograms were recorded. When comparing the chromatogram obtained for the different pH solutions, at pH 3.5, the peak was very sharp than the other pH solutions. So the pH 3.5 was selected.
Optimized Chromatographic conditions
The following parameters were used for RP-HPLC analysis of Cladribine Mode of operation : Isocratic
Instrument : HPLC Waters Detector : UV detector
Column : Symmetry C18 (4.6 x 150mm, 5 m, Make: XTerra Temperature : Ambient
Flow rate : 1.0 ml/min Wave length : 235 nm
Runtime : 5 min
Sample size : 20 l
Mobile Phase : Phosphate buffer: Acetonitrile (30:70 %v/v)
Estimation of Cladribine in bulk and in tablet formulation
Standard Solution Preparation
10 mg of Cladribine working standard wasaccurately weighed and transferred into a 10 ml volumetric flask. 7 ml of mobile phase was added and sonicate to dissolve it completely. Then made volume up to the mark with the same solvent (1000 μg/ml). 0.3 ml(1 mg/ml) of the above stock solution was pipetted out and transferred into a 10 ml volumetric flask and dilute up to the mark with mobile phase (30μg/ml). Then the solution was mixed well and filtered through 0.45 µm filter.
Sample Solution Preparation
Ten tablets (Mavenclad 10mg) were weighed. The average weight was found and crushed to fine powder. The tablet powder equivalent to 10 mg was accurately weighed and transferred into a 10 ml volumetric flask. About 7 ml of mobile phase was added and sonicate to dissolve it completely. Then the solution was made volume up to the volume with the mobile phase (1000 µg/ml). It was filtered through 0.45 µm filter. Further 0.3 ml of the above stock solution was pipetted out, transferred into a 10 ml volumetric flask and dilute up to the mark with mobile phase (30 µg/ml).
Method Validation
System Suitability
System suitability tests are an integral part of any chromatographic analysis method which is used to verify reproducibility of the chromatographic system. To ascertain its effectiveness, certain system suitability test parameters were checked by repetitively injecting the drug solution at the concentrations 30µg/ml to check the reproducibility of the system. 20 µL standard solutions were injected and chromatograms were recorded.
Linearity (Calibration graph)
From the stock standard (1000 µg/ml), the aliquots (0.1 to 0.5 ml of 1000 µg/ml) solution taken 0.1, 0.2, 0.3, 0.4, 0.5 ml were taken in a separate 10 ml volumetric flasks and made up to 10 ml with mobile phase. This solution can inject into the chromatographic system and record the Chromatogram. Cladribine showed linearity in the range of (10–50 μg/ml). The calibration graph was plotted with peak area in the Y axis and concentration of standard solution in the X axis. The degree of linearity was estimated by calculating the correlation coefficient.
Limit of Detection and Limit of Quantification:
LOD and LOQ values can be calculated with the help of linearity studies. The linearity study was performed three times and calibration graph was plotted. Calculate the value of slope, intercept from the calibration graph. LOD and LOQ can be calculated by using the following formula.
Content estimation (Assay):
Ten tablets (Mavenclad 10mg) were weighed. The average weight was found and crushed to fine powder. The tablet powder equivalent to 10 mg was accurately weighed and transferred into a 10 ml volumetric flask. About 7 ml of mobile phase was added and sonicate to dissolve it completely. Then the solution was made volume up to the volume with the mobile phase (1000 µg/ml). It was filtered through 0.45 µm filter. Further 0.3 ml of the above stock solution was pipetted out, transferred into a 10 ml volumetric flask and dilute up to the mark with mobile phase (30µg/ml). 20 µl of blank, standard and sample solution were injected and the chromatograms were recorded. The % purity of the sample (tablet)was calculated by the following formula
100 X Claim Label Avg.Wt x 100 P x WT DT x DS WS x AS AT % Assay
AT = Peak Area of cladribineobtained with test preparation
AS = Peak Area of cladribineobtained with standard preparation
WS = Weight of working standard taken in mg
WT = Weight of sample taken in mg
DS = Dilution of Standard solution
DT = Dilution of sample solution
Precision
The precision of an analytical procedure expresses the closeness of agreement(degree of scatter) between a series of measurements obtained from multiplesamples of the same homogeneous sample under prescribed conditions. Precision is usually investigated at three levels: repeatability, intermediate precision,and reproducibility.
Accuracy
A study of accuracy was conducted. Drug assay was performed in triplicate by spiking with equivalent amount of cladribine raw material into each volumetric flask for each spike level to get the concentration of cladribine equivalent to 50%, 100%, and 150% of the labelled amount ofcladribine as per the test method. The average percentage recovery of cladribine was calculated.
Robustness
The robustness of the analytical method is a measure of its capacity to remain uneffectedby small but deliberate variation in method parameters and provides an indication of its reliability during normal usage.
For demonstarting the robustness of the method,the optimized flow rate and composition of mobile phase condition was slightly changed these were 0.8 mLmin-1 and
1.2mLmin-1 , organic composition of mobile phase were (40:60 %v/v) and (20:80%v/v).20
6. RESULTS AND DISCUSSION
RP-HPLC method was developed for the determination Cladribine bulk and in tablet dosage form. To optimize the proposed HPLC method, all of the experimental conditions were investigated. For the choice of the stationary phase, reverse phase seperation was preferred due to the drawbacks of the normal phase, for the seperation of mobile phase different systems were tried for effective chromatographic seperation.
10 μg/ml of cladribine in mobile phase (Phosphate buffer pH 3.5: Acetonitrile 30:70%v/v) solution was prepared and it was scanned in the UV region. At 235 nm the drug showed maximum absorbance. Hence this was selected as a detection wavelength. The UV spectrum was shown in figure 2a. Quantification was done by Standard addition method.
FIGURE – 2a
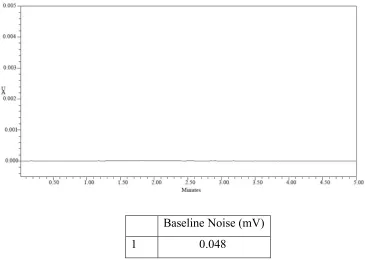
FIGURE -3 CHROMATOGRAM OF BLANK BY HPLC METHOD (PHOSPHATE BUFFER pH 3.5: ACETONITRILE (30:70 %v/v)
FIGURE 4 CHROMATOGRAM OF CLADRIBINE IN WATER: METHANOL (50: 50 %V/V) BY HPLC METHOD
Peak name RT Area Height USP plate count USP Tailing 1 Cladribine 3.916 1760477 63310 480.7 1.3
[image:62.612.105.497.397.616.2]FIGURE 5
CHROMATOGRAM OF CLADRIBINEIN WATER: ACETONITRILE (40: 60 %V/V) BY HPLC METHOD
Peak name RT Area Height USP plate count USP Tailing 1 Cladribine 3.919 1650713 59758 509.6 1.2
FIGURE – 6
CHROMATOGRAM OF CLADRIBINE IN PHOSPHATE BUFFER pH3: METHANOL (50: 50%V/V) BY HPLC METHOD
FIGURE – 7
CHROMATOGRAM OF CLADRIBINE IN PHOSPHATE BUFFER pH3.5: METHANOL (40: 60%V/V) BY HPLC METHOD
Peak name RT Area Height USP plate count USP Tailing
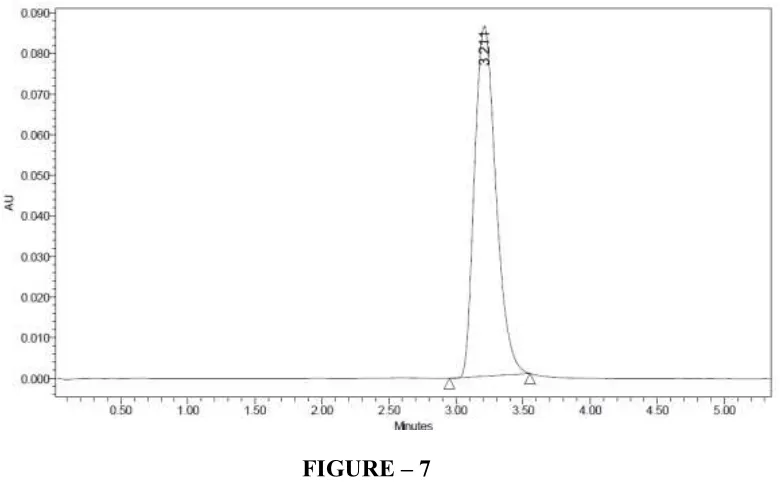
FIGURE – 8
CHROMATOGRAM OF CLADRIBINE IN PHOSPHATE BUFFER pH3.5: ACETONITRILE (40: 60%V/V) BY HPLC METHOD
Peak name RT Area Height USP plate count USP Tailing
1 Cladribine 3.849 1075343 82659 2050.8 1.4
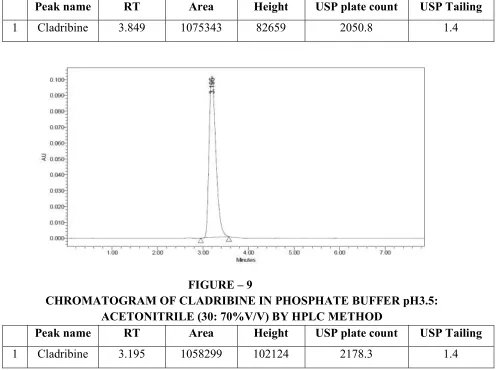
FIGURE – 9
CHROMATOGRAM OF CLADRIBINE IN PHOSPHATE BUFFER pH3.5: ACETONITRILE (30: 70%V/V) BY HPLC METHOD
Peak name RT Area Height USP plate count USP Tailing
[image:65.612.64.561.344.714.2]FIGURE – 10
OPTIMIZED CHROMATOGRAM OF CLADRIBINE BY HPLC METHOD
Peak name RT Area Height USP plate count USP Tailing
1 Cladribine 3.195 1058299 102124 2178.3 1.4
TABLE -3
SYSTEM SUITABILITY OF CLADRIBINE BY HPLC METHOD
Parameter Cladribine
Tailing factor 1.6 No of Theoretical plate 2951 Retention time 3.2
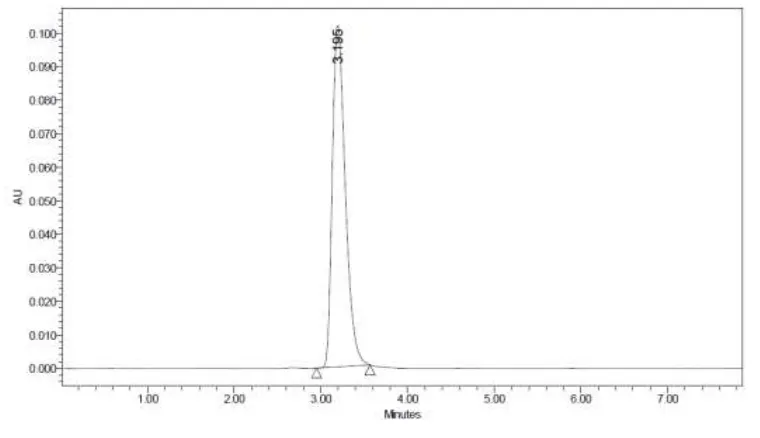
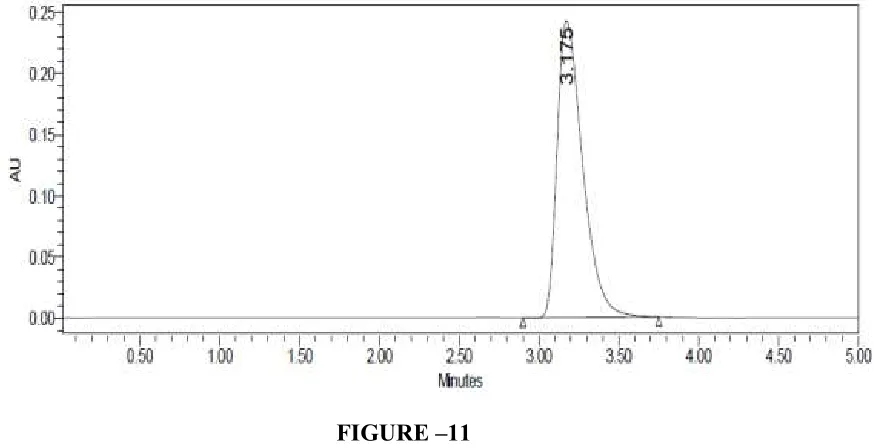
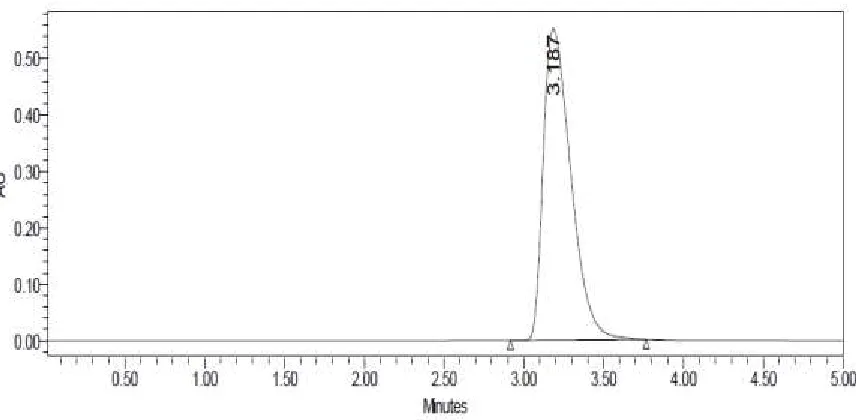
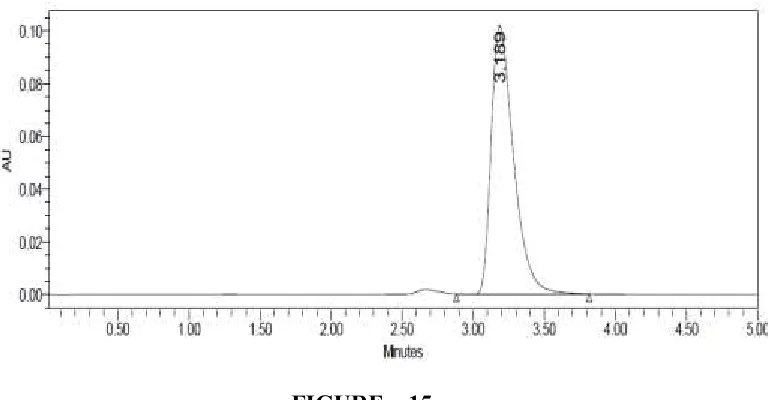
With the optimized chromatographic conditions, stock solutions of cladribine was prepared by using mobile phase ( phosphate buffer pH 3.5 and Acetonitrile in the ratio (30:70 %v/v) and various concentrations were prepared in the range of 10-50 µg/ml and injected individually. The chromatograms were recorded at 235 nm. The chromatograms were shown in the figures 11 - 15. The report of linearity studies were shown in table 4. The calibration curve was plotted by using concentration against peak area. The correlation coefficient was found to be 0.999. This indicated that the concentration of cladribinehad good linearity. The calibration curve was shown in figure 16.
TABLE -4
LINEARITY OF CLADRIBINE BY HPLC METHOD
S.No Concentration of
Cladribine Peak Area LOD LOQ
1 10 1323634
0.014 0.0465
2 20 2712792
3 30 3998490
4 40 5328851
FIGURE –11
LINEARITY CHROMATOGRAM OF CLADRIBINE 10µG/ML BY HPLC METHOD
FIGURE – 12
[image:68.612.108.551.405.642.2]FIGURE – 13
LINEARITY CHROMATOGRAM OF CLADRIBINE 30µG/ML BY HPLC METHOD
FIGURE – 14
[image:69.612.102.530.404.614.2]FIGURE – 15
LINEARITY CHROMATOGRAM OF CLADRIBINE 50µG/ML BY HPLC METHOD
Sample name Peak name RT Area Height
[image:70.612.125.509.77.277.2]1 Linearity 10ppm Cladribine 3.189 1113634 102352 2 Linearity 20ppm Cladribine 3.175 2712792 244484 3 Linearity 30ppm Cladribine 3.187 3908404 342239 4 Linearity 40ppm Cladribine 3.180 5328851 484112 5 Linearity 50ppm Cladribine 3.187 6652686 555333
FIGURE – 16
CALIBRATION CURVE OF CLADRIBINE BY HPLC METHOD
0 1323634 2712792 3998490 5328851 6652686
y = 133042x + 10020 R² = 0.9999
0 1000000 2000000 3000000 4000000 5000000 6000000 7000000
0 10 20 30 40 50 60
pe
ak
a
re
a
The limit of detection and the limit of quantification were determined based on the signal to noise ratio. The limit of detection was found to be 0.014 µg/ml and the limit of quantification was found to be 0.0465 µg/ml. The chromatogram for LOD and LOQ were shown in the figure 17 and 18 respectively. The value obtained in the LOD and LOQ was shown in the table 4.
FIGURE – 17
LOD CHROMATOGRAM OF CLADRIBINE BY HPLC METHOD
Name Retention Time Area (µV*sec) Height (µV)
FIGURE – 18
LOQ CHROMATOGRAM OF CLADRIBINE BY HPLC METHOD
Assay was performed to determine the purity of the drug. 30 µg/ml solutions were prepared by using pure drug and sample. 20 μl of each solution were injected individually. The chromatogram was recorded at 235 nm. The percentage purity of the cladribine was found to be 100.7%. The chromatograms were shown in figures 19-22.
FIGURE – 19
ASSAY CHROMATOGRAM OF CLADRIBINE SAMPLE ( I ) BY HPLC METHOD
Name Retention Time Area (µV*sec) Height (µV)
FIGURE – 20
ASSAY CHROMATOGRAM OF CLADRIBINE SAMPLE ( II ) BY HPLC METHOD
FIGURE – 21
ASSAY CHROMATOGRAM OF CLADRIBINE STANDARD ( I ) BY HPLC METHOD
Peak Name RT Injection Area
1 Cladribine 3.181 1 3912105 2 Cladribine 3.181 2 3907203
Mean 3909654
SD 3466.4
FIGURE – 22
ASSAY CHROMATOGRAM OF CLADRIBINE STANDARD ( II ) BY HPLC METHOD
Accuracy was confirmed by recovery studies by adding known amount of pure drug to the previously analysed formulation and the mixture was analysed by proposed method and chromatograms were shown in the figures 23-31. The percentage recovery of cladribine present in formulation was found to be 101.28%. The proposed method was validated and the results were shown in the table 5. The result shows that the excipients and additives did not interfering the developed method. Hence the accuracy of the method was confirmed.
Name Retention Time Area USP Plate Count USP Tailing
TABLE -5
RECOVERY STUDY CLADRIBINEOF BY HPLC METHOD
%Concentration (at specification
Level)
Area
Amount Added
(mg)
Amount Found
(mg)
% Recovery Mean Recovery
50% 2110613 5.5 5.57 101.3%
101.3% 100% 3885698 10.1 10.2 101.5%
150% 5778169 15.1 15.2 101.0%
FIGURE –23
FIGURE –24
RECOVERY CHROMATOGRAM OF CLADRIBINE 50% BY HPLC METHOD (II)
FIGURE –25
RECOVERY CHROMATOGRAM OF CLADRIBINE 50% BY HPLC METHOD (III)
Peak
name RT Injection Area
1 Cladribine 3.184 1 2108215 2 Cladribine 3.235 2 2109521 3 Cladribine 3.184 3 2114103
Mean 2110613
SD 3092.0
FIGURE – 26
RECOVERY CHROMATOGRAM OF CLADRIBINE 100%BY HPLC METHOD (I)
FIGURE – 27
FIGURE – 28
RECOVERY CHROMATOGRAM OF CLADRIBINE 100%BY HPLC METHOD (III)
FIGURE – 29
RECOVERY CHROMATOGRAM OF CLADRIBINE 150%BY HPLC METHOD (I)
Peak name
RT Injection Area
1 Cladribine 3.191 1 3875174 2 Cladribine 3.217 2 3888449 3 Cladribine 3.191 3 3893469
Mean 3885698
SD 9452.9
FIGURE – 30
[image:79.612.101.529.328.533.2]RECOVERY CHROMATOGRAM OF CLADRIBINE 150%BY HPLC METHOD (II)
FIGURE – 31
RECOVERY CHROMATOGRAM OF CLADRIBINE 150%BY HPLC METHOD (III)
Peak name
RT Injection Area
1 Cladribine 3.189 1 5781825 2 Cladribine 3.238 2 5779001 3 Cladribine 3.189 3 5773680
Mean 5778169
SD 4135.7
Precision study was done with 30 µg/ml solution of cladribinestandard was prepared from the stock solution. 20 μl of each standard was injected and the chromatograms were recorded. This procedure was repeated for five times. The % RSD was found to be 1.44. The % RSD for the area of five replicate injections was found to be within the specified limit. This indicated that the developed method had good precision with repeatability.The results were shown in table 6 and the chromatograms were shown in
[image:80.612.77.541.281.551.2]figure 32-36.
TABLE -6
PRECISION OFCLADRIBINE BY HPLC METHOD
S.No Concentration of Cladribine Absorbance Peak Average SD %RSD
1 10 3855508
3870622 10815.8 0.28 2 20 3865126
3 30 3871273
4 40 3878408
FIGURE – 32
[image:81.612.106.534.76.265.2]PRECISION CHROMATOGRAM OF CLADRIBINE (30 μg/ml) BY HPLC METHOD (1)
FIGURE – 33
FIGURE – 34
PRECISION CHROMATOGRAM OF CLADRIBINE (30 μg/ml) BY HPLC METHOD (3)
FIGURE – 35
[image:82.612.104.534.385.567.2]FIGURE – 36
PRECISION CHROMATOGRAM OF CLADRIBINE (30 μg/ml) BY HPLC METHOD (5)
Intermediate precision study was done with 30 µg/ml solution of cladribine standard was prepared from the stock solution. The % RSD was found to be 0.28. The % RSD for the area of five replicate injections was found to be within the specified limit. It showed the intermediate precision was within the specified limit. The report of analysis was shown in
table 7 and the chromatograms were shown in the figure37-41.
Peak name
RT Injection Area
1 Cladribine 3.189 1 3855508 2 Cladribine 3.198 2 3865126 3 Cladribine 3.178 3 3871273 4 Cladribine 3.212 4 3878407 5 Cladribine 3.189 5 3882797
Mean 3870622
SD 10815.8
[image:83.612.97.515.362.511.2]TABLE -7
INTERMEDIATE PRECISION OFCLADRIBINE BY HPLC METHOD S.No Concentration of
Cladribine
Peak
Absorbance Average SD %RSD
1 10 4095410
3992318 61140.1 1.53 2 20 3935121
3 30 3963812 4 40 3990300 5 50 3976949
FIGURE – 37
[image:84.612.128.491.505.662.2]INTERMEDIATE PRECISION CHROMATOGRAM OF CLADRIBINE (30 μg/ml) BY HPLC METHOD (1)
FIGURE – 38
FIGURE – 39
INTERMEDIATE PRECISION CHROMATOGRAM OF CLADRIBINE (30 μg/ml) BY HPLC METHOD (3)
FIGURE – 40
FIGURE – 41
INTERMEDIATE PRECISION CHROMATOGRAM OF CLADRIBINE (30 μg/ml) BY HPLC METHOD (5)
Robustness was performed by changing the flow rate and by changing the organic composition of the mobile phase. The chromatograms for robustness were shown in the
figure 42- 45. The results were shown in the table 8. It showed that there was no change in the values even after making deliberate change in the analytical procedure.
All the above parameters combined with the simplicity and ease of operation ensures that the application of proposed method in the assay of drug in pharmaceutical dosage form. Hence the RP-HPLC method may be applied for the estimation of cladribinein bulk and in tablet dosage form.
Peak name RT Injection Area
1 Cladribine 3.213 1 4095410 2 Cladribine 3.217 2 3935121 3 Cladribine 3.183 3 3963812 4 Cladribine 3.261 4 3990300 5 Cladribine 3.261 5 3976949
Mean 3992318
SD 61140.1
TABLE -8
ROBUSTNESS OF CLADRIBINE BY HPLC METHOD Parameters Theoretical Plate Tailing Factor
Less flow (0.5 ml/min) 2889 1.6 More flow (0.7 ml/min) 2961 1.5 Less organic phase (60 %) 2874 1.6 More organic phase (80%) 2856 1.5
FIGURE – 42
ROBUSTNESS CHROMATOGRAM OF CLADRIBINE (LESS FLOW) BY HPLC METHOD
Name Retention Time Area (µV*sec) USP plate count USP Tailing
FIGURE – 43
ROBUSTNESS CHROMATOGRAM OF CLADRIBINE (MORE FLOW) BY HPLC METHOD
FIGURE – 44
ROBUSTNESS CHROMATOGRAM OFCLADRIBINE (LESS ORGANIC) BY HPLC METHOD
Name Retention Time Area (µV*sec) USP plate count
USP Tailing
1 Cladribine 2.728 32316666 2961.0 1.5
Name Retention Time Area (µV*sec) USP plate count USP Tailing
FIGURE –45
ROBUSTNESS CHROMATOGRAM OF CLADRIBINE (MORE ORGANIC) BY HPLC METHOD
Name Retention Time Area (µV*sec) USP Plate count USP Tailing
![Table No: 1 Types of instrumental methods [Gurdeep R Chatwalet al., 2006]](https://thumb-us.123doks.com/thumbv2/123dok_us/174440.48455/13.612.86.528.80.707/table-types-instrumental-methods-gurdeep-r-chatwalet-al.webp)