VALIDATION FOR THE ESTIMATION OF EZETIMIBE IN
HUMAN PLASMA BY LC/MS/MS”
A Dissertation submitted to
THE TAMIL NADU DR. M.G.R. MEDICAL UNIVERSITY,
CHENNAI - 600 032
In partial fulfilment of the award of the degree of
MASTER OF PHARMACY
IN
Branch - V - PHARMACEUTICAL ANALYSIS
Submitted by
RAJESH R
REG.No.261630204
Under the Guidance of
Mr. D. KAMALA KANNAN M.Pharm.,
Assistant Professor,
Department of Pharmaceutical Analysis
J.K.K. NATTARAJA COLLEGE OF PHARMACY
KOMARAPALAYAM – 638183.
This is to certify that the dissertation work entitled
“BIOANALYTICAL METHOD DEVELOPMENT AND VALIDATION
FOR THE ESTIMATION OF EZETIMIBE IN HUMAN PLASMA BY
LC/MS/MS” submitted by the student bearing REG.No.261630204
to “The Tamil Nadu Dr. M.G.R. Medical University – Chennai”, in
partial fulfilment for the award of Degree of Master of Pharmacy in
Pharmaceutical Analysis was evaluated by us during the
examination held on………..……….
This is to certify that the work embodied in this dissertation Entitled
“BIOANALYTICAL
METHOD
DEVELOPMENT
AND
VALIDATION FOR THE ESTIMATION OF EZETIMIBE IN
HUMAN PLASMA BY LC/MS/MS”
submitted to “The Tamil Nadu Dr. M.G.R. Medical University-Chennai”, in partial fulfilment and requirement of university rules and regulation for the award of Degree of Master of Pharmacy in Pharmaceutical Analysis, is abonafide work carried out by the student bearing
REG.No.261630204 during the academic year 2017-2018, under the guidance and supervision of Mr. D. KAMALA KANNAN, M.Pharm., Assistant Professor, Department of Pharmaceutical Analysis, J.K.K. Nattraja College of Pharmacy, Komarapalayam.
Mr. D. KAMALA KANNAN M.Pharm., Assistant Professor,
Department of Pharmaceutical Analysis J.K.K. Nattraja College of Pharmacy Komarapalayam – 638 183.
Dr. R. SAMBATHKUMAR M.Pharm., Ph.D., Professor & Principal,
J.K.K. Nattraja College of Pharmacy
Dr. V. SEKAR M.Pharm., Ph.D.,
Professor & Head,
I do hereby declared that the dissertation “BIOANALYTICAL
METHOD DEVELOPMENT AND VALIDATION FOR THE
ESTIMATION OF EZETIMIBE IN HUMAN PLASMA BY LC/MS/MS”
submitted to “The Tamil Nadu Dr. M.G.R Medical University -
Chennai”, for the partial fulfilment of the degree of Master of
Pharmacy in Pharmaceutical Analysis, is a bonafide research work
has been carried out by me during the academic year 2017-2018,
under the guidance and supervision of Mr. D. KAMALA KANNAN,
M.Pharm., Assistant Professor, Department of Pharmaceutical
Analysis, J.K.K. Nattraja College of Pharmacy, Komarapalayam.
I further declare that this work is original and this dissertation
has not been submitted previously for the award of any other degree,
diploma, associateship and fellowship or any other similar title. The
information furnished in this dissertation is genuine to the best of
my knowledge.
Place: Komarapalayam RAJESH R
Date: REG.No.261630204
Dedicated to
Parents,
Teachers&
ACKNOWLEDGEMENT
I am proud to dedicate my deep sense of gratitude to the
founder, (Late) Thiru. J.K.K. Nattaraja Chettiar, providing the
historical institution to study.
My sincere thanks and respectful regards to our reverent
Chairperson Smt. N. Sendamaraai, B.Com., and Director
Mr. S. Omm Sharravana, B.Com., LLB., J.K.K. Nattraja Educational
Institutions, Kumarapalayam for their blessings, encouragement and
support at all times.
It is my most pleasant duty to thank our beloved Principal and
Professor Dr. R. Sambathkumar, M. Pharm., PhD., of J.K.K.Nattraja
College of Pharmacy, Kumarapalayam for ensuring all the facilities were
made available to me for the smooth running of this project.
It is most pleasant duty to thank my beloved guide
Mr. D. Kamalakannan, M.Pharm., Assistant Professor, Department
of Pharmaceutical Analysis, J.K.K. Nattraja College of Pharmacy,
Kumarapalayam, Dr. V. Sekar, M.Pharm., Ph.D., Professor and
Head, Department of Pharmaceutical Analysis, for suggesting
solution to problems faced by me and providing in dispensable
guidance, tremendous encouragement at each and every step of this
dissertation work. Without his critical advice and deep-rooted
My sincere thanks to Dr. I. Carolin Nimila, M.Pharm., Ph.D.,
Associate Professor Ms.V.Devi M.Pharm.,Lecturer and Mrs.P.Devi,
M.Pharm., Assistant Professor, Department of Pharmaceutical
Analysis for their valuable suggestions.
I greatly acknowledge the help rendered by Mrs.K.Rani, Office
Superintendent, Mr. E. Vasanthakumar, MCA, Assistant Professor,
Mrs. V.Gandhimathi, M.A., M.L.I.S., Librarian, Mrs. S. Jayakala
B.A., B.L.I.S., and Asst. Librarian for their co-operation. I owe my
thanks to all the technical and non-technical staff members of the
institute for their precious assistance and help.
Last, but nevertheless, I am thankful to my lovable parents
and all my friends for their cooperation, encouragement and help
extended to me throughout my project work.
TABLE OF CONTENTS
CHAPTER
No. CONTENTS PAGE No.
1 INTRODUCTION 1
2 LITERATURE REVIEW 34
3 DRUG PROFILE 40
4 AIM AND PLAN OF WORK 43
5 MATERIALS AND METHODS 46
6 RESULTS AND DISCUSSIONS 63
7 CHROMATOGRAMS 99
8 SUMMARY AND CONCLUSION 108
9 BIBILOGRAPHY 109
10 GLOSSARY 112
LIST OF TABLES
S.No. CONTENTS PAGE No.
1 Preparation of Working solution of Calibration curve standards 51
2 Preparation of calibration curve standards 52
3 Preparation of working solution of quality control samples 54
4 Preparation of quality control samples 55
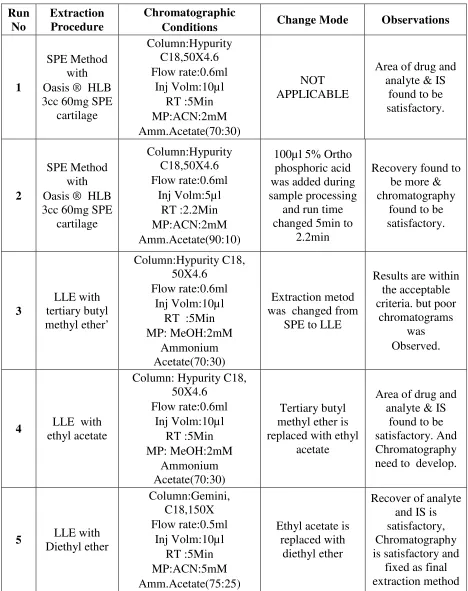
5 Method Development Trails 61
6 System Suitability Test 63
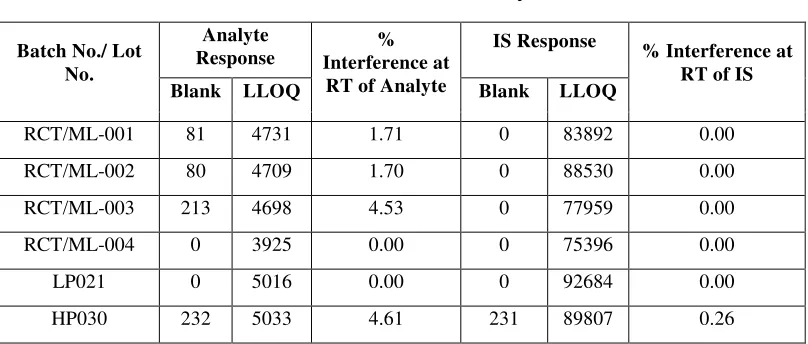
7 Selectivity 64
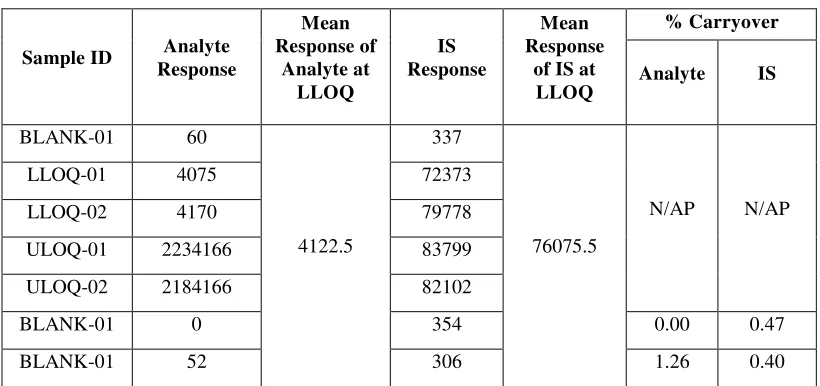
8 Carry Over 65
9 Matrix Effect 67
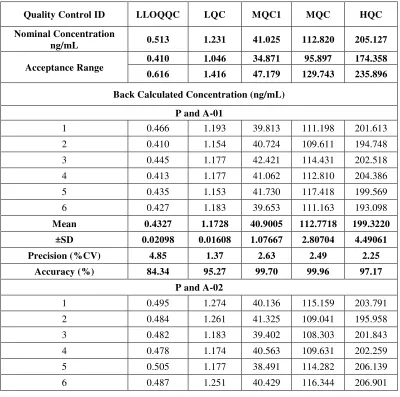
10 Within Run and Between Run Precision and Accuracy 69
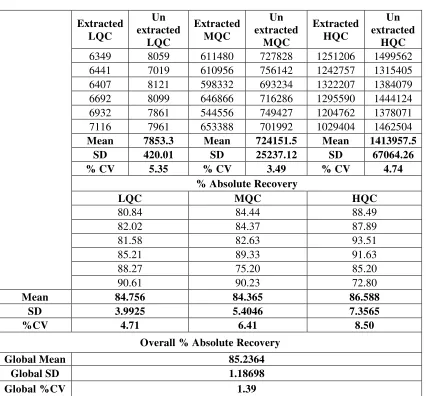
11 Recovery For Ezetimibe 72
12 Recovery For Ezetimibe D4 73
13 Dilution Integrity 74
14 Ruggedness 75
15 Reinjection Reproducibility 76
S.No. CONTENTS PAGE No.
17 Reagent Stability 78
18 Short Term Stock Solution Stability of Ezetimibe and Ezetimibe
D4 80
19 Short Term Stock Solution Stability of Ezetimibe Phenoxy
Glucuronide 81
20 Short Term Stock Dilution Stability of Ezetimibe and Ezetimibe
D4 82
21 Short Term Stock Dilution Stability of Ezetimibe Phenoxy
Glucuronide 84
22 Long Term Stock Solution Stability of Ezetimibe and Ezetimibe
D4 85
23 Long Term Stock Solution Stability of Ezetimibe Phenoxy
Glucuronide 87
24 Long Term Stock Dilution Stability of Ezetimibe and Ezetimibe
D4 88
25 Long Term Stock Dilution Stability of Ezetimibe Phenoxy
Glucuronide 89
26 Auto sampler Stability 90
27 Wet Extract Bench Top Stability 91
28 Freeze Thaw Stability 93
29 Bench Top Stability in Plasma 94
30 Dry Extract Stability 95
31 Evaporation Stability 96
LIST OF CHROMATOGRAMS
S.No.
CONTENTS
PAGE No.
01 Chromatogram of Blank 99
02 Chromatogram of Blank + IS 100
03 Chromatogram of CS-1 101
04 Chromatogram of CS-9 102
05 Chromatogram of LLOQ QC 103
06 Chromatogram of LQC 104
07 Chromatogram of M1QC 105
08 Chromatogram of MQC 106
LIST OF ABBREVIATION USED
µg Microgram
µL Micro liter
a Slope
amu Atomic mass unit
AQ Aqueous
b Intercept
CAD Collisional Activated Dissociation gas
CC Calibration curve
CE Collision energy
Conc. Concentration
CUR Curtain gas
CV Coefficient of variation CXP Cell exit potential
DF Dilution factor
DP Declustering potential
EDTA Ethylene diamine tetraacetic acid
EP Entrancing potential
FP Focusing potential
GS1 Gas source 1
GS2 Gas source 2
HLB Hydrophilic-lipophilic balance HPLC High performance liquid
chromatography HQC High quality control
hr Hour
IS Internal standard
ISP Ion source parameter
LOQ QC Limit of quantification quality control
LQC Low quality control
min Minute
mL Milliliter
MQC Medium quality control MRM Multiple reaction monitoring
MV Method validation
NAP Not applicable
ng Nanogram
M1QC Medium 1 quality control
No. Number
p Pressure
p.a.r. Peak area ratio
QC Quality control
Q1 Quadrupole 1
Q3 Quadrupole 3
RT Room temperature
r² Correlation coefficient rpm Revolutions per minute
SD Standard deviation
sec Seconds
SOP Standard operating procedure
SS System suitability
STD Standard
TEM Temperature
ULOQ Upper limit of quantitation
V Volume
INTRODUCTION
1.0 BIOANALYTICAL AND BIOEQIVALANCE STUDIES
The design, performance, and evaluation of bioavailability and bioequivalence studies have received major attention from academia, the pharmaceutical industry and health authorities over the last couple of decades. Comparison of therapeutic performance of two medicinal products containing the same active substance is critical for assessing the possibility of supplanting an innovator with any essentially similar medicinal product. In practice, demonstration of bioequivalence is generally the most appropriate method of substantiating therapeutic equivalence between medicinal products. (Rechard F. Venn 2004).
The drugs are absorbed orally and peak plasma concentration is reached at a certain time. The drug is subsequently distributed, metabolized, and excreted and the drug concentration declines over a period of time depending on the elimination half-life. The bioequivalence studies conducted to investigate the pharmacokinetic parameters of two pharmaceutical formulation of the same drug and to demonstrate the equivalence of their pharmacokinetic parameters.
Bioavailability Studies (BA) focus on determining the process by which a drug is released from the oral dosage form and moves to the site of action. BA data provide an estimate of the fraction of the drug absorbed, as well as its subsequent distribution and elimination. BA can be generally documented by a systemic exposure profile obtained by measuring drug and/or metabolite concentration in the systemic circulation over time.
1.1 NEED FOR BIO-EQUIVALENCE STUDIES
1.1.1 Applications for products containing new active substances
During the development of a new active substance (new chemical entity) intended for systemic action, bioequivalence studies are necessary as bridging studies between,
(i) Pivotal and early clinical trial formulations;
(ii) Pivotal clinical trial formulations,
Especially those used in the dose finding studies, and the to-be-marketed medicinal product. (Dieter Hauschke and Volker, 2006)
1.1.2 Applications for products containing approved active substances
In-vivo bioequivalence studies are needed when there is a risk that possible differences in bioavailability may result in therapeutic in-equivalence. The Committee for Proprietary Medicinal Products (CPMP) guidance (2001) devotes an entire section to the necessity of bioequivalence studies for various dosage forms, taking into consideration the concepts underlying the Biopharmaceutics Classification System, i.e., high solubility, high permeability for the active substance, and high dissolution rate for the medicinal product.
This section also addresses special topics such as
Dose proportionality of immediate release oral dosage forms (bioequivalence assessment for only one dose strength).
Suprabioavailability (which necessitates reformulation to a lower dosage strength, otherwise the suprabioavailable product may be considered as new medicinal product, the efficacy and safety of which have to be supported by clinical studies).
1.1.3 Applications for modified release forms essentially similar to a marketed
modified release forms
The requirements for modified release forms are stated in the CPMP Note for Guidance on Modified Release Oral and Transdermal Dosage Forms (1999), which differentiates between prolonged, delayed and transdermal release forms. Prolonged release formulations can be assessed as bioequivalent on the basis of single-dose and multiple-dose studies, which are designed to demonstrate that
The test formulation exhibits the claimed prolonged release characteristics of the reference.
The active drug substance is not released unexpectedly from the test formulation (dose dumping).
Performance of the test and reference formulation is equivalent after single dose and at steady state.
immediately after a predefined high fat meal. This study should be conducted with the same strength(s) as those of the pivotal bioequivalence studies.
In the case of prolonged release single unit formulations with multiple strengths, a single-dose study under fasting conditions is required for each strength. Studies at steady state may be conducted with the highest strength only, if certain criteria for extrapolating bioequivalence studies (linear pharmacokinetics, same qualitative composition, etc.) are fulfilled.
For multiple unit formulations of a medicinal product showing linear pharmacokinetics with multiple strengths, a single-dose study under fasting conditions on the highest strength is sufficient, provided that the compositions of the lower strengths are proportional to that of the highest strength, the formulations contain identical beads or pellets, and the dissolution profiles are acceptable.
For delayed release formulations, postprandial bioequivalence studies are necessary as food can influence the absorption of an active substance administered in an enteric-coated formulation.
2.0 FACTORS TO BE CONSIDERED
2.1 Storage Requirements for Biologic Samples
In order to avoid decomposition or other potential chemical changes in the drugs to be analyzed, biologic samples should be frozen immediately upon collection and thawed before analysis. When drugs are susceptible to plasma esterase, the addition of esterase inhibitors, such as sodium fluoride, to blood samples immediately after collection helps to prevent drug decomposition.
When collecting and storing biologic samples, the analyst should be varying of artefacts from tubing or storage vessels that can contaminate the sample. For example, plastic-ware frequently contains the high boiling liquid Bis-(2-ethylhexyl) phthalate, similarly, the plunger-plugs of vacutainers are known to contain tri-butoxyethyl phosphate, which can interfere in certain drug analyses.
In the case of faeces, lyophilization of the sample before storage is highly desirable unless prior investigations have revealed little or no reactivity of the drug components with the endogenous intestinal micro-organisms.
2.2 Preliminary Treatment of Biologic Samples
2.2.1 Protein Precipitation or Denaturation
Biologic materials such as plasma, feces, and saliva contain significant quantities of protein, which can bind a drug. The drug may have to be free from protein before further manipulation. Protein Denaturation is important, because the presence of proteins, lipids, salts, and other endogenous material in the sample can cause rapid deterioration of HPLC columns and also interfere the assay. Protein denaturation procedures include the use of tungstic acid, ammonium sulfate, heat, alcohol, trichloroacetic acid, and perchloric acid.
Methanol and acetonitrile frequently have been used as protein denaturants of biologic samples. Methanol sometimes is preferred because it produces a flocculent precipitate and not the gummy mass obtained with acetonitrile. Methanol also gives a clearer supernate and may prevent the drug entrapment that can be observed after acetonitrile precipitation.
Ultrafiltration and dialysis procedures also have been used to remove proteins from biologic fluids. These procedures are not widely used because they are slow.
2.2.2 Hydrolysis of Conjugates
procedure are less hydrophilic than their conjugates and usually can be extracted from the biologic matrix.
A nonspecific acid hydrolysis can be accomplished by heating a biologic sample for 30 min at 90 to 100°C in 2 to 5N hydrochloric acid. Upon cooling, the
pH of the sample can be adjusted to the desired level and the metabolite removed by solvent extraction. Particularly stable conjugates sometimes require hydrolysis in an autoclave.
2.2.3 Homogenization
For samples containing insoluble protein, such as muscle or other related tissues, a homogenization or solubilizing step using 1N hydrochloric acid may be required before treating the sample further. For gelatinous samples such as seminal fluid or sputum, liquefaction is achieved via sonication. A solid sample such as feces can be homogenized with a minimum amount of methanol. Homogenization is usually performed with a blade homogenizer (e.g., Waring Blender).
3.0 EXTRACTION PROCEDURES FOR DRUGS AND METABOLITES
FROM BIOLOGIC SAMPLES
3.1 Liquid-Solid Extraction
Liquid - solid extractions occur between a solid phase and a liquid phase, either phase may initially contain the drug substance. Among the solids that have been used successfully in the extraction (usually via adsorption) of drugs from liquid samples are XAD-2 resin, charcoal, alumina, silica gel, and aluminum silicate.
Sometimes the drugs are contained in a solid phase, such as in lyophilized specimens. Liquid-solid extraction is often particularly suitable for polar compounds that would otherwise tend to remain in the aqueous phase. The method could also be useful for amphoteric compounds that cannot be extracted easily from water.
3.2 Dehydration Methods
An aqueous biologic sample is treated with a sufficient quantity of anhydrous salt (sodium or magnesium sulfate) to create a "dried" mix. This mix is then extracted with a suitable organic solvent to remove the desired drug or metabolite.
3.3 Liquid-Liquid Extraction
Liquid-liquid extraction is probably the most widely used technique because
The analyst can remove a drug or metabolite from larger concentrations of endogenous materials that might interfere with the final analytic determination.
The technique is simple, rapid, and has a relatively small cost factor per sample.
The extract containing the drug can be evaporated to dryness, and the residue can be redissolved in a smaller volume of a more appropriate solvent. In this manner, the sample becomes more compatible with a particular analytic methodology in the measurement step, such as a mobile phase in HPLC determinations.
The extracted material can be redissolved in small volumes (e.g., 100 to 500 µl
of solvent), thereby extending the sensitivity limits of an assay.
It is possible to extract more than one sample concurrently.
Partitioning or distribution of a drug between two possible liquid phases can be expressed in terms of a partition or distribution coefficient, usually called P. A partition coefficient is constant only for a particular solute, temperature, and pair of solvents used. By knowing the P value for the extracted drug and the absolute volumes of the two phases to be utilized, the quantity of drug extracted after a single extraction can be obtained. In multiple extractions methodology, the original biologic sample is extracted several times with fresh volumes of organic solvent until as much drug as possible is obtained. Because the combined extracts now contain the total extracted drug, it is desirable to calculate the number of extractions necessary to achieve maximum extraction.
3.3.1 Factors Affecting the Partition Coefficient
It is generally accepted that diethyl ether and chloroform are the solvents of choice for acidic and basic drugs, respectively, especially when the identity of the drugs in the samples is unknown. In these cases, any chemically neutral drugs are extracted into either solvent depending on their relative partition tendencies. Proper pH adjustment of a biologic sample permits quantitative conversion of an ionized drug to an un-ionized species, which is more soluble in a nonpolar solvent and therefore, extractable from an aqueous environment. In analyses that must determine a known drug or metabolite, the proper pH for extraction can be calculated from the Henderson-Hasselbalch equation using the pKa of the compound. If the species to be analyzed is unknown, the pH must be approximated based on the chemical nature of the suspected agent.
Third Factor influencing extractability of drugs from biologic samples is ionic strength. Addition of highly water-soluble ionized salts, such as sodium chloride, to an aqueous phase creates a high degree of interaction between the water molecules and the inorganic ions in solution. Fewer water molecules are free to interact with a unionized drug.
solvents are used at basic pH whereas certain organic solvents such as n-hexane and diethyl ether are less emulsion-prone.
Certain types of amphoteric drugs or drugs that possess extreme water solubility are not amenable to classic solvent extraction. In these cases, other types of analytic methodology such as ion-pairing must be adopted. The technique of back-extraction can be applied with success to the analysis of drugs in biologic samples. The purpose of the methodology is to further purify an extract by removing either drug or impurities by additional extractions.
4.0 ANALYTICAL TECHNIQUES IN BIOANALYSIS
Chromatography is a separation technique by which solutes of two or more components are separated by a dynamic differential migrational process. In a system consisting of two phases, one of which moves continuously in a given direction and in which individual components exhibit differential mobility due to difference in their adsorption or partition or molecular size etc.
4.1 Selection of Mobile Phase
Since mobile phase governs solute –stationary phase interaction
Practical considerations dictate that it should not degrade the equipment or column packing .So strong acids; bases and halides should be avoided.
Chemical purity of sample is important factor. Since large volume of solvents are pumped through the column. Trace amount of impurities can easily concentrate in column and eventually detrimental to the result. So HPLC grade solvents only recommended to use in the analysis
Volatility should be considered if sample recovery is required and mass transfer between solvent and stationary phase will be reduced.
Water, acetonitrile, ethanol, 2-propanol & methanol are widely used solvents. High concentration of THF (Tetrahydrofuran) as modifier should be used with extreme caution in APCI (Atmospheric Pressure Chemical Ionization) with heated nebulizer due to flammability air should not be used or auxiliary gas in APCI operation.
4.2 Role of solvent type
4.3 Selection of buffer and role of pH
pH is another factor in resolution equation that will affect the selectivity of the separation. In reverse phase HPLC, sample retention increases when the analyte is more hydrophobic .Thus when an acid (HA) or base (B) is ionized (converted in the form of unionized free or base) it becomes more hydrophilic and is less interactive with column binding sites.
Thus when selecting a buffer for a given application the following considerations are important. The buffer capacity is dependent on the buffer pH, pKa and buffer concentration. Other properties such as volatility, solubility, stability of the buffer and its reactivity to the analytes play important role in chromatographic system.
Ammonium formate & ammonium acetate are suitable for buffer mobile phase in LC/MS/MS. Usually 2-10 mM concentration is adequate but concentration up to 50 mM can be used.
Ammonium acetate may be used to replace phosphate buffers, which are not recommended for LC/MS.
Ammonium adducts will frequently be observed in positive ion operation and formate or acetate ion adduct will be observed in negative ion operation.
All the ammonium buffers may enhance sensitivity of weakly acidic compound undergoing negative ion analysis.
Triflouroacetic acid are recommended in concentration 0.1 to 1.0 % usually to enhance MS ionization but LC requirement may need higher concentration.
Addition of acid will suppress the negative ion signal intensity since weakly acidic compound will not be deprotonated in acidic solution.
Triflouroacetic acid may be used in LC/MS especially for protein / peptide analysis but positive ion signals intensity is usually lower when formic acid is used. TFA and sulfonic acids should not be used for negative ion operation. Triethylamine may be used but it may suppress the ionization of less basic compound in positive ion operation (it gives an enhanced intense ion at m/z 102). It may be used in negative ion mode to enhance ionization of other compounds.
4.4 Selection of column
HPLC column is the important tool for separation of analytes .So the column must possess good selectivity, efficiency and reproducibility to provide good separation of analytes. Commonly used column are C-18, C-8, Phenyl, Cyano columns. They are chemically different bonded phase having different selectivity with same mobile phase.
5.0 METHOD DEVELOPMENT
Method development involves considerable trial and error procedures.
The pH of the mobile phase has to be selected in such a way that the compounds are not ionized. If the retention times are too short, then decrease 5 % of the organic phase concentration in the mobile phase, if the retention times are too long, an increase 5% of organic phase concentration in the mobile phase is needed.
Elution of Drug molecules can be altered by changing the polarity of the mobile phase. The elution strength of a mobile phase depends upon its polarity. Ionic samples (acidic or basic) can be separated only, if they are present in undissociated form. Dissociation of ionic samples may be suppressed by proper selection of pH.
Whenever acidic or basic samples are to be separated it is strongly advisable to control mobile phase pH by adding a buffer. PH of the buffer is to be adjusted before adding organic phase. The buffer selected for a particular separation should be used to control pH over the range of pka ±1.0.
Optimizations can be started only after a reasonable chromatogram has been obtained. A reasonable chromatogram means that all the compounds are detected by more or less symmetrical peaks on the chromatogram.
Many laboratories use 4.6mm ID as standard one, but it is worth considering using 4mm ID column as an alternative. This 4 mm column requires only 75 % of the solvent consumption than that of 4.6 mm column.
Selecting an appropriate stationary phase can also help to improve the efficiency of method development. For example, a C-8 phase (reversed phase) can provide a further time saving over a C-18 as it doesn’t retain the analytes as strongly as the C-18 phase.
For normal phase application cyano phases are most versatile. C-18 (250 x 4.6 mm) column are more often used in laboratory. These columns are able to resolve a wide variety of compounds due to their selectivity and higher number of theoretical plates.
In bio-analysis the method development step additionally require the extraction trial in order to recover the analyte and internal standard from highly complicated biological matrix. One should have knowledge about the nature of the Drug, namely its molecular weight, polarity, pKa, ionic character and the solubility parameter.
Selection of internal standard should be on the basis of structural similarity, physicochemical properties related to the analyte to be quantified.
Finally selected method has to be validated to see whether it does what it was intended to do; i.e. it must be validated through validation parameters. The validated bio-analytical method is then applied for quantitation of Drug and its metabolites at its LOQ level with suitable precision and accuracy in a reproducible manner.
6.0 INSTRUMENTATION
6.1 Liquid chromatography and mass spectrometry
It is the way of interfacing the high vacuum domain of mass spectrometer with the condensed phase domain of liquid chromatography. (Marvin C. Mcmaster 2006)
6.2 Need of LC system interfacing with mass spectrometer
The separation is done prior to mass analysis because the mass spectrometer is incapable of directly determining every analyte in all type of sample. The Liquid chromatography can be regarded as a part of preparative procedure required for sample clean up which improves linearity, accuracy and better sensitivity. Mass spectrometer provides greater selectivity and sensitivity for chromatographic development because endogenous matrix can co-elutes with analytes yet not interferes as long as these components possess precursor masses.
BLOCK DIAGRAM OF LC – MS/MS
6.2.1 Sample inlet system
There are two opinions of a sample inlet system
The sample introduced as neutral species through a controlled vacuum leak followed by ionization in vacuum chamber.
Create the ion at atmospheric pressure and then introduced the ion in to the mass spectrometer through a controlled vacuum leak with aid of electrostatic this process is called API (atmospheric pressure ionization) provide best way when a dynamic coupling of liquid chromatograph done.
API is largely responsible for dramatic growth of mass spectrometry in pharmaceuticals industry, so API-LC/MS system is now-a-days commonly used.
6.2.2 Ionization source
Ionization proceeds by two fundamental processes:
Loss/gain of an electron
An odd electron ions is generated by the gain/loss of an electron. In vacuum generating method ionic species of identical nominal molecular weight differ only by the mass of an electron to the neutral specie from which it was generated. An even electron is produced by gain or loss of even electron specie from a molecule.
There are four common modes of ionization
Electron ionization (EI)
Chemical ionization (CI)
Matrix-Assisted Laser desorption Ionization (MALDI)
Atmospheric pressure ionization (API)
In LC/MS interfacing Atmospheric Pressure Ionization (API) is the potential Ionization techniques because
It gives softer ionization
It provide convenient interface with liquid chromatograph
The less fragmentation of the molecular ions and a convenient interface with liquid chromatograph at ambient pressure to mass spectrometry at high vacuum.
6.2.2.1 Type of API Source
Atmospheric Pressure Electro Spray Ionization
6.2.2.1.1 Atmospheric Pressure Electro Spray Ionization
6.2.2.1.2 Atmospheric Pressure Chemical Ionization
It is an ionization technique in which the ionization occurs not in vacuum but at atmospheric pressure. It is a gas phase ionization process where by gas phase molecules are isolated from the carrier solvent before ionization. Generally less polar compounds are ionized by this method. (Michaela Malm, 2000).
Atmospheric Pressure Chemical Ionization
6.2.3 Mass analyzer
Any mass analyzer contains electrical or magnetic field or combination of two, which is capable of manipulating the trajectory of ions in a vacuum chamber. For any mass analyzer the analyte particle, should be charged in order to separate the ion from the other ions. There are so many type of analyzer used in MS system but specially Quadrupole analyzer is used frequently in the case of LC/MS/MS.
6.2.3.1 Quadrupole Mass Analyzer
RF/DC ratio. For a given RF/DC voltage ratio the quadrupole analyzer filter only the ion with in a selected mass/charge ratio have a stable trajectory as they pass from one quadrupole rod set to the other. If RF/DC is held constant only a narrow m/z range will transmit the quadrupole. In this configuration quadrupole mass analyzer act as a mass filter or quadrupole filter. In case of bioanalysis it is used as a tandem (MS/MS).
It consists of a capillary interface for liquid introduction, a heated nebulization system and a high voltage corona needle, it require high liquid flow rate like 200 micro liter/min.
Quadrupole Mass Analyzer
Tandem means when two or more than two analyzer either of different type (TOF/Q) or the same type (Q/Q) configured. The quadrupole mass analyzer configured in tandem commonly called Triple Quadrupole Mass Analyzer. This configuration increases the inherent selectivity and capability of instrument exponentially. In between the two quadrupole a collision cell is used as a false quadrupole for the fragmentation of precursor ions. This cell is either hexapole or octapole not true quadrupole so this configuration is called as triple quadrupole.
6.2.3.2 Ionization Polarity
In API method either positive or negative charge ion can be generated. The type of ions generated is dependent on the charge of adduct gain or loss during ionization. e.g.: A positive DC voltage on the capillary will generate positive ion from the basic compound such as amine will favor the positively charged ions (protonated). A negative DC voltage produce negative ion from acidic compounds such as carboxylic acid will favor negatively charged ion (deprotonated).
6.2.3.3 Tandem mass spectrometry
Tandem mass spectrometry is also called as mass spectrometry-mass spectrometry because the instrument contain two mass analyzer in tandem. A collision cell is placed between the two analyzers.
quadrupole. This arrangement provides good selectivity and sensitivity. The first quadrupole is used to select the parent ion and fragmentation occurs in the collision cell. The fragmented ion goes to second quadrupole, which select the ions of the specific reaction product only.
In this process the internal energy of analyte is increasing which induce the fragmentation this is achieved by collision activation. Collision with neutral gas molecules called collision induced dissociation (CID).
6.2.3.4 CID is a two-step process:
higher pressure. In principle two mass analyzers are required, one is for selecting the precursor ions from the ions generated in the ion source and other for analyzing the product ions after the collision for this approach is called tandem mass spectrometry.
6.2.4 Detector
The ions pass through the mass analyser and are then detected and transformed into causable signal by a detector. Detectors are able to generate from the incident ions an electric current that is proportional to their abundance. Detectors used in mass spectrometry were reviewed in 2005. The most common types of ion detectors are described below. (Edmond de Hoffmann 2004)
Photographic Plate
Faraday Cup
Electron Multipliers
6.2.4.1 Photographic Plate
The first mass spectrometers used photographic plates located behind the analyser as detectors. Ions sharing the same m/z ratio all reach the plate at the same place and the position of the spots allows the determination of their m/z values after calibration. The darkness of the spots gives an approximate value of their relative abundance. This detector, which allows simultaneous detection over a large m/z range, has been used for many years but is obsolete today.
6.2.4.2 Faraday Cup
are neutralized by either accepting or donating electrons as they strike the walls. This leads to a current through the resistor. The discharge current is then amplified and detected. It provides a measure of ion abundance.
Because the charge associated with an electron leaving the wall of the detector is identical to the arrival of a positive ion at this detector, secondary electrons that are emitted when an ion strikes the wall of the detector are an important source of errors if they are not suppressed. In consequence, the accuracy of this detector can be improved by preventing the escape of reflected ions and ejected secondary electrons. Various devices have been used to capture ions efficiently and to minimize secondary electron losses. For instance, the cup is coated with carbon because it produces few secondary ions. The shape of the cup and the use of a weak magnetic field prevent also any secondary electrons produced inside to exit.
6.2.4.3 Electron Multipliers
At present, the most widely used ion detector in mass spectrometry is the electron multiplier (EM). In this detector, ions from the analyser are accelerated to a high velocity in order to enhance detection efficiency. This is achieved by holding an electrode called a conversion dynode at a high potential from ±3 to ±30 kV, opposite to the charge on the detected ions. A positive or negative ion striking the conversion dynode causes the emission of several secondary particles. These secondary particles can include positive ions, negative ions, electrons and neutrals.
When positive ions strike the negative high-voltage conversion dynode, the secondary particles of interest are negative ions and electrons. When negative ions strike the positive high-voltage conversion dynode, the secondary particles of interest are positive ions. These secondary particles are converted to electrons at the first dynode. These are then amplified by a cascade effect in the electron multiplier to produce a current. The electron multipliers may be of either the discrete dynode or the continuous dynode type (channeltron, microchannel plate or microsphere plate)
high negative potential from−1 to−5 kV, whereas the output of the multiplier remains at ground potential. Secondary particles generated from the conversion dynode strike the first dynode surface causing an emission of secondary electrons. These electrons are then accelerated to the next dynode because it is held at a lower potential. They strike the second dynode causing the emission of more electrons. This process continues as the secondary electrons travel towards the ground potential. Thus a cascade of electrons is created and the final flow of electrons provides an electric current at the end of the electron multiplier that is then increased by conventional electronic amplification.
6.2.5 Modes of LC/MS monitoring
The first quadrupole, Q1, is operated in either a full-scan or SIM mode to select ions to pass on to the other analyzers in the system. The middle Q2 unit is flooded with a heavy inert gas, either krypton or xenon, and fragmentation is induced as the ions passed to Q2 from the first quadrupole undergo thermal collision with the higher concentration of large molecules. The final analyzer, Q3, can also be selected for either full-scan or SIM mode operation. We have two operational modes for both Q1 and Q3, providing four possible experiments that are run with a triple-quad mass spectrometer.
There are four possible modes of operation of the two analyzers:
Q1 scan/Q3 SIM, called daughter mode or precursor scanning.
Q1 SIM/Q3 scan, called parent mode or product scan.
Q1 scan/Q3 scan, referred to as neutral loss scanning mode.
6.2.5.1 Daughter Mode or Precursor Scanning
SCAN/SIM mode operation lets us determine which primary fragments are related to each other. The first quadrupole is scanned over the mass range, and all fragments formed enter the collision cell and fragment to form secondary fragments. The third quadruple is parked at a specific mass/charge position and only primary fragments that break down to form this specific secondary m/z value will be detected. This common daughter ion points out interrelated primary fragments and helps us to understand which fragments are formed when a large primary fragment breaks down. In LC/MS we could store a TIC run of a peptide mixture for retention times and molecular-weight determination and then run Q3 parked at mass 79 and lay this chromatogram over the TIC to detect phosphorylated peptides present in the mixture.
6.2.5.2 Parent Mode or Product Scan
SIM/scan operations parks the first quadrupole analyzer at a specific mass, allowing only a single primary fragment to enter the collision cell where it fragments into secondary ions. The final quadrupole is run in full-scan mode, detecting all secondary product fragments formed from this single primary parent, again providing structural information by showing its breakdown products. This mode is commonly used in LC/MS to examine a molecular ion for its mass spectrometer fragments to provide structural identification.
6.2.5.3 Neutral Loss Scanning Mode
When a primary fragment undergoes further fragmentation, it breaks into two pieces, a charged secondary fragment and a neutral molecule. What we are detecting in this mode are primaries that lose the same neutral molecule, such as carbon monoxide, water, or a vinyl compound, and therefore may be breaking down by the same fragmentation mode. The molecular mass of our suspected “neutral loss” is the value we assign to our scan offset between the two scanning quadrupole analyzers. All primary fragments separated in the first analyzer enter the collision cell and fragment. Only secondary fragments whose mass is exactly the neutral loss smaller than their primary fragment are detected after the final quadrupole and show up in the display of the scanning chromatogram. Any primary fragment that breaks down by forming a neutral molecule that has a mass different from the offset mass will not be selected by the second analyzer and enter the detector.
6.2.5.4 Multiple Reaction Monitoring (MRM) Mode
LITERATURE REVIEW
Mary Ellen Sweeney, Rebecca R. Johnson, Expert Opinion, Drug
evaluation, Ezetimibe: an update on the mechanism of action,
pharmacokinetics and recent clinical trials, 2007, (441-450).
Elevated serum cholesterol is a known risk factor for the development of coronary artery disease. Circulating cholesterol is a product of both cholesterol absorption from the gut and cellular cholesterol production. Ezetimibe is a novel cholesterol-lowering drug that acts at the brush border of the small intestine. Recent studies have further identified the molecular target as the Niemann-Pick C1-like transporter. Ezetimibe blocks the absorption of dietary and biliray sterols resulting in intracellular cholesterol depletion. Clinical studies have demonstrated beneficial improvements in the lipid profile with Ezetimibe as monotherapy, but dramatic effects are seen when Ezetimibe is combined with other lipid-lowering drugs, particularly 3-hydroxy-3-methylglutaryl coenzyme A reductase inhibitors (statins). Combination studies of Ezetimibe with statins, bile acid sequestrants, fenofibrate and niacin all demonstrate significant total and low density lipoprotein cholesterol lowering. An excellent safety and tolerability profile combined with once-daily dosing make this attractive adjunct therapy for the treatment of hypercholesterolemia.
Unnam Seshachalam, Chandrasekhar B. Kothapally, HPLC Analysis
for Simultaneous Determination of Atorvastatin and Ezetimibe in
Pharmaceutical Formulations, Journal of Liquid Chromatography and Related
A simple, isocratic, and sensitive reverse phase high performance liquid chromatographic(RP-LC) method has been developed, for the first time, for quantitative determination of Atorvastatin and Ezetimibe in pharmaceutical formulations, Atorvastatin and Ezetimibe were chromatographed using 0.01 M ammonium acetate buffer (pH: 3.0): Acetonitrile (50:50 v/v) as mobile phase. The detection was monitored at 254nm. The retention time of ezetimibe and Atorvastatin were 15.50 and 19.30 respectively. The linearity of the method was studied over the concentration range of 4-400 µg/mL for Atorvastatin and 5-500 µg/mL for Ezetimibe. The limit of detection for Atorvastatin and Ezetimibe were found as 1.25µg/mL and 1.48µg/mL, respectively. The proposed method was applied for the quantitative determination of Atorvastatin and Ezetimibe in commercial combination formulations.
Stefan Ostwald, Eberhard Scheuch, Ingolf Cascorbi, Werner Siegmund,
A LC-MS/MS method to quantify the novel cholesterol lowering drug
Ezetimibe in human serum, urine and feces in healthy subjects genotyped for
SLCO1B1, Journal of Chromatography B, 830(2006), 143-150.
mm x 100mm, particle size 3.5µm) was done isocratically with Acetonitrile: water: 60:40, flow rate 200µL/min. The MS/MS analysis was performed in the negative ion mode. The validation ranges for Ezetimibe were as follow serum 0.00001-0.015µg/mL and 0.001-0.2 µg/mL; urine and fecal homogenate 0.025-10 µg/mL and 0.1-20 µg/mL, respectively. The assay was successfully applied to measure ezetimibe disposition in two subjects genotyped for the hepatic uptake transporter SLCO1B1.
Oliveira P. R., Brum Junior L., Fronza M., Bernardi L. S., Masiero M.
K., Dalmora S. L., Development and Validation of a Liquid
chromatography-Tandem Mass Spectrometry Method for the determination of Ezetimibe in
Human Plasma and Pharmaceutical Formulations, Chromatographia 2006, 63.
glucuronide in human plasma to support clinical and pharmacokinetics studies. Moreover, the method was used for the quality control analysis of pharmaceutical dosage forms.
Hossein Danafar, Mehrdad Hamidi, a Rapid and Sensitive LC-MS
Method for determination of Ezetimibe concentration in Human Plasma:
Application to a Bioequivalence Study, Chromatographia (2013) 76:1667-1675.
Shuijun Li, Gangyi Liu, Jingying Jia, Xiaochuan Li, Chen Yu, Liquid
Chromatography-Negative ion Electrospray Tandem Mass Spectrometry for
the Quantification of Ezetimibe in Human Plasma, Journal Of Pharmaceutical
And Biomedical Analysis, 40 (2006)., 987-992.
A simple, reliable and sensitive liquid-liquid chromatography-tandem spectrometry method (LC-MS/MS) was developed and validated for quantification of free and total ezetimibe in human plasma. The analyte and internal standard (Ezetimibe 13C6) were extracted by liquid-liquid extraction with methyl tert-butyl ether. The reversed-phase chromatographic separation was performed on a Capcell C18 column, and the plasma extract was eluted with a gradient consisting of Acetonitrile and 5mM ammonium acetate. The analyte was detected using negative ionization by multiple-reaction monitoring mode. The mass pair of 408.5 270.8 and m/z 414.5 276.8 were used to detect ezetimibe and internal standard, respectively. The assay exhibited linear ranges from 0.02 to 20ng/mL for free ezetimibe and 0.25 to 250ng/mL for total ezetimibe in human plasma. Acceptable precision and accuracy were obtained for concentration of the calibration standard and quality control. The validated method was successfully used to analyze human plasma samples for application in a pharmacokinetic study.
Sistla R., Tata V. S. S. K., Kashyap Y. V., Chandrasekhar D., Diwan P.
V., Development and validation of a reversed phase HPLC method for the
determination of ezetimibe in Pharmaceutical dosage forms, Journal Of
Pharmaceutical And Biomedical Analysis, 39 (2005), 517-522.
DRUG PROFILE
DRUG NAME
Ezetimibe
CHEMICAL NAME
((3R,4S)-1-(4-Fluorophenyl)-3-[(S)-3-(4-Fluorophenyl)-3-hydropropyl]-4-(4hydrophenyl) azetidine-2-one)
MOLECULAR STRUCTURE
MOLECULAR FORMULA
C24H21F2NO3
MOLECULAR MASS
409.43 g/mol
PROPERTIES
Ezetimibe is an odorless white crystalline powder,
It having a bitter taste.
It is soluble in dilute acids, methanol and chloroform.
CATEGORY
Anti-hyperlipidaemic
CLINICAL PHARMACOLOGY
Ezetimibe, a novel drug that acts by inhibiting intestinal absorption of cholesterol and phytosterols. It interferes with a specific CH transport protein NPC1L1 in the intestinal mucosa and reduce absorption of both dietary and biliray CH.
MECHANISM OF ACTION
The mechanism of action is distinct from other potent lipid- lowering drug that acts in the gut. Ezetimibe is a potent inhibitor of cholesterol and phytosterols absorption in the small intestine, where both dietary and biliary cholesterol are available for absorption. However, its action is unique in that does not affect cholesterol micelle formation or increase bile acid secretion. It does not alter fat-soluble vitamin and nutrient absorption.
PHARMACOKINETICS
1. ABSORBTION
Peak plasma concentration of total Ezetimibe (free Ezetimibe + Ezetimibe Glucuronide) 1-2 Hr. Concomitant food administration has no effect on the rate or extent of oral bioavailability. Ingestion of a high fat meal significantly increased Cmax (by 44%) and decreased Tmax with no net change in AUC. This change was not
2. DISTRIBUTION
Highly bound to plasma protein (>93%) and not affected by chronic renal disease or moderate chronic liver failure.
3. METABOLISM
Extensive presystemic metabolism via intestinal uridine 5’diposphate-glucuronosyl transferase enzyme to the active glucuronyl metabolite (Ezetimibe metabolite).Ezetimibe and its conjugate and then transported via the portal vessels to the liver where they undergo additional glucuronidation and subsequent bilary secretion into the intestine. Ezetimibe-glucuronide accounts for the 80-90% of drug in plasma. Plasma concentration time profiles exhibit multiple peaks, suggesting enterohepatic recirculation. The rate and extent can be affected by either intestinal or hepatic secretion via P-glycoprotein and multi drug resistance- associated protein 2.
Ezetimibe is neither an inhibitor nor an inducer and only a minor substrate of common CYP iso-enzymes at clinically relevant doses.
4. EXCRETION
AIM AND PLAN OF WORK
Studies to measure bioavailability and /or establish bioequivalence of product are important elements in support of orally administered Drug products in Investigational New Drug applications (INDs), New DRUG Applications (NDAs), Abbreviated New Drug application (ANDAs) and their supplements. The systemic exposure profile determined during clinical trial in IND period can serve as benchmark for subsequent BE studies.
Mathematic analysis of plasma level v/s time curve permit estimation of half lives, absorption, excretion rates, extent of absorption (area under curve ) and constants that are useful in determining the fate of a given Drug in an organism. Comparative bioavailability studies permit judgement as to the bioequivalence of Drugs. These determinations may in turn lead to important decision related to Drug product selection by pharmacists.
However it should be noted that neither bioavailability nor bioequivalence data could be generated without analytical methodology to accurate measure Drug in biological fluids.
Methods of measuring drugs in biological media are increasingly important problems related to bio-availability and bio-equivalence, new drug development, drug abuse, clinical pharmacokinetics and drug research are highly dependent on accurately measured drugs in biological fluids. Bioavailability & bioequivalence, new Drug development, Drug abuse, clinical pharmacokinetics & Drug research are highly dependent on accurately measuring Drugs in biological fluids.
For estimation of Drugs and its in vivo active metabolite present in biological fluid LC/MS/MS method is considered to be most suitable since it is a powerful and rugged method. It is also extremely specific, accurate, sensitive and rapid when compared to the other methods.
Present experiment is to develop & validate a selective and sensitive method for the quantitative determination of Ezetimibe in human plasma using LC-MS/MS technique.
PLAN OF THE PRESENT STUDY IS AS FOLLOWS:
1. Optimization of chromatographic conditions was proposed to be developed and optimized.
Selection of wavelength,
Selection of initial separation conditions,
Nature of mobile phase (pH, peak modifier, solvent strength, ratio and flow rate),
Sensitivity
2. The developed method were also proposed to be validated using the various validation parameters such as,
System Suitability Test
Selectivity
Carry over
Matrix Effect
Precision and Accuracy
Recovery
Dilution integrity
Ruggedness
Reinjection Reproducibility
Hemolysis Effect
Reagent Stability
MATERIALS AND METHODS
DRUGS USED
Standards Batch No./ Lot No. Manufacture Retest Date/ Date of Expiry
Ezetimibe F028D0 USP Current Lot
Ezetimibe D4 CRC-0213-094 Clearsynth 08May2019 Ezetimibe Phenoxy
Glucuronide 1424-095A8 TLC 14Jul2020
CHEMICALS AND REAGENTS USED
Materials and Reagent Grade Make/Suppliers
Sodium Acetate Trihydrate AR CDH
Sodium Hydroxide AR Merck
β-Glucuronidase N/AP Sigma Aldrich
Glacial Acetic Acid AR Merck
Diethyl Ether AR Spectrochem
Acetonitrile LCMS JT Baker
L-Ascorbic Acid AR SDFCL
Methanol LCMS JT Baker
Ammonium Acetate AR Sigma Aldrich
Water Milli-Q Millipore
INSTRUMENT USED
Name Model / Brand Make
Multi Tube Vortexer 1401002 Tarson
Vortex Shaker SPINIX Tarson
Analytical Balance MSA225S-100-DA Sartorius
Micro Balance MSA2.7S-000-DM Sartorius
pH Meter Star A211 Thermo
Centrifuge 5810 R Eppendorf
Deep freezer (-65 ±10ºC) MDF-U74V-PE Panasonic Deep freezer (-20 ±5ºC) MDF-U731M-PE Panasonic
Refrigerator MPR-514-PE Panasonic
Refrigerator FKG 371 Vestfrost
Auto Pipette RESEARCH PLUS Eppendorf
Multipette M4 Eppendorf
Milli Q water system ADVANTAGE A10 Millipore Ultra Sonicator Ultrasons-HD J.P. Selecta
Nitrogen Evaporator Turbo Vap lv Biotage
PREPARATION OF SOLUTIONS
1. Ammonium Acetate Buffer (pH 4.0)
2. Diluent ( Methanol : Water :: 80:20 )
Transferred 800.000 mL of Methanol into a regent bottle and added 200.000 mL of Water mixed well and labeled.
3. 0.5 M Sodium Acetate Buffer (pH 5.0)
Weighed approximately 6.804 g of sodium acetate trihydrate and transferred it into a 100.000 mL reagent bottle containing 100.000 mL of water, mixed well and adjusted the pH to 5.0 using glacial acetic acid and labeled.
4. 1.00% L-ascorbic Acid
This solution is used as a diluent for the preparation of β-Glucuronide enzyme solution.
Weighed approximately about 1.000 g of L-Ascorbic acid and transferred it into a 100.000 mL reagent bottle containing 100.000 mL of water, mixed well and labeled.
5. β-Glucuronidase Enzyme Solution(20000 IU/mL)
This solution is used for hydrolysis enzymatic reaction.
Prepared approximately about 20000 IU/mL of β-Glucuronidase Enzyme solution using 1.00% L-ascorbic Acid as a diluent, vortexed to mix and labeled.
6. 0.1 N Sodium Hydroxide
Weighed approximately about 400.000 mg of sodium hydroxide and transferred it into a 100.000 mL reagent bottle containing 100.000 mL of water, mixed well and labeled.
7. Mobile Phase (Acetonitrile: Buffer:: 75:25)
Transferred 750.000 mL of Acetonitrile into a 1000.000 mL reagent bottle and added 250.000 mL of 5mM Ammonium acetate buffer (pH 4.0) and mixed well, sonicate and labeled.
8. Rinsing Solution
Acetonitrile shall be used as rinsing solution.
PREPARATION OF EZETIMIBE CALIBRATION CURVE STANDARDS
1. Stock Solution Preparation of Ezetimibe
Weighed accurately about 2.0198 mg of Ezetimibe working standard and transferred into 2.000 mL volumetric flask containing methanol and diluted up to the mark with the same. Calculate the actual concentration using amount weighed and purity of Ezetimibe.
Stock conc. =
100
x
weight
formula
x
)
ml
(
,
volume
Total
1000
x
percent
assay
x
.
wt
molecular
x
,
taken
.
Wt
Weight taken (mg) Formula Weight MolecularWeight Assay %
Total volume, (mL)
2. Preparation of Ezetimibe Intermediate Solution1 (100687.030 ng/mL)
Pipette out 1.000 mL of Ezetimibe stock solution into 10.000 mL volumetric flask and diluted up to the mark with the diluent.
3. Preparation of Ezetimibe Intermediate Solution2 (10068.703 ng/mL)
Pipette out 1.000 mL of intermediate stock solution1 into 10.000 mL volumetric flask and diluted up to the mark with the diluent.
4. Preparation of Ezetimibe Intermediate Solution3 (1006.870 ng/mL)
Pipette out 1.000 mL of intermediate stock solution2 into 10.000 mL volumetric flask and diluted up to the mark with the diluent.
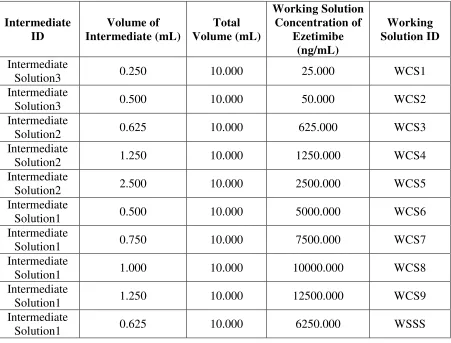
5. Preparation of Working Solution of Ezetimibe
Table No. 1 Preparation of Working Solution for CC Standards Intermediate ID Volume of Intermediate (mL) Total Volume (mL) Working Solution Concentration of Ezetimibe (ng/mL) Working Solution ID Intermediate
Solution3 0.250 10.000 25.000 WCS1
Intermediate
Solution3 0.500 10.000 50.000 WCS2
Intermediate
Solution2 0.625 10.000 625.000 WCS3
Intermediate
Solution2 1.250 10.000 1250.000 WCS4
Intermediate
Solution2 2.500 10.000 2500.000 WCS5
Intermediate
Solution1 0.500 10.000 5000.000 WCS6
Intermediate
Solution1 0.750 10.000 7500.000 WCS7
Intermediate
Solution1 1.000 10.000 10000.000 WCS8
Intermediate
Solution1 1.250 10.000 12500.000 WCS9
Intermediate
Solution1 0.625 10.000 6250.000 WSSS
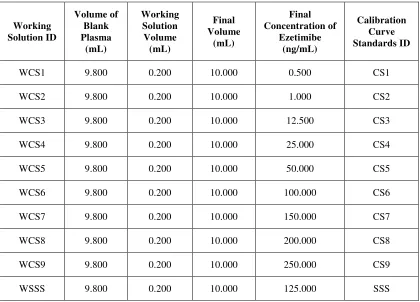
6. Preparation of Calibration Curve Standards
Calibration curve standards shall consist of blank plasma, zero blank and non-zero calibration curve standards covering the expected range of concentrations of analyte. Stock dilutions shall be used for the preparation of different calibration curve standards and resulted concentrations of Ezetimibe in spiked plasma for different calibration curve standards is as described in Table No. 2.
Table No. 2 Preparation of Calibration Curve Standards Working Solution ID Volume of Blank Plasma (mL) Working Solution Volume (mL) Final Volume (mL) Final Concentration of Ezetimibe (ng/mL) Calibration Curve Standards ID
WCS1 9.800 0.200 10.000 0.500 CS1
WCS2 9.800 0.200 10.000 1.000 CS2
WCS3 9.800 0.200 10.000 12.500 CS3
WCS4 9.800 0.200 10.000 25.000 CS4
WCS5 9.800 0.200 10.000 50.000 CS5
WCS6 9.800 0.200 10.000 100.000 CS6
WCS7 9.800 0.200 10.000 150.000 CS7
WCS8 9.800 0.200 10.000 200.000 CS8
WCS9 9.800 0.200 10.000 250.000 CS9
WSSS 9.800 0.200 10.000 125.000 SSS
PREPARATION OF EZETIMIBE QUALITY CONTROL SAMPLES
1. Stock Solution Preparation of Ezetimibe
Weighed accurately about 2.0792 mg of Ezetimibe working standard and transferred into 2.000 mL volumetric flask containing methanol and diluted up to the mark with the same. Calculate the actual concentration using amount weighed and purity of Ezetimibe.
Stock conc. =
100
x
weight
formula
x
)
ml
(
,
volume
Total
1000
x
percent
assay
x
.
wt
molecular
x
,
taken
.
Wt
Weight taken (mg) Formula Weight MolecularWeight Assay %
Total volume, (mL)
2. Stock Solution Preparation of Ezetimibe Phenoxy Glucuronide
Weighed accurately about 2.9887 mg of Ezetimibe Phenoxy Glucuronide (Equivalent to 2.000 mg of Ezetimibe) and transferred into 2.000 mL volumetric flask containing methanol and diluted up to the mark with the same. Calculate the actual concentration using amount weighed and purity of Ezetimibe.
Stock conc. =
100
x
weight
formula
x
)
ml
(
,
volume
Total
1000
x
percent
assay
x
.
wt
molecular
x
,
taken
.
Wt
Weight taken (mg) Formula Weight MolecularWeight Assay %
Total volume, (mL)
Conc. ng/mL 2.9887 585.56 409.43 97.90 2.000 1022923.790
3. Preparation of Ezetimibe and Ezetimibe Phenoxy Glucuronide
Intermediate Solution4 (102563.527 ng/mL)
Pipette out 0.200 mL of Ezetimibe stock solution and 0.800 mL of Ezetimibe Phenoxy Glucuronide stock solution into 10.000 mL volumetric flask and dilute up to the mark with the diluent.
4. Preparation of Ezetimibe and Ezetimibe Phenoxy Glucuronide
Intermediate Solution5 (10256.353 ng/mL)
Pipette out 1.000 mL of intermediate stock solution4 into 10.000 mL volumetric flask and dilute upto the mark with the diluent.
5. Preparation of Ezetimibe and Ezetimibe Phenoxy Glucuronide Intermediate
Solution6 (1025.635 ng/mL)
Note: Subsequent intermediate dilutions shall be prepared from previous intermediate instead of respective stock solution.
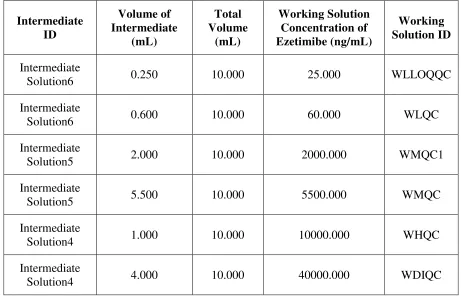
6. Preparation of Working Solution of Ezetimibe
[image:69.595.81.542.326.625.2]Working solution of different concentration of Ezetimibe shall be prepared using suitable container/Volumetric Flask using different volumes of above intermediate solutions as described in following Table No. 3, for quality control samples. These intermediate solutions shall be diluted up to the mark with the diluent.
Table No. 3 Preparation of Working Solution for QC Samples
Intermediate ID Volume of Intermediate (mL) Total Volume (mL) Working Solution Concentration of Ezetimibe (ng/mL) Working Solution ID Intermediate
Solution6 0.250 10.000 25.000 WLLOQQC
Intermediate
Solution6 0.600 10.000 60.000 WLQC
Intermediate
Solution5 2.000 10.000 2000.000 WMQC1
Intermediate
Solution5 5.500 10.000 5500.000 WMQC
Intermediate
Solution4 1.000 10.000 10000.000 WHQC
Intermediate
Solution4 4.000 10.000 40000.000 WDIQC
Diluent: Methanol: Water (80: 20 v/v)
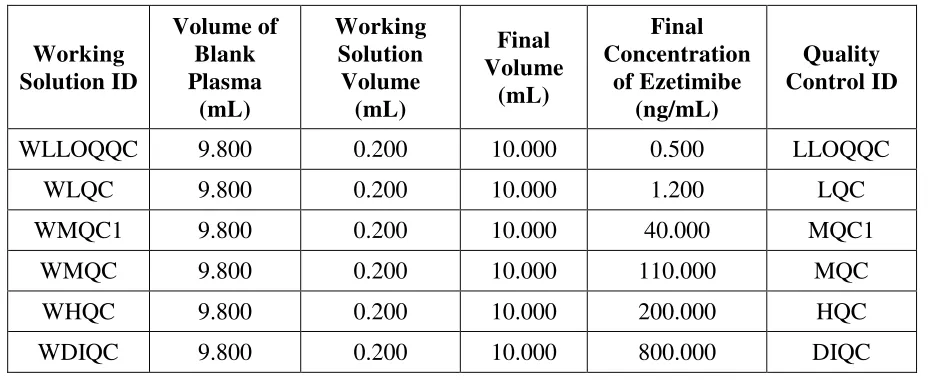
7. Preparation of Quality Control Samples
replicates at each different concentration levels i.e. LLOQ QC, LQC, MQC1, MQC, HQC, and DIQC). Stock dilutions shall be used for the preparation of different concentration levels of QC and resulted concentrations of Ezetimibe in spiked plasma for different QC samples as described in Table no. 4.
TABLE No. 4 Preparation of Quality Control Samples
Working Solution ID Volume of Blank Plasma (mL) Working Solution Volume (mL) Final Volume (mL) Final Concentration of Ezetimibe (ng/mL) Quality Control ID
WLLOQQC 9.800 0.200 10.000 0.500 LLOQQC
WLQC 9.800 0.200 10.000 1.200 LQC
WMQC1 9.800 0.200 10.000 40.000 MQC1
WMQC 9.800 0.200 10.000 110.000 MQC
WHQC 9.800 0.200 10.000 200.000 HQC
WDIQC 9.800 0.200 10.000 800.000 DIQC
Note:
1. QC samples shall be prepared containing both Ezetimibe Phenoxy Glucuronide and Ezetimibe to mimic the study sample analysis requirement as the study samples will contain both Ezetimibe Phenoxy Glucuronide and Ezetimibe. The QC samples shall be prepared in the proportion of 80: 20 where 80% of Ezetimibe Phenoxy Glucuronide and 20% of Ezetimibe.
PREPARATION OF EZETIMIBE D4
1. Preparation of Ezetimibe D4 Internal Standard Stock Solution
Weighed about 2.000 mg of Ezetimibe-D4 working standard and transferred into 2.000 mL volumetric flask containing methanol and diluted up to the mark with the same. Calculate the actual concentration using amount weigh