METHOD DEVELOPMENT AND VALIDATION OF SITAGLIPTIN
AND SIMVASTATIN IN TABLET DOSAGE FORM BY RP-HPLC
DISSERTATION
Submitted to
THE TAMILNADU DR.M.G.R.MEDICAL UNIVERSITY, CHENNAI.
In partial fulfilment for the award of the degree of
MASTER OF PHARMACY
In
(Pharmaceutical Analysis)
By 26101132 Under the Guidance of
Mrs. VIJAYA NAGARAJAN, M.Pharm.,( Ph.D).,
DEPARTMENT OF PHARMACEUTICAL ANALYSIS C.L.BAID METHA COLLEGE OF PHARMACY CHENNAI – 600 097.
SRI. VINOD KHANNA SRI HARISH L.METHA Chairman Secretary & Correspondent
Dr.SHANTHA ARCOT, B.pharm, M.Sc.(Pharm), Ph.D Dr. GRACE RATHNAM , M.Pharm, Ph.D Head of the Department, Principal.
Department of pharmaceutical analysis. HOD, department of pharmaceutics.
CERTIFICATE
This is to certify that the project entitled “METHOD DEVELOPMENT AND VALIDATION OF SIMVASTATIN AND SITAGLIPTIN BY RP-HPLC METHOD” by 26101132 submitted in partial fulfilment for the degree award of Master of Pharmacy was carried out at C. L. Baid Metha college of Pharmacy, Chennai-96 during the academic year 2011-2012.
Place: Chennai
SRI. VINOD KHANNA SRI HARISH L.METHA Chairman Secretary & Correspondent Dr.SHANTHA ARCOT, B.pharm,M.Sc.(Pharm), Ph.D Dr. GRACE RATHNAM, M.Pharm,Ph.D Head of Department Principal
Department of pharmaceutical analysis. HOD, department of pharmaceutics.
CERTIFICATE
This is to certify that the project entitled “METHOD DEVELOPMENT AND VALIDATION OF SIMVASTATIN AND SITAGLIPTIN BY RP-HPLC” by 26101132 submitted in partial fulfilment for the degree award of Master of Pharmacy was carried out at C.L.Baid Metha college of Pharmacy, Chennai-96 under the supervision of Mrs.Vijaya Nagarajan, M.Pharm.,(Ph.D)., DEPARTMENT OF PHARMACEUTICAL ANALYSIS during the academic year 2011-2012.
Place: Chennai
SRI. VINOD KHANNA SRI HARISH L.METHA Chairman Secretary & Correspondent Dr.SHANTHA ARCOT, B.pharm,M.Sc.Pharm, Ph.D Dr. GRACE RATHNAM, M.Pharm,Ph.D Head of Department Principal.
Department of pharmaceutical analysis. HOD, department of pharmaceutics. CERTIFICATE
This is to certify that the project entitled “METHOD DEVELOPMENT AND VALIDATION OF SIMVASTATIN AND SITAGLIPTIN BY RP-HPLC” by 26101132 submitted in partial fulfilment for the degree award of Master of Pharmacy was carried out at C.L.Baid Metha college of Pharmacy, Chennai-96 under the supervision of Mrs.Vijaya Nagarajan, M.Pharm.,(Ph.D)., DEPARTMENT OF PHARMACEUTICAL ANALYSIS during the academic year 2011-2012.
Place: Chennai
Date: Dr. Grace Rathnam M.Pharm, Ph.D Principal, HOD, department of pharmaceutics. C.L.Baid Metha College of Pharmacy, Chennai-97.
DECLARATION
The thesis entitled “METHOD DEVELOPMENT AND VALIDATION OF
SIMVASTATIN AND SITAGLIPTIN BY RP-HPLC METHOD” was carriedout by me in Department of Pharmaceutical Analysis, C.L.Baid Metha College of Pharmacy, Chennai – 97 during the academic year 2011-2012. The work embodied in this thesis is original, and is not submitted in part or full for any other degree of thisor any other University.
Place: Chennai [Reg. No: 26101132]
Date: DEPT OF PHARMACEUTICALANALYSIS
ACKNOWLEDGEMENT
Behind every achievement and success of this project work lies an Unfathomable sea of gratitude to those who activated it, without whom it would ever have come in to existence to them we lay the words of gratitude imprinted with in us. Firstly it was dedicated my lovable parents.
I am deeply indebted to my respective guide Mrs. Vijaya Nagarajan, M.Pharm.,Phd. ,
Department of Pharmaceutical Analysis for her valuable suggestions and personal encouragement were of great importance to improve the outcome of the project.
I consider myself lucky to work under the guidance of Dr. Shantha Arcot, B.pharm, M.Sc.Pharm., Ph.D, Head, Department of Pharmaceutical Analysis, C.L.Baid Metha College of Pharmacy, Chennai – 96, for her support and valuable suggestion during my project work.
It’s my privilege to express my grateful and sincere gratitude to Dr. Grace Rathnam, M.Pharm. , Ph.D principal, HOD, department of pharmaceutics. C.L.Baid Metha College of Pharmacy.
I acknowledge my sincere thanks to Mrs. G.UMA, M.Pharm. assistant professor, Mrs. R.VIJAYA GEETHA, M.Pharm(PhD), assistant professor, Mrs. .S. YAMUNA M.Pharm (PhD), assistant professor Department of pharmaceutical Analysis, for their valuable suggestions throughout my thesis work.
I thank almighty and my parents for blessing with happiness and I convey my thanks to all my friends who helped me in all the issues they can.
Place: Chennai Reg. No: 26101132
Contents
Section Title Page number
1. INTRODUCTION
1.1.Introduction to Analytical Chemistry
1
1.2. High Performance Liquid Chromatography 5
1.3. ICH Guidelines for Analytical Method Validation
20
1.4. Statistical Parameters 22
2.
DRUG PROFILE
2.1 simvastatin 30
2.2 sitagliptin 32
3.
LITERATURE REVIEW
344. AIM AND PLAN OF WORK 42
5. MATERIALS AND METHODS
5.1 materials
43
5.2 method development 53
6. RESULTS AND DISCUSSION 113
7. SUMMARY & CONCLUSION 116
List of chromatograms
Serial number
Content
Chromatogram
number
Page number
1. Trail-1 1 45
2. Trail-2 2 46
3. Trail-3 3 47
4. Trail-4 4 49
5. Trail-5 5 50
6. Optimized method 6 52
7. System suitability 7-11 55-59
8. Specificity-blank 12 62
9. Specificity-placebo 13 63
10.
Specificity-sitagliptin standard 14 64
11.
Specificity-simvastatin standard 15 65
12. Specificity-mixed
standard
16 66
13.
Specificity-placebo+
14. Sample 18-22 68-70
15. Linearity 23-27 72-74
16. Assay 28&29 81&82
17. Accuracy standard
1&2
30&31 84&85
18. Accuracy-50% 32-34 86&87
19. Accuracy-100% 35-37 88&89
20. Accuracy-150% 38-40 90&91
21. System precision 41-45 93&94
22. Method precision 46-50 97-99
23. Sensitivity 51-53 102,104&105
24. Robustness 54-57 107-110
LIST OF TABLES
Table number Content Page number1. Classification of
chromatographic methods
14
2. Validation parameters for
robustness
28
3. System suitability-simvastatin
& sitagliptin
60
4. Linearity results for sitagliptin
76
5. Linearity results for
simvastatin
77
6. Accuracy results for sitagliptin
92
7. Accuracy results for
simvastatin
92
8. System Precision results for
sitagliptin & simvastatin
96
9. Method precision results for
sitagliptin & simvastatin
100
10. Robustness results for
sitagliptin
111
11. Robustness results for
simvastatin
112
LIST OF ABBREVIATIONS USED
ICH - International Conference on Harmonization I.P - Indian pharmacopeia.
λ - Lambda
LOD - Limit of Detection
LOQ - Limit of Quantification
μg/ml - Microgram per Milliliter mg/tab - Milligram Per tablet
mL - Millilitre
nm - Nanometer
% - Percentage
% RSD - Percentage Relative Standard Deviation
S.D. - Standard Deviation
S.E. - Standard Error
USP - United States Pharmacopoeia
IR - Infra Red
UV-VIS - Ultraviolet- Visible
°C - Degree Celsius
gms - Grams
µl - Microlitre
rpm - Revolutions Per Minute
µ - Micron
v/v - Volume/Volume
USP - United State Pharmacopeia
BP - British Pharmacopeia
ng - nano gram
STG - sitagliptin
SMV - simvastatin
Chapter-1
INTRODUCTION
11.1. Analytical chemistry
Pharmaceutical Analysis may be defined as the application of analytical procedures used to determine the purity, safety and quality of drugs and chemicals. The term “Pharmaceutical analysis” is otherwise called quantitative pharmaceutical chemistry. Pharmaceutical analysis includes both qualitative and quantitative analysis of drugs and pharmaceutical substances starts from bulk drugs to the finished dosage forms. In the modern practice of medicine, the analytical methods are used in the analysis of chemical constituents found in human body whose altered concentrations during disease states serve as diagnostic aids and also used to analyze the medical agents and their metabolites found in biological system.
The term “quality” as applied to a drug product has been defined as the sum of all factors, which contribute directly or indirectly to the safety, effectiveness and reliability of the product. These properties are built into drug products through research and during process by procedures collectively referred to as “quality control”.
Quality control guarantees within reasonable limits that a drug products
Is free of impurities.
Is physically and chemically stable
Contains the amount of active ingredients as stated on the label and
Provides optimal release of active ingredients when the product is administered.
Types of analytical methods
Analytical methods can be separated into classical and instrumental.
classical methods (also known as wet chemistry methods) use separations such asprecipitation, extraction, and distillation and qualitative analysis by color, odor, or melting point. Quantitative analysis is achieved by measurement of weighed or volume.
Classification
Classical methods Titration Reaction types
1.Acid-Base Titrations
Types of acid-base titrations.
i Strong Acid / Strong Base: pH at equivalence point = 7. ii Weak Acid / Strong Base: pH at equivalence point >7. iii Strong Acid / Weak Base: pH at equivalence point <7. 2. Redox titrations.
3. Complexometric Titrations. 4. Zeta- potential Tittrations. 5. Miscellaneous titration. 6. Iodimetry titration. 7. Precipitation titration. 8. KjeldahlTitration. 9. Argentometric Titrations. 9.1 The Mohr titration. 9.2 Volhard titration. 9.3 Fajans titration.
10. Classification of titration by end-point techniques. 10.1 Conductometric titration.
10.2 Potentiometric titration. 10.3 Spectrophotometric titration 10.4 Amperometric titration
10.5 Thermometric or enthalpimetric titration. 10.6 Nonaqueous titration.
10.7 Automatic titration. 10.8 electrochemical titration. 11. Back titrations
2. Gravimetric or weighed titrimetry i. Weighed drug after extraction.
ii. Weighed a derivative after separation. iii. Weighed residue after ignition. 3. Coulometric titrimetry.
4. Standardization.
INSTRUMENTAL
METHODS
1. Spectrophotometric Methods. i. Dye complex methods. ii. Colourimetric method. iii. Ultra violet method. iv. Flourimetric method. v. Flame photometry.
vi. Atomic absorption spectroscopy. vii. Infrared spectrophotometry. viii. Raman spectroscopy. ix. X-ray spectroscopy. x. Mass Spectroscopy. 2. Electro analytical methods. i. Potentiometry. ii. Voltametry. iii. Coulometry. iv.Electrogravimetry. v. Conductance techniques. 3. Chromatographic methods.
i. Thin layer chromatography. ii. Paper chromatography. iii. Column chromatography. iv.Gas chromatography.
v. High Performance Liquid Chromatography and high performance thin layer chromatography.
i. Thermal analysis. ii. Kinetic techniques. iii. Enzyme assay. 5. Hyphenated techniques.
i. GC-MS (Gas chromatography – Mass spectrometry). ii. LC-MS (Liquid chromatography – Mass spectrometry). iii. GC-IR (Gas chromatography – Infrared spectroscopy). iv. ICP-MS (Inductively coupled plasma – Mass spectrometry).
CHROMATOGRAPHY INTRODUCTION
2Chromatography is the name applied to a group of analytical techniques for isolation of components in mixture for qualitative identification, purification and quantitative estimation of many components.
Recently IUPAC has defined the chromatography as “A method used primarily for separation of the components of a mixture sample in which the components are separated and distributed between stationary phase and mobile phase. The stationary phase may be solid or liquid supported on a solid or gel and maybe packed in a column separated as a layer or distributed as a film, the mobile phase maybe gaseous or liquid.”
The importance of Chromatography is increasing rapidly in pharmaceutical analysis. The exact differentiation, selective identification and quantitative determination of structurally closely related compounds are possible with chromatography. Another important field of application of chromatographic methods is the purity testing of final products and intermediates (detection of decomposition products and by products). As a consequence of the above points, chromatographic methods are occupying an ever-expanding position in the latest editions of the pharmacopoeias and other testing standards.
The modern form of column chromatography has been called high performance, high pressure, high resolution and high speed liquid chromatography.
chromatography and the use of much smaller particles of the adsorbent or support becomes possible increasing the column efficiency substantially.
High performance liquid chromatographyis the fastest growing analytical technique for the analysis of drugs. Its simplicity, high specificity and wide range of sensitivity made it ideal for the analysis of many drugs in both dosage forms and biological fluids. This technique is based on the same methods of separation as that of classical column chromatography i.e. adsorption, partition, ion exchange and gel permeation, but it differs from the column chromatography in the fact that the mobile phase is passed through the packed column under high pressure. In classical open column chromatography, the mobile phase flows slowly through the column by means of gravity with the diameter of particles (of solid support) in the range of 150 - 200µm. But in HPLC, the separation is about 100 times faster than the conventional liquid chromatography due to packing of particles in the range of 3-10µm. Thus HPLC is having advantages of improved resolution, faster separation, improved accuracy, precision and sensitivity.
1.2.HIGH PERFORMANCE LIQUID CHROMATOGRAPHY (HPLC)
3The term ‘Chromatography’ covers those processes aimed at the separation of the various species of a mixture on the basis of their distribution characteristics between a stationary and a mobile phase.
Instrumentation of HPLC
.
Principle of separation in HPLC
Chromatography is one of the widely used physiochemical methods of separation of inorganic and organic substances related in their composition and properties. Chromatography is characterized by two important features,
a. A very large interface area, and
b. A dynamic way of operation, which ensures a more effective separation of substances as compared to other methods.
Modes of Chromatography
Modes of chromatography are defined essentially according to the nature of the interactions between the solute and the stationary phase, which may arise from hydrogen bonding, Vander walls forces, electrostatic forces or hydrophobic forces or basing on the size of the particles (e.g. Size exclusion chromatography).
Advantages of HPLC
- It is efficient, highly selective and widely applicable. - Only small sample amount is required for analysis. - Ordinarily nondestructive to sample.
- HPLC readily adaptable to Quantitative analysis.
- It is simple and inexpensive equipment compared to GC.
- HPLC can accommodate nonvolatile and thermally unstable samples. - It is generally applicable to inorganic ions.
Types of HPLC
Based on the mode of separation
Normal phase chromatography Reverse phase chromatography. Partition chromatography. Displacement chromatography.Based on principle of separation
Chiral phase chromatography. Ion pair chromatography.
Based on elution technique
Isocratic separation. Gradient separation.
Based on the scale of operation
Analytical HPLC. Preparative HPLC.
Based on the type of analysis
Qualitative analysis. Quantitative analysis.
Based on the mode of separation
NormalPhaseChromatography
In normal phase chromatography, the stationary phase is a polar adsorbent and the mobile phase is generally a mixture of non-aqueous solvents.
The silica structure is saturated with silanol groups at the end. These OH groups are statistically disturbed over the whole of the surface. The silanol groups represent the active sites (very polar) in the stationary phase. This forms a weak type of bond with any molecule in the vicinity when any of the following interactions are present.
Dipole-induced dipole
Dipole-dipole
Hydrogen bonding
π-Complex bonding
the sample molecule but also on steric factors. If a molecule has several functional groups, then the most polar one determines the reaction properties.
Chemically modified silica, such as the aminopropyl, cyanopropyl and diol phases are useful alternatives to silica gel as stationary phase in normal phase chromatography.
The aminopropyl and cyanopropyl phases provide opportunities for specific interactions between the analyte and the stationary phases and thus offer additional options for the optimizations of separations. Other advantages of bonded phases lie in their increased homogeneity of the phase surface.
Resolution with water in weak mobile phase may be most conveniently achieved by drying the solvents and then adding a constant concentration of water or some very polar modifier such as acetic acid or triethylamine (TEA) to the mobile phase. The addition of such polar modifiers serves to deactivate the more polar shape as well as the reproducibility of the retention times.
Reversed
Phase
Chromatography
Since 1960’s chromatographers started modifying the polar nature of silanol group is chemically reacting silica with organic silanes. The objective is to made less polar or non polar so that polar solvents can be used to separate water-soluble polar compounds. Since the ionic nature of the chemically modified silica is now reversed i.e. it is non-polar or the nature of the phase is reversed. The chromatographic separation carried out with such silica is referred to as reversed- phase chromatography.
A large number of chemically bonded stationary phases based on silica are available commercially. Silica based stationary phases are still most popular in reversed phase chromatography however other absorbents based on polymer (styrene-di-vinyl benzene copolymer) are slowly gaining ground.
The retention time decreases in the following order: aliphatics > induced dipoles (i.e. CCl4) > permanent dipoles (e.g.CHCl3) > weak Lewis bases (ethers, aldehydes, ketones) >
As a general rule the retention increases with increasing contact area between sample molecule and stationary phase i.e. with increasing number of water molecules, which are released during the adsorption of a compound. Branched chain compounds are eluted more rapidly than their corresponding normal isomers.
In reversed phase systems the strong attractive forces between water molecules arising from the 3-dimentional inter molecular hydrogen bonded network, from a structure of water that must be distorted or disrupted when a solute is dissolved. Only higher polar or ionic solutes can interact with the water structure. Non- polar solutes are squeezed out of the mobile phase and are relatively insoluble in it but with the hydrocarbon moieties of the stationary phase.
Chemically bonded octadecyl silane (ODS) an alkaline with 18 carbon atoms is the most popular stationary phase used in pharmaceutical industry. Since most pharmaceutical compounds are polar and water soluble, the majority of HPLC methods used for quality assurance, decomposition studies, quantitative analysis of both bulk drugs and their formulations use ODS HPLC columns. The solvent strength in reversed phase chromatography is reversed from that of adsorption chromatography (silica gel) as stated earlier. Water interacts strongly with silanol groups, so that, adsorption of sample molecules become highly restricted and they are rapidly eluted as a result. Exactly opposite applies in reversed phase system; water cannot wet the non-polar (hydrophobic) alkyl groups such as C18 of ODS phase and therefore does not interact with the bonded moiety. Hence water is the
weakest solvent of all and gives slowest elution rate. The elution time (retention time) in reversed phase chromatography increases with increasing amount of water in the mobile phase.
Partition chromatography
analytes based on the polar differences is known as Hydrophilic Interaction Chromatography (HILIC). Partition HPLC has been used historically on unbounded silica or alumina supports. Each works effectively for separating analytes by relative polar differences. However, HILIC has the advantage of separating acidic, basic and neutral solutes in a single chromatogram.
Eg CPC (Centrifugal Partition Chromatography), GLC (Gas Liquid Chromatography), and paper partition chromatography.
Displacement Chromatography
The basic principle of displacement chromatography is a molecule with a high affinity for the chromatography matrix (the displacer) will compete effectively for binding sites and thus displace all molecules with lesser affinities. In elution mode, substances typically emerge from a column in narrow Gaussian peaks. Wide separation of peaks, preferably to baseline, is desired in order to achieve maximum purification. The speed at which any component of a mixture travels down the column in elution mode depends on many factors. But for two substances to travel at different speeds and thereby be resolved there must be substantial differences in some interaction between the bio molecules and the chromatography matrix. Operating parameters are adjusted to maximize the effect of this difference. In many cases, baseline separation of the peaks can be achieved only with the gradient elution and low column loadings. Thus, two drawbacks to elution mode chromatography, especially at preparative scale, are operational complexity, due to gradient solvent pumping, and low throughput, due to low column loadings. Displacement chromatography has advantages over elution chromatography in that components are resolved into consecutive zones of pure substances rather than “peaks”.
Based on principle of separation
Adsorption chromatography
When a mixture of compounds (adsorbate) dissolved in the mobile phase (eluent) moves through a column of stationary phase (adsorbent) they travel according to their relative affinities. The compound which has more affinity towards stationary phase travels slower and if less affinity towards stationary phase travels faster.
Ion exchange chromatography
Ion-exchange chromatography involves a solid stationary phase with anionic or cationic groups on the surface to which solute molecules of opposite charge are attracted. It is the process by which a mixture of similar charged ions can be separated using ion exchange resin. There is a reversible exchange of ions between the ions present in the column. And those present in the ion exchange resin. For cations, cation exchange resin, for anions, an anion exchange resin is used.
Eg Cationic exchangers
Natural Inorganic - Zeolite, Clays.
Natural Organic - Peat, Lignite, Neutral Sulphonated coal. Synthetic Inorganic - MgO, SiO2.
Synthetic Organic - Polymeric Resin matrix containing acidic exchange resins. Eg Anionic exchangers
Natural Inorganic - Dolamite.
Synthetic Inorganic - Heavy metal silicates.
Synthetic Organic - Polymeric Resin matrix containing basic exchange resins.
Size Exclusion chromatography
Size-exclusion chromatography involves a solid stationary phase with controlled pore size. Solutes are separated according to their molecular size, the large molecules enable to enter the pores eluting first. It is the process by which mixture of compounds with molecular sizes are separated by using gels. The gel used acts as molecular sieve. It can be separated by steric and diffusion effects of pores in the gels. The compound can separate according to the molecular sizes and the stationary phase is porous matrix.
Eg Separation of proteins, and polysaccharides.
Chiral phase chromatography
In this type of chromatography separation of optical isomers can be done by using chiral stationary phase i.e. levo and dextro form can be separated by using chiral stationary phases.
Ion pair chromatography
In this chromatography, a reverse phase column is converted temporarily into ion exchange column by using ion pairing agents like pentane or hexane.
Based on elution technique
Isocratic elution
In this elution technique, a single mobile phase is pumped to the column throughout the analysis. The composition or the concentration of the mobile phase is not altered throughout the run.
Isocratic mode
Gradient elution
In gradient elution, the mobile phase is changed at regular time intervals depending upon the sample of analysis. The concentration of the stronger mobile phase is increased during the run. Preparative chromatography is usually carried out by gradient elution technique.
Based on the scale of operation
4Analytical HPLC
Where it is used analysis of samples are done. But recovery of samples for reusing is normally not done, since the sample used is very low.
Eg microgram quantities.
Preparative HPLC
Where the individual fractions of pure compounds can be
collected using fraction collector. And the collector samples are reused.Eg separation of few grams of mixtures.
Based on the type of analysis
Qualitative Analysis
Which is used to identify the compound, detect the presence of impurities, to find out the number of components, etc. this is done using retention time values?
Quantitative Analysis
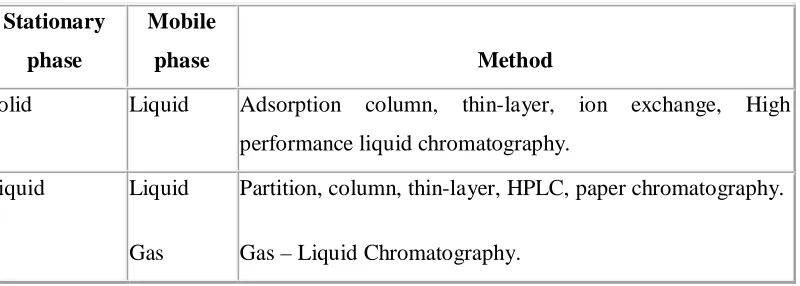
This is done to determine the quantity of the individual or several components in a mixture. This is done by comparing the peak area of the standard and sample. Chromatographic methods can be classified most practically according to the stationary and mobile phases, as shown in the table.
Stationary phase Mobile phase Method
Solid Liquid Adsorption column, thin-layer, ion exchange, High performance liquid chromatography.
Liquid Liquid
Gas
Partition, column, thin-layer, HPLC, paper chromatography.
[image:27.612.101.501.550.693.2]Gas – Liquid Chromatography.
The importance of Chromatography is increasing rapidly in pharmaceutical analysis. The exact differentiation, selective identification and quantitative determination of structurally closely related compounds are possible with chromatography. Another important field of application of chromatographic methods is the purity testing of final products and intermediates (detection of decomposition products and by-products). As a consequence of the above points, chromatographic methods are occupying an ever-expanding position in the latest editions of the pharmacopoeias and other testing standards.
The modern form of column chromatography has been called high performance, high pressure, high-resolution and high-speed liquid chromatography.
High-Performance Liquid Chromatography (HPLC) is a special branch of column chromatography in which the mobile phase is forced through the column at high speed. As a result the analysis time is reduced by 1-2 orders of magnitude relative to classical column chromatography and the use of much smaller particles of the adsorbent or support becomes possible increasing the column efficiency substantially.
The essential equipment consists of an eluent, reservoir, a high-pressure pump, and an injector for introducing the sample, a column containing the stationary phase, a detector and recorder. The development of highly efficient micro particulate bonded phases has increased the versatility of the technique and has greatly improved the analysis of multi component mixtures.
Chromatography parameters
5Calculating the following values (which can be included in a custom report) used to access overall system performance.
1.Relative retention 2.Theoretical plates 3.Capacity factor 4.Resolution 5.Peak asymmetry 6.Plates per meter 7.Back pressure.
The parameters used to calculate these system performance values for the separation of two chromatographic components. (Note: Where the terms W and t both appear in the same equation they must be expressed in the same units).
Relative retention (Selectivity)
The relative retention is calculated as an estimate using the following formula:
α = (t2 - ta) / (t1 - ta)
Theoretical plates (column efficiency)
It measures the band spreading of a peak. When band spread in smaller, the number of theoretical plates is higher. It indicates a good column and system performance.
n = 16 (t / W) 2
Capacity factor
This factor determines the retention of a solute and can be calculated from the chromatogram using the following formula
A low k' value indicates that the peak elutes close to the solvent front, which may compromise selectivity. A minimum k' value of 1 is recommended for the peak of interest.
The retention time of the test substance can be varied, if necessary, by changing the relative proportion or composition of solvents in the mobile phase. Generally, an increase in the proportion of a more polar solvent will lead to a shorter retention time on a normal-phase column and a longer retention time on a reserved-phase column.
Resolution
It is measure of the extent of separation of two compounds and the baseline separation is achieved. The resolution between two peaks of similar height in a chromatogram can be calculated using the following formula:
R = 2 (t2 - t1) / (W2 + W1)
To ensure the accuracy of quantitative analysis, the R value of the analyte peak with the adjacent peak must be larger than 1.5, unless otherwise specified. (tR1 tR2
W1 W2 )
Peak asymmetry (Tailing factor)
The Tailing Factor T, a measure of peak symmetry is unity for perfectly symmetrical peaks and its value increases as tailing becomes more pronounced. In some cases, values less than 1 may be observed. As peak asymmetry increases integration and hence precision becomes less reliable.
Where, W0.05 = peak width at 5% height
f = distance from peak front to apex point at 5% height.
The accuracy of Quantitation decreases with increase in peak tailing because of the difficulties encountered by the integrator in determining where / when the peak ends and hence the calculation of the area under the peak.
Plates per meter
Plates per meter can be expressed as
N = n / L
Backpressure
The pressure required to pump the mobile phase through the
column. It is related to mobile phase viscosity (η), flow rate (F), column length (L), and diameter (dc), and particle size (dp) by the following equation:
ΔP α FLη / dp2 dc2
HETP (High Equivalent Theoretical Plates)
A theoretical plate can be of any height, which decides the efficiency of separation. If HETP is less the column is more efficient. If HETP is more, the column is less efficient. The height equivalent to a theoretical plate (HETP) is given by
HETP =L/n
Where, α = Relative retention.
t2 = Retention time of the peak of interest measured from point of injection.
t1 = Retention time of the reference peak measured from point of injection.
ta = Retention time of an inert peak not retained by the column, measured from point
of injection.
t = Retention time of the component.
W = Width of the base of the component peak using tangent method.
K' = Capacity factor.
R = Resolution between a peak of interest (peak 2) and the peak preceding it
W2 = Width of the base of component peak 2.
W1 = Width of the base of component peak 1.
T = Peak asymmetry, or tailing factor.
W0.05 = Distance from the leading edge to the tailing edge of the peak, measured at a point 5 % of the peak height from the baseline.
f = Distance from the peak maximum to the leading edge of the peak.
N = Plates per meter.
L = Column length, in meters.
The HPLC process starts with the preparation of sample and placing in a vial .the organic phase and buffer are selected and the temperature for the analysis should be set. the injection volume vial number should be set and the chromatogram development occurs based on the affinity towards the stationary phase.
HPLC PROCESS
HPLC METHOD VALIDATION 6
1.3. ICH GUIDELINES
According to USP General Chapter <1225> “Validation is the process of providing documented evidence that the method does what it is intended to do”. In other words the
process of method validation ensures that the proposed analytical methodology is accurate,
specific, reproducible and rugged for its intended use
According to the FDA Guidelines on General Principles of Process Validation, process validation is defined, ‘‘ As establishing documented evidence, which provides a high
degree of assurance, that a specific process will consistently produce a product meeting its
predetermined specifications and quality characteristics.’’
According to ICH Guidelines Validation of an Analytical procedure is to demonstrate that it is suitable for its intended purpose.
Method validation can be defined as (ICHQ.2B)“Establishing documented evidence, which provides a high degree of assurance that a specific activity will consistently produce a desired result or product meeting its predetermined specifications and quality characteristics”.
Method Validation, however, is generally a one-time process performed after the method has been developed to demonstrate that the method is scientifically sound and that it serves the intended analytical purpose.
TYPES OF ANALYTICAL PROCEDURES TO BE VALIDATED7 - Identification tests.
- Quantitative tests for impurities content
- Limit tests for the control of impurities
- Quantitative tests of the active moiety in samples of drug substance or drug
product or other selected component(s) in the drug product.
Method Validation is required for the following
Method validation required for assuring the quality identity purity.
Achieving the acceptance of the product by the international agencies.
Mandatory requirements for the registration of Pharmaceuticals pesticides and
formations.
Validation methods are only acceptable for under taking sufficiency testing.
Identification tests are indented to ensure the identity of analyte in a sample. This is normally achieved by comparison of sample chromatograms to that of a reference standard.
Testing for impurities can be either a qualitative or quantitative limit test for the impurity in the sample.
All the variables of the method should be considered, including sampling procedure, sample preparation, chromatographic separation, detection and data evaluation. For chromatographic methods used in analytical applications there is more consistency in validation practice with key analytical parameters.
1.4. STATISTICAL PARAMETERS FOR METHOD VALIDATION8
Recovery
Response function.
Sensitivity
Precision.
Accuracy.
Standard deviation of slope.
Standard deviation of intercept.
Correlation coefficient.
Linearity and sensitivity of the method.
Limit of detection.
Limit of quantization.
Ruggedness.
Robustness.
Stability
Range .
Recovery
The absolute recovery of analytical method is measured as the response of a processed spiked matrix standard expressed as a percentage of the response of pure standard, which has not been subjected to sample pre-treatment and indicates whether the method provides a response for the entire amount of analyte that is present in the sample. It is best established by comparing the responses of extracted samples at low, medium and high concentrations in replicates of at least 6 with those non-extracted standards, which represent 100 % recovery.
Absolute recovery = Response of an analyte spike into matrix (processed) X 100
Response of analyte of pure standard (unprocessed)
If an internal standard is used, its recovery should be determined independently at the concentration levels used in the method.
Response function
Sensitivity
The method is said to be sensitive if small changes in concentration cause large changes in response function. The sensitivity of an analytical method is determined from the slope of the calibration line. The limits of quantification (LOQ) or working dynamic range of bio analytical method are defined as the highest and lowest concentrations, which can determined with acceptable accuracy. It is suggested that, this be set at ± 15% for both the upper and lower limit of quantitation respectively. Any sample concentration that falls outside the calibration range cannot be interpolated from the calibration line and extrapolation of the calibration curve is discouraged. If the concentration is over range, the sample should be diluted in drug-free matrix and re-assayed.
Precision
The closeness of agreement (degree of scatter) between a series of measurements obtained from multiple sampling of the same homogenous sample under the prescribed conditions. Precision may be considered at three levels:
Repeatability/ System Precision.
Reproducibility/ Method Precision
Ruggedness/ Intermediate Precision.
The purpose of carrying out a determination is to obtain a valid estimate of a ‘true’ value. When one considers the criteria according to which an analytical procedure is selected, precision and accuracy are usually the first time to come to mind. Precision and accuracy together determine the error of an individual determination. They are among the most important criteria for judging analytical procedures by their results.
Precision refers to the reproducibility of measurement within a set, that is, to the scatter of dispersion of a set about its central value. The term ‘set’ is defined as referring to a number (n) of independent replicate measurements of some property. One of the most common statistical terms employed is the standard deviation of a population of observation. Standard deviation is the square root of the sum of squares of deviations of individual results for the mean, divided by one less than the number of results in the set. The standard deviation S, is given by
Standard deviation has the same units as the property being measured.
The square of standard deviation is called variance (S2). Relative standard deviation is the standard deviation expressed as a fraction of the mean, i.e., S/x. It is sometimes multiplied by 100 and expressed as a percent relative standard deviation. It becomes a more reliable expression of precision.
% Relative standard deviation = S × 100 / x
Acceptance: %RSD should be not more than 2% for assay.
Accuracy
9Accuracy of analytical method is ‘Measure of how close the experimental value to the true value.’
Accuracy normally refers to the difference between the mean set of results and the true value for the quantity measured. According to IUPAC accuracy relates to the difference between results (or mean) and the true value. For analytical methods, there are two possible ways of determining the accuracy, absolute method and comparative method.
Accuracy is best reported as percentage bias, which is calculated from the expression.
Since for real samples the true value is not known, an approximation is obtained based on spiking drug – free matrix to a nominal concentration. The accuracy of analytical method is then determined at each concentration by assessing the agreement between the measured and nominal concentrations of the analytes in the spiked drug – free matrix sampler.
Accuracy studies is evaluated by recovery studies in which known amount of the drug substances is added to the previously analyzed pharmaceutical preparations of the drug and tested for the added drug.
Calibration
Calibration is the most important step in bioactive compound analysis. A good precision and accuracy can only be obtained when a good calibration procedure is adopted. In the spectrophotometric methods, the concentration of a sample cannot be measured directly, but is determined using another physical measuring quantity ‘y’ (absorbance of a solution). An unambiguous empirical or theoretical relationship can be shown between this quantity and the concentration of an analyte. The calibration between y = g (x) is directly useful and yields by inversion of the analytical calculation function.
The calibration function can be obtained by fitting an adequate mathematical model through the experimental data. The most convenient calibration function is linear, goes through the origin and is applicable over a wide dynamic range. In practice, however, many deviations from the ideal calibration line may occur. For the majority of analytical techniques the analyst uses the calibration equation.
Y = a + bx.
In calibration, univariate regression is applied, which means that all observations are dependent upon a single variable X.
Standard deviation of slope (Sb)
The standard deviation of slope is proportional to standard error of estimate and inversely proportional to the range and square root of the number of data points.
Sb =
Where Xi is the arithmetic mean of Xi values.
Standard deviation of intercept (Sa)
Sa =
Where Xi denote the arithmetic mean of xi, values.
Correlation Coefficient (r)
The correlation coefficient r(x, y) is more useful to express the relationship of the chosen scales. To obtain a correlation coefficient the covariance is divided by the product of the standard deviation of x and y.
r=
Linearity and sensitivity of the method
Knowledge of the sensitivity of the color is important and the following terms are commonly employed for expressing sensitivity. According to Bouger- Lambert – Beer’s law, log intensity of incident radiations
The absorbance (A) is proportional to the concentration (c) of the absorbing species, if absorptivity (Î) and thickness of the medium (t) are constant. When c is in moles per liter, the constant is called molar absorptivity. Beer’s law limits and Imax values are expressed as µg ml-1 and mole-1 cm-1 respectively.
Limit of detection
10The Detection Limit of an individual analytical procedure is the lowest amount of analyte in a sample which can be detected but not necessarily qualtitated as an exact value. The detection limit (LOD) may be expressed as
LOD = 3.3σ/S
Where, σ = the standard deviation of the response.
S = the slope of the calibration curve (of the analyte.
limit of quantization
LOQ is defined as the lowest concentration of the substance (analyte) in a sample that can be estimated quantitatively with acceptable precision, accuracy and reliability by a given method under stated experimental conditions. Quantitation Limit (LOQ) may be expressed as
LOQ = 10 σ /S
Where, σ = the standard deviation of the response.
S = the slope of the calibration curve (of the analyte).
Ruggedness
Method Ruggedness is defined as the reproducibility of results when the method is performed under actual use conditions. This includes different analysts, laboratories, columns, instruments, source of reagents, chemicals, solvents etc. Method ruggedness may not be known when a method is first developed, but insight is obtained during subsequent use of that method.
Acceptance: %RSD should not be more than 2.0% for assay.
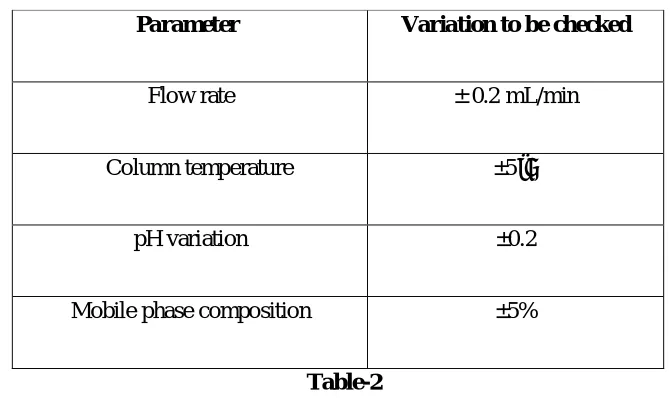
Robustness
purposely altered and chromatographic characters were evaluated. System suitability parameters are to be met at different conditions.
Validation parameters for robustness
Parameter Variation to be checked
Flow rate ± 0.2 mL/min
Column temperature ±5˚C
pH variation ±0.2
[image:41.612.134.469.140.339.2]Mobile phase composition ±5%
Table-2
Stability
To generate reproducible and reliable results, the samples, standards and reagents used for the HPLC method must be stable for a reasonable time (e.g. one day, one week, one month etc, depending upon need). For example, the analysis of even a single sample may require ten or more chromatographic runs to determine the system suitability, including standard concentrations to create a working analytical curve and duplicate or triplicate injections of the sample to be assayed.
Range
The range of a method can be defined as the upper and lower concentrations for which the analytical method has adequate accuracy, precision and linearity. The range of concentrations examined will depend on the type of method and its use.
Chapter-2
DRUG PROFILE
SIMVASTATIN
11A synthetic analog of lovastatin (antilipidemic).
CHEMICAL STRUCTURE
SIMVASTATIN
CHEMICAL FORMULA - C25H38O5.
CHEMICAL NAME - (1S,3R,7S,8S,8aR)-8-{2-[(2R,4R
)-4-hydroxy-6-oxotetrahydro-2H-pyran-2-yl]ethyl}-3,7-dimethyl 1,2, 3,7,8,8a-hexahydronaphthalen-1-yl2,2 dimethylbutane ate.
MOLECULAR WEIGHED - 418.56622
SOLUBILITY - practically insoluble in water, and freely soluble in chloroform, methanol and ethanol.
λMAX - 238nm.
PKa - 4.3
STORAGE CONDITION - It should be stored in well-closed, light- resistant containers at 5-30 deg C.
THERAPEUTIC ACTIVITY - Used in the treatment of hypercholesterolemia. Hydroxy methyl CoA reductase, hypolipidemic agent.
DESCRIPTION - white powder.
SITAGLIPTIN
12CHEMICAL STRUCTURE
SITAGLIPTIN
CHEMICAL FORMULA - C16H15F6N5O.
CHEMICAL NAME -
(3R)-3-amino-1-[3-(trifluoromethyl)-5H,6H,7H,8H- [1,2,4]triazolo[4,3-a]pyrazin-7-yl]-4-(2,4,5-trifluorophenyl)butan-1-one .
MOLECULAR WEIGHED - 407.3136.
SOLUBILITY - It is soluble in water and N,N-dimethyl formamide; slightly soluble in methanol; very slightly soluble in ethanol, acetone, and acetonitrile; and insoluble in isopropanol and isopropyl acetate.
λ MAX - 268nm.
PKa - 7.7.
MELTING POINT - 252.1ᵒC
STORAGE CONDITION - storedin well closed container.
THERAPEUTIC ACTIVITY - Anti diabetic drug.
DESCRIPTION - white to off-white, crystalline, nonhygro scopic
powder.
M.O.A
(13) -patients with type2 diabetes by slowing the inactivation of incretin hormones. Concentrations of the active intact hormones are increased by SITAGLIPTIN, thereby increasing and prolonging the action of these hormones. Incretin hormones, including glucagon-like peptide-1 (GLP-1) and glucose-dependent insulinotropic polypeptide (GIP), are released by the intestine throughout the day, and levels are increased in response to a meal. These hormones are rapidly inactivated by the enzyme, DPP-4. The incretins are part of an endogenous system involved in the physiologicregulation of glucose homeostasis.
Chapter-3
LITERATURE REVIEW
1. Sreelakshmy.N14 et.al (2011) developed a reverse phase high performance liquid chromatographic method for the simultaneous determination of Simvastatin and ezetimibe in tablet dosage form. The separation was effected on a symmetry C8 (4.68 x150mm,5 µm)using a mobile phase consisting of phosphate buffer and acetonitrile (50:50v/v)at a flow rate of 1ml/min. The detection was made at 236 nm. The retention time for ezetimibe and Simvastatin were 4.4 and 8.4 respectively. Caliberation curve were linear over the ranges of 10-50µg/ml for both ezetimibe and Simvastatin. The mean recovery was found to be 102.7% and 99.6% for ezetimibe and Simvastatin respectively. The correlation coefficients for both the components were close to. The developed method was validated according to ICH guidelines.
2. Pravish Kumar Tiwari 15 et.al(2010) has developed a simple, sensitive and validated HPTLC method to determine Niacin and Simvastatin simultaneously in synthetic mixture form. Chromatographic separation was achieved on a RP18 plate using a mixture of Methanol: Water: Acetic acid (60:40:0.1) at a wavelength of 237 nm. Linearity of the method was found to be in the concentration range of 5000.0-25000.0
μg/ml for niacin and 100.0-500.0 μg/ml for Simvastatin with correlation coefficient greater than 0.999.
3. Jat R K16 et.al (2012) developed a simple, accurate rapid and precise RP-HPLC method and validated for determination of Simvastatin in bulk drug. The RP-HPLC separation was achieved on Promosil C-18, (250 mm, 4.6 mm, 5µm) using mobile phase buffer: methanol ph 6.8 (96: 4 v/v) at flow rate of 1.0 ml/min at ambient temperature. The retention times were 9.546 min. for Simvastatin. Calibration plots were linear over the concentration range 1-50µg/ml. Quantification was achieved with photodiode array detection at 254 nm over the concentration range of 1-50 µg/ml.
for ezetimibe. The limit of detection and the limit of quantification for Simvastatin were found to be 170 ng/spot and 570 ng/spot respectively, and for ezetimibe, 20 ng/spot and 70 ng/spot respectively.
5. Varsha Balkrishna Mane18 et.al (2010) developed a versatile, accurate, precise and economic method for simultaneous determination of Simvastatin and ezetimibe in fixed dose combination products. The absorbance values at 238.2 nm and 247.6 nm and 243.3nm (isoabsorptive point) were used for the estimation of Simvastatin and ezetimibe, respectively without mutual interference. This method obeyed Beer’s law in the concentration range of 3–18 μg /ml for Simvastatin and 5-30 μg /ml for ezetimibe.
The results of analyses have been validated statistically for linearity, accuracy and precision, LOD and LOQ of the proposed method.
6.
Praveen Kumar S. N19et.al (2012) developed a simple, sensitive and validated HPLC method to determine Simvastatin in bulk drug and pharmaceutical formulation. Thechromatographic method was achieved on a C18 column (150x4.6 mm, 2.7 μm) using a
mixture of methanol and 0.1% ortho phosphoric acid in water (10:90) at a wavelength of 238 nm. The retention time of Simvastatin was found to be 3.106 min. The method was found to show good linearity in the concentration range of 5.0 – 60.0 μg/ml of
Simvastatin with correlation co-efficient of 0.9999. Accuracy was between 97.45% and 98.32%.
8.
Effat souri21et.al (2010) has developed a rapid and sensitive derivative spectrophotometric method for analysis of these drugs in combined dosage forms. A first order derivative spectrophotometric method was developed for simultaneous determination of Simvastatin and ezetimibe using zero-crossing technique. The measurements were carried out at 219 and 265 nm for Simvastatin and ezetimibe respectively. The described method was found to be linear (r2>0.999) over the range of 2-40 μg/mL for Simvastatin in the presence of 10μg/mL ezetimibe at 219 nm and in the range of 1-20 μg/mL of ezetimibe in the presence of 20 μg/mL of Simvastatin at 265 nm. The within-day and between-day precision values for both drugs were less than 3% (CV).9. Madhukar A22 et.al (2012) developed a analytical method suitable for validation of Simvastatin by reversed Phase High Performance liquid chromatography (RP-HPLC) method. The method utilized RP-HPLC (Younglin HPLC with UV-detector) model and a column, 150mm 4.6 mm, 5m (Symmetry, ODS- 3V, 150mm,4.6mm, 5m). The mobile phases were comprised of Acetonitrile and (0.02M) Buffer pH 3.5 (60:40 v/v). Validation experiments were performed to demonstrate System suitability, precision, linearity and Range, Accuracy study, stability of analytical solution and robustness. The method was linear over the concentration range of 1-150 mg/ML-1. The method showed good recoveries (98.2 – 104.3%).
11.Jyothirmayee.M24 et.al (2012) developed a new method based on oxidative coupling of Simvastatin with MBTH (3-Methyl-2-benzothiazolinone hydra zone hydrochloride monohydrate) as a chromogenic derivatizing reagent in presence of Ferric chloride, resulting green color complex with a suitable absorption at 628nm. Optimization studies showed that the coupling reaction is very fast and completed in less than 1 minute. The coupled complex formed exhibits absorption maximum at 628 nm. The assays were linear over the concentration range of 2-8 μg/ml and reproducible. Linear relationship
with good correlation coefficients 0.994 were found between absorbance and corresponding concentrations of drug. The reliability and performance of proposed methods was validated statistically the percentage recovery ranged from 100.36-101.75% respectively.
12.Srinivas .c 25 et.al (2012) developed a simple, rapid, sensitive, reverse phase isocratic RP-HPLC method for estimation of Simvastatin in bulk and microemulsion
formulation. The method was carried out using (Phenomenex Luna C18 5μm
4.6×250mm (i.d) column) with mobile phase comprised of 0.1% Triethylamine buffer (pH 7.5): Acetonitrile (20:80v/v). The flow rate was set at 1.0 ml/min and effluent was detected at 238nm, The retention time of Simvastatin was found to be 8.6 minute. The method developed was validated for specificity, accuracy, precision, linearity and limit of detection, limit of quantification, robustness and stability. The calibration curve was linear in the concentration range of 200-600 ng/ml with correlation coefficient of 0.999. LOD and LOQ were found to be 5ng/ml and 40ng/ml respectively. The percentage recovery for the Simvastatin was found to be 99.15% to 100.53% and the % RSD was found to be 0.980% (i.e <1%).
13.
Mohamed Salim26et.al (2012) developed a novel, quick, reliable and simple capillary zone electrophoresis CZE method and validated for the simultaneous determination of Sitagliptin (SG) and metformin (MF) in pharmaceutical preparations. Separation was carried out in fused silica capillary (50.0 cm total length and 43.0 cm effective length,49 μm i.d.) by applying a potential of 15 KV (positive polarity) and a running buffer
good linearity in the ranges of 10–100 μg/mL and 50–500 μg/mL with limits of detection of 0.49, 2.11 μg/mLand limits of quantification of 1.48, 6.39μg/mL for SG
and MF, respectively.
14. Bujji Babu27 et.al (2011) developed a simple, sensitive and accurate reversed phase high performance liquid chromatographic method for Enoxaparin sodium and Sitaglipitin drugs. Reversed phase chromatographic separation the above two drugs was performed a C18 column is used with different mobile phases of water, orthophosphoric acid, tetrahydrofuranan methanol, acetonitrile, sodiumdihydrogen phosphate, orthophosphoric acid respectively. The detection of wave length is 230 nm for Enoxaparin sodium and 270 nm for Sitagliptin .The percentage of recovery 99.5% for enoxaparin sodium and 97.6% for sitaglipitin. The proposed method is validated for linearity, accuracy, and precision, limit of detection (LOD) and limit of quantification (LOQ) as per the guide lines of Internationational Conference on Harmonization (ICH). 15.RamziaI28 et.al (2011) developed a Simple, accurate and precise SpectroflourImetric
and spectrophotometric methods and validated for the determination of Sitagliptin phosphate monohydrate (STG) and metformin HCL (MET). Zero order, first derivative, ratio derivative spectrophotometric methods and flourometric methods have been developed. The zero order spectrophotometric method was used for the determination of STG in the range of 50-300 μg mL−1. The first derivative spectrophotometric
method was used for the determination of MET in the range of 2–12 μg mL−1 and STG
in the range of 50-300 μg mL−1 by measuring the peak amplitude at 246.5 nm and 275
nm, respectively. The first derivative of ratio spectra spectrophotometric method used the peak amplitudes at 232 nm and 239 nm for the determination of MET in the range of 2–12 μg mL−1. The flourometric method was used for the determination of STG in the range of 0.25-110 μg mL−1.
16.RamziaI29 et.al (2011) developed a Simple, accurate and precise spectrophotometric methods for the determination of Sitagliptin and Vildagliptin in bulk and dosage forms. The proposed methods are based on the charge transferred complexes of Sitagliptin phosphate and Vildagliptin with 2,3-dichloro-5,6-dicyano-1,4-benzoquinone (DDQ), 7,7,8,8-tetracyanoquinodimethane (TC NQ) and tetrachloro-1,4-benzoquinone (p -chloranil). All the variables were studied to optimize the reactions conditions. For Sitagliptin, Beer’s law was obeyed in the concentration ranges of 50-300 μg/ml, 20-120
Vildagliptin, Beer’s law was obeyed in the concentration ranges of 50-300 μg/ml, 10-85
μg/ ml and 50-350 μg/ml with DDQ, TCNQ and p-chloranil, respectively. The developed methods were validated and proved to be specific and accurate for the quality control of the cited drugs in pharmaceutical dosageforms.
17.Bala sekaran.C30et.al (2010) developed a simple, sensitive and reproducible
spectrophotometric method for the determination of Sitagliptin phosphate in bulk and in
pharmaceutical formulations. The proposed method is based on condensation of the
primary amino group of Sitagliptin phosphate with acetyl acetone and formaldehyde
producing a yellow colored product, which is measured spectrophotometrically at
430nm. The color was stable for about 1 hour. Beer’s law is obeyed over a
concentration range of 5‐25 μg/ml. The apparent molar absorptivity and Sandell
sensitivity values are 1.067 x 10⁴ Lmol‐1cm‐1 and 0.0471 μgcm‐2 respectively.
18.Parag Pathade31et.al (2011) developed a simple, sensitive, reproducible and cost effective stability indicating UV Spectrophotometric method for quantitative determination of Sitagliptin Phosphate in bulk and pharmaceutical formulations. The UV spectrum was scanned between 200 to 400 nm and 267 nm was selected as maximum wavelength for absorption. Beer’s law was obeyed in the concentration range of 10-100 mg/ml. Good accuracy (99.87-100.45%), precision (%RSD 1.3147-1.2957) were found, the method was successfully applied to the pharmaceutical dosage form containing the above-mentioned drug without any interference by the excipients. The limit of detection and limit of quantification was found to be 0.16μg/ml & 0.45μg/ml
respectively.
19. Jain Pritam32et.al (2011) developed a simple, rapid, accurate and economical First
order UV-derivative spectrophotometric method for estimation of Sitagliptin from bulk
method. The precision of the method was studied as an intra-day, inter-day variations and repeatability. The % R.S.D. value less than 2 indicate that the method is precise. Ruggedness of the proposed method was studied with the help of two analysts.
20. Sumithra M33 et.al (2012) developed a simple, sensitive and rapid reverse phase high performance liquid chromatographic method for simultaneous estimation of Sitagliptin
and Metformin. A BDS hypersil C18 column (250x4.0mm,5μ) was used with a mobile
phase containing a mixture of phosphate buffer (Ph-4) and Acetonitrile and in the ratio of 60:40. The flow rate was 1.0ml/min and effluents were monitored at 260nm and eluted at 2.8min and 2.0min respectively. Calibration curve was plotted with a range from 2-12μg/ml for Sitagliptin and 20-120 μg/ml for Metformin.
21.Chellu S. N. Malleswararao 34 et.al (2012) developed a rapid, specific, accurate and precise reverse phase ultra performance liquid chromatographic (UPLC) method for the simultaneous determination of Sitagliptin phosphate mono-hydrate and Metformin hydrochloride in pharmaceutical dosage forms. The chromatographic separation was
achieved on Aquity UPLC BEH C8 100 x 2.1 mm, 1.7 μm, column using a buffer
consisting of 10 mM potassium dihydro-gen phosphate and 2 mM hexane-1-sulfonic acid sodium salt (pH adjusted to 5.50 with diluted phosphoric acid) and acetonitrile as organic solvent in a gradient program. The flow rate was 0.2 mL min−1 and the detection wavelength was 210 nm. The limit of detection (LOD) for Sitagliptin
phosphate monohydrate and Metformin hydrochloride was 0.2 and 0.06 μg mL−1, respectively. The limit of quantification (LOQ) for Sitagliptin phosphate monohydrate
and Metformin hydrochloride was 0.7 and 0.2 μg mL−1, respectively.
22.Ghazala Khan35 et.al (2011) developed a simple, precise and highly selective analytical method for simultaneous estimation of Metformin HCl and Sitagliptin in tablet formulation. Estimation was carried out by multi-component mode of analysis at selected wavelength of 232 nm and 267 nm for Metformin HCl and Sitagliptin respectively in distilled water. The method was found to be linear in the range of 1-40
μg/ml and accuracy of the method was confirmed by recovery studies of tablet dosages
23. Sheetal Sharma36 et.al (2012) developed two methods are for the determination of
Sitagliptin Phosphate and Simvastatin in binary mixture. The first method was based on spectrophotometric determination of two, using simultaneous equation method. It involves absorbance measurement at 267.0 nm (λmax Sitagliptin Phosphate) and 238.0 nm (λmax Simvastatin) in methanol: water in a ratio of 90:10(v/v); linearity was obtained in the range 10-50 μg/ml and 5 –25μg/ml for both the drugs respectively. The second method was based on separation of the two in reverse phase mode using Cosmosil C18 column and The mobile phase consisted Ammonium dihydrogen orthophosphate: ACN (Ph3 with OPA) in the ratio 50:50v/v that was set at a flow rate of1.0ml/min. Linearity was obtained in the concentration range 50-250μg/ml for
Sitagliptin and 10-50 μg/ml for Simvastatin. Both these methods were validated according to ICH guidelines and can be successively applied to pharmaceutical formulation.
Chapter-4
Aim and plan of work
Aim of workThe combination dosage form selected for the present study contains Simvastatin and Sitagliptin in solid oral dosage forms, recently this combination has been approved by USFDA ( united states food drug administration) in the year 2011.
The aim of work is to develop and validate a simple,