STRUCTURE-SOIL-STRUCTURE INTERACTION EFFECTS FOR TWO
HEAVY NPP BUILDINGS WITH LARGE-SIZE EMBEDDED
FOUNDATIONS
Dongyi Yue1, Dan M Ghiocel2, Hiro Fuyama3, Taknori Ogata4 and Gary Stark5
1
Consulting Engineer, URS Corporation, Princeton, NJ ([email protected])
2
Chief of Engineering, Ghiocel Predictive Technologies Inc., Rochester, NY
3
Mitsubishi Heavy Industries, Ltd., Kobe, Japan
4
Mitsubishi Nuclear Energy System, Inc., Arlington, VA
5
Project Manager, URS Corporation, Princeton, NJ
ABSTRACT
The US-APWR standard plant buildings consist of the Seismic Category I Reactor Building Complex (RBC) and the Seismic Category II Turbine Building (TB). The horizontal clearance between foundations of the two buildings is about 20 ft. Such a close foundation distance and comparable size and stiffness of the foundations necessitate investigation of the effect of the presence of the TB on response of the RBC to earthquake excitations through dynamic Structure-Soil-Structure Interaction (SSSI). The RBC foundation is embedded at depth of 42 feet. The embedment depth for TB foundation is about 27 feet. An integrated model of the RBC and the TB that considers foundation embedment therefore is developed and analyzed using ACS SASSI program. Resulting structural responses of the RBC to the three component earthquake excitation are compared to the responses obtained from the Soil-Structure Interaction (SSI) analysis of the standalone RBC embedded model to identify the SSSI effects. This paper presents the typical comparison results. It is concluded from the comparison that the SSSI effects of the TB on the RBC, in terms of In Structure Response Spectra (ISRS) at characteristic locations, are insignificant.
INTRODUCTION
Figure 1 Foundation Layout of the US-APWR Standard Plant Buildings
ANALYSIS INPUT
Soil Profiles
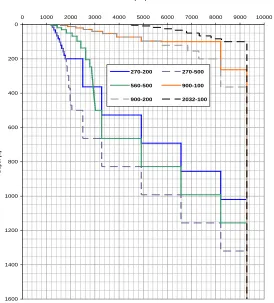
A total of six generic layered profiles (referred to as free field soils) are developed and used for the design and analysis of the US-APWR standard plant structures. The profiles are denoted as 270-200, 270-500, 560-500, 900-100, 900-200 and 2032-100 where the first number represents the average shear wave velocity in meters per second of the top 30 meters of soil and the second number denotes the overburden depth to bedrock in feet. Profiles 270-200 and 270-500 are relatively soft soil profiles, while profile 560-500 represents stiff overburden. Profiles 900-100 and 900-200 are soft rock profiles. 2032-100 is a hard rock soil profile. Figure 2 shows the small strain shear wave velocity distributions of the six generic soil profiles. Among the six generic soil profiles, four soil profiles, 270-200, 560-500, 900-100, 900-200, are selected to analyze the SSSI effects.
Vs (ft/s)
0
200
400
600
800
1000
1200
1400
1600
0 1000 2000 3000 4000 5000 6000 7000 8000 9000 10000
D
e
p
th
(ft)
270-200 270-500
560-500 900-100
900-200 2032-100
Figure 2 Shear Wave Velocity Distributions of the Six Generic Soil Profiles
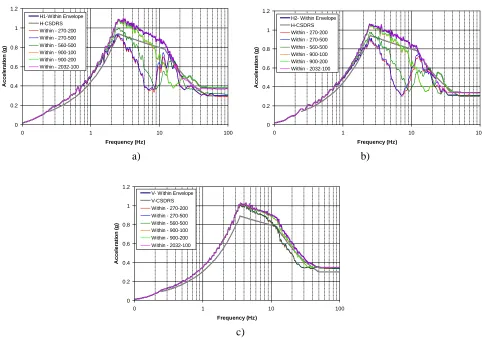
Input Control Motions
0 0.2 0.4 0.6 0.8 1 1.2
0 1 10 100
Frequency (Hz) A ccel er at io n ( g ) H1-Within Envelope H-CSDRS Within - 270-200 Within - 270-500 Within - 560-500 Within - 900-100 Within - 900-200 Within - 2032-100
0 0.2 0.4 0.6 0.8 1 1.2
0 1 10 100
Frequency (Hz) A ccel er at io n ( g )
H2- Within Envelope H-CSDRS Within - 270-200 Within - 270-500 Within - 560-500 Within - 900-100 Within - 900-200 Within - 2032-100
a) b)
0 0.2 0.4 0.6 0.8 1 1.2
0 1 10 100
Frequency (Hz) A ccel er at io n ( g )
V- Within Envelope V-CSDRS Within - 270-200 Within - 270-500 Within - 560-500 Within - 900-100 Within - 900-200 Within - 2032-100
c)
Figure 3 5% Damped Response Spectra of the Input Control Motions
DESCRIPTION OF MODELS
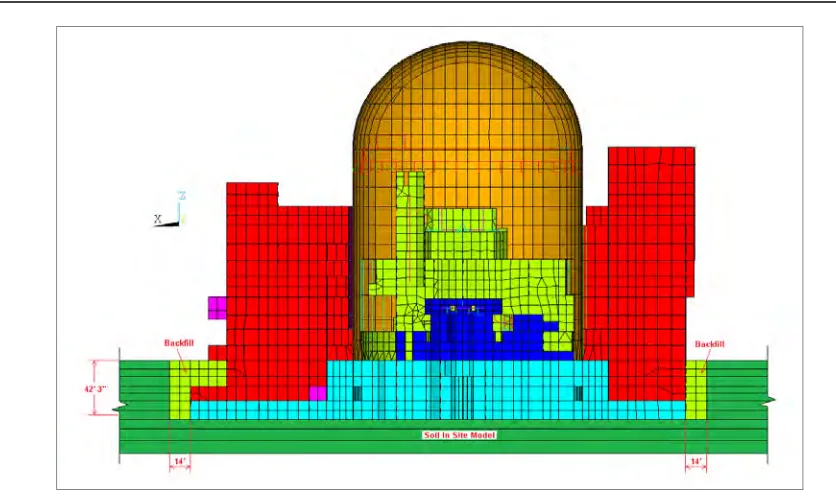
Figure 4 RBC Model Sectional View, Section through the Center Line (looking to the West)
a) b)
Figure 5 RBC Model Isometric Views a) Structural Model b) Excavated Volume
Based on the SASSI formulation, excavated volume is part of the model that represents the free soils replaced by the basement of the structure. Figure 5b and Figure 7b present the excavated volume models for the RBC SSI model and RBC-TB SSSI model, respectively. Brick Solid Elements are used to represent the excavated soils. The TB foundation level is about 15 feet higher than RBC foundation level. Two layers of solid elements are added in the model below the TB foundation to simulate the free field soils in order to create an excavated volume for the RBC-TB SSSI model with a leveled bottom. The corresponding free field soil strain compatible properties are assigned to the two layers of soil elements.
Modified Subtraction Method (MSM). As a result, the excavated volume soil elements share the same mesh size as the structural elements below the plant grade. For RBC model and the RBC portion of the RBC-TB integrated model, at the bottom of the foundation level, the mesh size in the horizontal direction ranges from 6.0 to 9.0 feet, with an average of 6.62 feet in the NS direction and 7.32 feet in the EW direction. In the vertical direction, excavated soil volume mesh sizes are consistent with the soil layering whose thickness varies from 5.38 to 7.00 feet. The excavated volume vertical meshes of the TB portion match the RB portion. In the TB portion, the excavated volume has a nominal horizontal mesh size of 13 ft. The purpose of SSSI analysis is to investigate the effect of the presence of the TB on the RBC. The larger horizontal mesh size in the TB portion is acceptable.
Figure 6 RBC-TB Model Sectional View, Section through the Center Line (looking to the East)
a) b)
Figure 7 RBC-TB Model Isometric Views a) Structural Model b) Excavated Volume
The SSI analysis of the standalone embedded RBC model and SSSI analysis of the embedded RBC-TB integrated model are performed using ACS SASSI program (Ghiocel, 2012). Two levels of the stiffness for the concrete members are considered for the structural models. The full stiffness (Uncracked) models assign the concrete components with uncracked stiffness and OBE damping values while the reduced stiffness (Cracked) model usually uses half of the uncracked concrete stiffness, and SSE damping values. The comparisons of seismic responses are made for the soil cases 270-200, 560-500, 900-100 and 900-200, which result in a total number of sixteen (16) analysis cases in this study; two structural models combined with four soil profiles, and SSI and SSSI analyses.
The Modified Subtraction Method is used in this study. The exterior surface nodes of the excavated volume are specified as the interaction nodes as required by the MSM (Gutierez, 2011). The numbers of interaction nodes are 7870 and 9648 for the SSI and SSSI model, respectively. To ensure that the method used reasonably captures the dynamic response of the soil structure system, the transfer functions at various locations of interest throughout the RBC are reviewed for anomalies. This review indicates that MSM is a robust method for the models investigated in this paper.
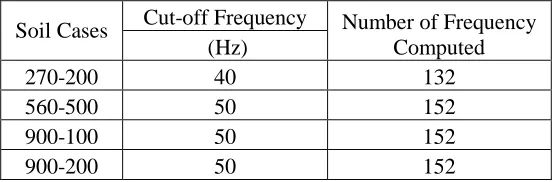
Transfer functions are also reviewed to ensure that the transfer functions are well defined over the frequency range of interest, i.e., they are computed at a satisfactory number of frequency points. In addition, interpolated transfer function curves at characteristic nodes are inspected to ensure no spurious peaks are present. Table 1 presents cut-off frequencies and number of frequency computed for each of the soil cases for both the RBC and RBC-TB models.
Table 1 Computed Frequency
Soil Cases Cut-off Frequency Number of Frequency
Computed (Hz)
270-200 40 132
560-500 50 152
900-100 50 152
900-200 50 152
The three components of the earthquake are applied to the models separately and the solutions are superimposed to provide the solution for combined S- and P-wave excitations later to all nodes. The vertically propagating S-waves represent the two horizontal components of the design earthquake motion H1 and H2 that are applied in NS and EW direction, respectively. The vertical component of the design earthquake (V) is represented by vertically propagating P-waves. The same set of seismic input motions for each of the soil cases are considered for the RBC SSI and RBC-TB SSSI analyses. The SSI and SSSI analyses use within motions at the bottom of the RB complex as control motions.
To ISRS from the three-component earthquake for this investigation, the Square Root of the Sum of the Squares (SRSS) method is used to combine response spectrum ordinates from each of the three excitations.
RESULTS AND DISCUSSION
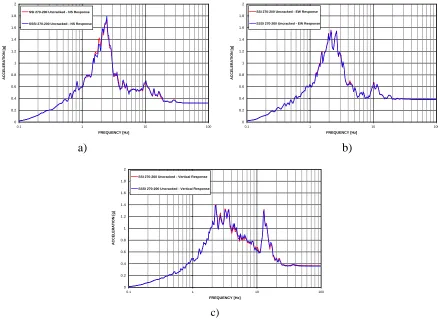
SW. Results for 270-200 soil case with uncracked model, and envelope of the four soil cases are presented. In the figures, SSSI responses are denoted as red solid lines while SSI as blue solid lines.
0 0.2 0.4 0.6 0.8 1 1.2 1.4 1.6 1.8 2
0.1 1 10 100
FREQUENCY [Hz] ACCE L E RAT IO N [ g ]
SSI 270-200 Uncracked - NS Response
SSSI 270-200 Uncracked - NS Response
0 0.2 0.4 0.6 0.8 1 1.2 1.4 1.6 1.8 2
0.1 1 10 100
FREQUENCY [Hz] ACCE L E RAT IO N [ g ]
SSI 270-200 Uncracked - EW Response
SSSI 270-200 Uncracked - EW Response
a) b)
0 0.2 0.4 0.6 0.8 1 1.2 1.4 1.6 1.8 2
0.1 1 10 100
FREQUENCY [Hz] ACCE L E RAT IO N [ g ]
SSI 270-200 Uncracked - Vertical Response
SSSI 270-200 Uncracked - Vertical Response
c)
Figure 8 270-200 Response at RVS, a) NS Direction b) EW Direction c) Vertical Direction
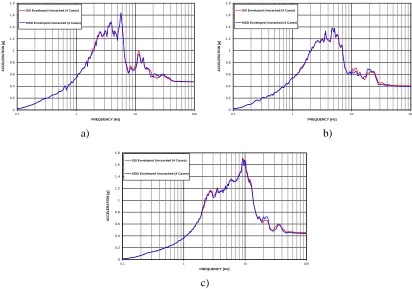
It is observed from comparison results of ISRS at various locations that
• The similar effects of SSSI are shown for the models with cracked and uncracked stiffness. • For the locations in RBC remote from the TB, the SSSI effect tends to slightly reduce the
amplitude of the response due to input from NS direction. The NS direction is parallel to the direction that is defined by the two foundations, as indicated in Figure 8a and Figure 9a. The responses to the EW direction input are practically the same for the SSI and SSSI analyses. Negligible differences are observed as shown in Figure 8b and Figure 9b. This observation also applies to the vertical response as shown in Figure 8c and Figure 9c.
0 0.5 1 1.5 2 2.5 3
0.1 1 10 100
FREQUENCY [Hz]
ACCE
L
E
RAT
IO
N [
g
]
SSI Enveloped Uncracked (4 Cases)
SSSI Enveloped Uncracked (4 Cases)
a) b)
c)
Figure 9 Enveloped Response at RVS, a) NS Direction b) EW Direction c) Vertical Direction
a)
0 0.2 0.4 0.6 0.8 1 1.2 1.4
0.1 1 10 100
FREQUENCY [Hz]
ACCE
L
E
RAT
IO
N [
g
]
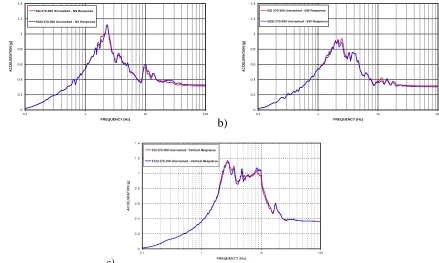
SSI 270-200 Uncracked - NS Response
SSSI 270-200 Uncracked - NS Response
b)
0 0.2 0.4 0.6 0.8 1 1.2 1.4
0.1 1 10 100
FREQUENCY [Hz]
ACCE
L
E
RAT
IO
N [
g
]
SSI 270-200 Uncracked - EW Response
SSSI 270-200 Uncracked - EW Response
c)
0 0.2 0.4 0.6 0.8 1 1.2 1.4 1.6 1.8
0.1 1 10 100
FREQUENCY [Hz] ACCE L E RAT IO N [ g ]
SSI Enveloped Uncracked (4 Cases)
SSSI Enveloped Uncracked (4 Cases)
0 0.2 0.4 0.6 0.8 1 1.2 1.4 1.6 1.8
0.1 1 10 100
FREQUENCY [Hz] ACCE L E RAT IO N [ g ]
SSI Enveloped Uncracked (4 Cases)
SSSI Enveloped Uncracked (4 Cases)
a) b)
0 0.2 0.4 0.6 0.8 1 1.2 1.4 1.6 1.8
0.1 1 10 100
FREQUENCY [Hz] ACCE L E RAT IO N [ g ]
SSI Enveloped Uncracked (4 Cases)
SSSI Enveloped Uncracked (4 Cases)
c)
Figure 11 Enveloped Response at SW, a) NS Direction b) EW Direction c) Vertical Direction
CONCLUSION
Structure-soil-structure interaction effects of US-APWR standard plant buildings, RBC and TB are investigated through dynamic coupling analysis of the soil structure system. The analyses consider foundation embedment effect by directly analyzing the structures as embedded structures. Representative soil profiles from soft soil to rock are analyzed. The effects on RBC are reviewed in terms of response spectra at various characteristic locations and compared to the one obtained from RBC standalone soil structure interaction analysis. The total seismic weight of the RBC (1,280,000 kips) is approximately four times the seismic weight of the TB (330,000 kips) and the foundation bottom level of the TB is about 15 feet higher that of the RBC. The study results indicate that, for soil profiles and structural models analyzed, some minor but insignificant effects are observed for the response of the NS direction, which is parallel to the direction defined by the two foundations and the effects are stronger when the locations are closer to the TB. It is concluded that the SSSI effects of the TB on the RBC in terms of ISRS at characteristic locations are insignificant.
REFERENCES
Ghiocel, D.M. (2012). “An Advanced Computational Software for 3D Dynamic Analyses Including Soil Structure Interaction”, ACS SASSI Version 2.3.0, Including Options A and FS, Ghiocel Predictive Technologies, Inc., User Manuals, Installation Kit Revision 4, July, 2012