R E S E A R C H
Open Access
A fusion optimization algorithm of network
element layout for indoor positioning
Xiao-min Yu
1,2, Hui-qiang Wang
1*, Hong-wu Lv
1, Xiu-bing Liu
1and Jin-qiu Wu
1Abstract
The indoor scene has the characteristics of complexity and Non-Line of Sight (NLOS). Therefore, in the application of cellular network positioning, the layout of the base station has a significant influence on the positioning accuracy. In three-dimensional indoor positioning, the layout of the base station only focuses on the network capacity and the quality of positioning signal. At present, the influence of the coverage and positioning accuracy has not been considered. Therefore, a network element layout optimization algorithm based on improved Adaptive Simulated Annealing and Genetic Algorithm (ASA-GA) is proposed in this paper. Firstly, a three-dimensional positioning signal coverage model and a base station layout model are established. Then, the ASA-GA algorithm is proposed for optimizing the base station layout scheme. Experimental results show that the proposed ASA-GA algorithm has a faster convergence speed, which is 16.7% higher than the AG-AC (Adaptive Genetic Combining Ant Colony) algorithm. It takes about 25 generations to achieve full coverage. At the same time, the proposed algorithm has better coverage capability. After optimization of the layout of the network element, the effective coverage rate is increased from 89.77 to 100% and the average location error decreased from 2.874 to 0.983 m, which is about 16% lower than the AG-AC algorithm and 22% lower than the AGA (Adaptive Genetic Algorithm) algorithm.
Keywords:Non-Line of Sight (NLOS), K-Coverage, Fusion algorithm, Base station layout, Convergence rate
1 Introduction
Statistics show that about 80% of people’s living and working environment is indoors. The location service in the indoor environment plays an extremely important role in the control of objects in industrial production lines, location and navigation in public places, the care of young and old people, and intelligent entertainment [1, 2]. In order to improve the effective coverage of the indoor positioning signal and the indoor positioning ac-curacy, a reasonable base station layout is particularly important, which can improve the positioning accuracy while reducing the deployment cost.
Due to the NLOS of the indoor environment and the complexity of the indoor structure, the Global Position-ing System (GPS) is not available for indoor positionPosition-ing. Because indoor environment is complex, all sorts of electromagnetic wave can produce the change of signal characteristic because of reflex, refraction, and diffraction.
We can use this kind of characteristic change to realize indoor communication, indoor position, etc. Electro-magnetic (EM) waves with helical wave front carry or-bital angular momentum (OAM), which is associated with the azimuthal phase of the complex electric field. OAM is a new degree of freedom in EM waves and is promising for channel multiplexing in the communica-tion system [3, 4]. Currently, positioning technologies based on Bluetooth, WiFi [5], and UWB [6] can achieve good positioning effects, but lack a unified wide-area positioning network. In the coming 5G era, the integra-tion of communicaintegra-tion and navigaintegra-tion networks of het-erogeneous cellular networks is an important trend in indoor positioning [7, 8], which can provide communi-cation and positioning services at the same time avoid-ing additional resource overhead.
However, the complex of the indoor environment structure leads to signal loss, reflection, refraction, and diffraction and even the positioning terminal cannot be covered by multiple base stations at the same time, resulting in an increasement in positioning error or fail-ure to provide positioning requirements. In the 3D
© The Author(s). 2019Open AccessThis article is distributed under the terms of the Creative Commons Attribution 4.0 International License (http://creativecommons.org/licenses/by/4.0/), which permits unrestricted use, distribution, and reproduction in any medium, provided you give appropriate credit to the original author(s) and the source, provide a link to the Creative Commons license, and indicate if changes were made.
* Correspondence:[email protected]
1College of Computer Science and Technology, Harbin Engineering
University, Harbin, Heilongjiang province, China
positioning, the positioning terminal must ensure that the coverage of at least four base stations is received at the same time to satisfy the positioning condition. By properly arranging the layout of the base station, the number of the first path received by the terminal can be effectively improved, thereby improving the positioning accuracy.
The main contributions of this paper are:
Presents an indoor positioning base station layout optimization method based on ASA-GA, which taking the two factors—positioning signal coverage ratio and positioning accuracy—into consideration to optimize the base station layout scheme.
Takes the improved adaptive genetic algorithm as the main body of the algorithm, and integrates the improved simulated annealing mechanism to further adjust and optimize the population, so can improve the convergence speed and optimization quality of the algorithm.
The rest of this paper is organized as follows. Re-lated work is presented in Section 2. Section 3 de-scribes network element optimization layout model and ASA-GA algorithm. In Section 4, the simulation scenes are described. In Section 5, the performance evaluation of the ASA-GA algorithms in terms of sig-nal coverage, positioning error, and iteration number is given. Finally, Section 6 gives conclusions and out-lines the future work.
2 Related works
The positioning accuracy can be improved from two aspects. The first one is to place the base station so that each point of the positioning area is covered by at least 4 base stations at the same time. The second is to reduce the GDoP (Geometric Dilution of Preci-sion), thereby reducing the average positioning error of the space [9]. The location selection of base station in space is always regarded as NP-hard problem [10]. Finding the best base station layout scheme is still challenging, even if the search space is roughly repre-sented, the enumeration search is invalid [9]. There-fore, this type of problem only solves approximate or suboptimal solutions [11]. Heuristic algorithm can im-prove the search speed [12]. The existing base station layout algorithm can be divided into two base station layout optimization methods based on random geom-etry and heuristic search.
In terms of random geometry, Bais et al. [9] laid out indoor base stations in a square shape, which solved the problem of signal coverage and improved the positioning error. However, the irregularity of buildings makes all base stations have a square layout difficulty. In literatures
[13–16], many existing methods consider the localization performance of one or several specific points. Andrews et al. [17] model the layout of a cellular network using a homogeneous Poisson point process. The scenario model-ing of the base station location in the cellular network means that the deployed base stations are completely in-dependent of each other. The work of Zhou et al. [18] is an extension of these methods. They studied placing four base stations in a rectangular area, and research on posi-tioning performance and effect. A solution based on Monte Carlo simulation is proposed for the difficulty of problem analysis. It is also confirmed by Chen et al. [19] that the optimal placement of the four base stations is rectangular.
Base station layout intelligent algorithm based on heuristic search is more adaptable and easily to model [20]. Zhang et al. [21] proposed a solution based on Sim-ulated Annealing (SA) algorithm, but the initial value of “temperature” and the rate of decline in the simulated annealing algorithm need to be repeated several times to determine. Pereira et al. [22] used the particle swarm optimization algorithm based on the idea of group intel-ligent optimization to apply to the base station optimization problem, which is easy to modify the ob-jective function, and can be implemented in parallel with good scalability. However, because the population loses more diversity information in the search space, it is easy to fall into the local optimal solution. Meng et al. [23] proposed the introduction of the Pareto optimal domain based on the traditional genetic algorithm (GA) layout scheme, and proposed a high-performance NSGA-II al-gorithm. This algorithm is a heuristic search algorithm and is also easily rewritten as a parallel processing version.
into local optimal solution and then generate the final network element layout. The average error after two steps’ optimization is significantly improved compared with that before fusion. But this approach is simply a splicing of two algorithms, and the convergence speed of the algorithm is not significantly improved. Ghar-ghan et al. [26] proposed hybrid Particle Swarm Optimization-Artificial Neural Network (PSO-ANN). This algorithm adopts the feedforward neural network model and uses the Levenberg-marquardt training al-gorithm to estimate the distance between the moving node and the anchor node. Although the positioning accuracy is improved, the training of feedforward neural network needs a lot of samples; otherwise, it cannot converge to the global minimum or the local minimum with good enough. In terms of continuous optimization, Ying Gao et al. [27] first introduced the idea of annealing particle swarm optimization. This algorithm combines the advantages of PSO algorithm, such as global optimization ability, fast calculation speed and simple implementation, and the simulated annealing algorithm’s ability to jump out of local op-timal solution. It avoids the disadvantage of PSO
fall-ing into local extremum and improves the
convergence speed of PSO at the later stage of evolu-tion. Zhang et al. [28] proposed a hybrid simulated annealing genetic optimization algorithm in order to improve the convergence speed of the genetic rithm. In the early stage, the standard genetic algo-rithm was adopted for optimization, and the optimized results of the genetic algorithm were annealed. Although the algorithm improved the posi-tioning accuracy, it cannot converge to the extreme point in the later stage, which makes the algorithm unstable.
3 Method
According to the needs of positioning, this paper opti-mizes the location of multiple network elements in space to ensure the coverage of positioning signals and im-prove the positioning stability and accuracy of terminals. Firstly, the optimization model of the network element is established, and the optimization problem of the net-work element layout is transformed into simple discrete optimization problem. Then, according to the model and the disadvantages and advantages of the single algo-rithm, an improved adaptive genetic annealing fusion optimization algorithm is proposed. This algorithm takes the improved AGA as the main body of the algorithm, and integrates the improved simulated annealing mech-anism to further adjust and optimize the population, so can improve the convergence speed and optimization quality of the algorithm.
3.1 Network element optimization layout model
Signal coverage in indoor location is an important indi-cator. In the three-dimensional (3D) indoor positioning, the to-be-positioned point receives at least four network element transmission signals, which can be regarded as effective coverage. The 3D indoor space is modeled using the probing model and K-coverage [11, 29], and the spatial positioning signal coverage is finally calcu-lated. The Euclidean distance is used to solve the posi-tioning error of each terminal, and the minimum positioning error is taken as the objective function of optimization.
3.1.1 3D coverage rate model
Detecting Model
There areNnetwork elements, and the coordinates of the ith network element are set to Ai(xi,yi,zi), i= (1, 2,
...,N). Set the detection radius of the network element Ai(xi,yi,zi) asri. Then, the detection area of the network
element is the spherical area with the radius ri, where
the location of the network element Aiis located at (xi,
yi,zi).
Vi:ðx−xiÞ2þðy−yiÞ2þðz−ziÞ2≤ri2 ð1Þ
Vi is the coverage detection region of the network
elementAi, that is, the effective region is denoted asVei.
The region other than Vi is the undetectable region of
the network element Ai. Set the target 3D space region
asV, then the effective regionVei=Vi∩V.
Let network element layout is S, then S= (A1,A2,A3,
...,AN). The detection area of each network element is
Vi, i= (1, 2, ...,N), and the total detection area of N
net-work elements is ∪Ni¼1Vi. The effective detection area of each network element is set to Vei, i= (1, 2, ...,N), then
Vei=Vi∩V. Set the effective total detection region ofN
network element as∪Ni¼1V ei.
K-coverage method
The ranging-based 3D positioning algorithm receives at least four network element signals at the same time. In this case, K-coverage effective positioning point is used, that is, K≥4 is the effective coverage; otherwise, there is coverage vulnerability. For the irregularities of complex and diverse indoor space shapes, this paper uses the cube segmentation method to segment the loca-tion region.
j= (1, 2, ...,M), and replace the small cube area with the cube center. Therefore, the coverage of the network element for each small cube can be approximated as the coverage of the cube center Bj(xj,yj,zj). S is used for a
network element layout, S= (A1,A2,A3, ...,AN) and the
network element coordinates are Ai(xi,yi,zi), i= (1, 2, ...,
N).When (xi−xj)2+ (yi−yj)2+ (zi−zj)2≤ri2, Bj is
consid-ered to be covconsid-ered by network element Ai. Let the
vari-able Kij denote the case where Bj is covered by the
network element Ai, wherej= (1, 2, ...,M),i= (1, 2, ...,N).
Then, the expressionKijis shown in (2):
Kij¼ f
According to the definition of K-coverage, the cover-age number of the target node Bj is Kj, and the target
node Bj is overwritten by the network element Kj. The
expression ofKjis as shown in Formula (3):
Kj¼ XM
i¼1
Kij ð3Þ
In indoor positioning, each node to be located should be covered by at least four network elements. Let, the variable Ej indicate whether point Bj is effectively
cov-ered. While the value of Ejis equal to 1, that means the
pointBjis effectively covered, vice versa. The expression
ofEjis shown in (4):
Ej¼ f1 Kj≥4
0 Kj<4 ð4Þ
The area coverage expression under the network elem-ent layoutSis shown in formula (5):
used for the coordinates of the ith network element, wherei= 1, 2, ...,N. M nodes are collected to represent the users in the indoor environment, the coordinate of thejth user isBj(xj,yj,zj) and the measurement
coordin-ate of thejth user is Bj∧ðx∧j;yj ∧
;z∧jÞ. It is assumed that the positioning probability of each positioning node is the same. DefineS″, P, and ^P as (A1,A2,A3, ...,AN),(B1,B2, ...,
BM), andðB^1;B^2; :::;B^MÞ.Srepresents the layout scheme of N network elements, P denotes the position of all
points of Musers in the indoor environment while P^ is the measurement position.
In the case of network element layout S, the average positioning error of M users in the indoor environment is:
f Sð Þ ¼M1 XM
j¼1
Errojð ÞS ð6Þ
f(S) is used for the average positioning error. In the indoor positioning, it is determined whether each positioning point receives signals of at least 4 network elements at the same time by determining whether the value ofEthat corresponds to each user is 1. When the user’sEvalue is 1, the positioning accuracy is maximized, where Erroj(S) is used for the
positioning error of thejth user [22].
By measuring the distance between the network elem-ent and the user, the positioning accuracy is calculated, and the layout of the network element is evaluated, fi-nally obtain the optimized layout results.
3.2 ASA-GA algorithm design
3.2.1 Design of the adaptive simulated annealing (ASA) algorithm
Simulated annealing algorithm is a common heuristic al-gorithm whose performance largely depends on its com-ponents and parameters. It mainly includes the methods of generating new states, the design of cooling control function, and the termination conditions of the algo-rithm [30]. The traditional simulated annealing algo-rithm is used in the open-loop control mode, so the neighborhood search results have no feedback effect on the annealing process. This paper presents a fast adap-tive simulated annealing algorithm, which adopts closed-loop feedback control to combine the neighborhood search and temperature control by selecting appropriate methods and algorithm termination conditions for gen-erating new states. The algorithm can dynamically deter-mine the temperature parameters and the changes in the number of different neighborhood searches. The specific process after improvement is as follows:
T kð Þ ¼T0αk1=2
ð7Þ
where T0 is the initial temperature, and k is the
temperature drop coefficient.
LetPbe the state transition probability, indicating the probability of going from one base station S to another base station layoutS′, related to the current temperature parameter Ti, whereTi representing the temperature of
theith iteration, expressed as:
P¼ f1; f Sð Þ0 ≤f Sð Þ
exp½f Sð Þ−f Sð Þ0 =Ti; f Sð Þ0 > f Sð Þ ð8Þ
Since using the simulated annealing algorithm solves the new solution in the neighborhood area of the current solution, to ensure that the individual of the new solution does not exceed the boundary, the boundary station number q' in the new solution is converted as follows:
where qleft and qright are respectively the minimum
and maximum of the base station number, ε is the random number between (0, 1). U(0, 1) is the control value of randomly selecting 0 or 1, δ(Ti) is the
dis-turbance quantity, which decreases with the decrease of Ti, and finally with δ(Ti)→0 the algorithm
converges.
3.2.2 Design of the adaptive genetic algorithm with annealing thought
Fitness function
The goal of the network element optimization layout is to improve the positioning accuracy, that is, the posi-tioning error of the point to be located is the smallest. Therefore, the population fitness function can be expressed as Eq. (6).
Selecting operation
In the optimization of network element layout based on adaptive genetic algorithm, the selection operation is to select a good individual from the population, where the probability of individuals being selected is expressed as:
Pk¼1−Xnfk
i¼1
fi
ð10Þ
In which,Pkis the probability that the population
indi-vidual Sk is selected, and fi is the fitness function of
population individualSk.
Adaptive selection of crossover operators
This paper makes the following adaptive improve-ments for crossover probabilities:
wherefavgrepresents the average fitness value of all
indi-viduals in the population, and fmin represents the
mini-mum fitness value of individuals in the population, that is, the minimum positioning error under the network element layout. f′ is used for the fitness value of the current network element layout, that is, the average po-sitioning error under the current network element lay-out. It can be seen from formula (11) that the smaller the value offavg−fminis, the closerfavgis tofmin, and the
more the layout of network elements is to the optimal solution. According to the network element optimization scenario, network element layout individuals with lower fitness are assigned lower pc, is conducive to the
preser-vation of good individuals. On the contrary, network element layout individuals with higher fitness are assigned larger pc. The crossover probability of
individ-uals is not only determined by favg−fmin, the closer favg
is tofmin, the smaller the error caused by network
Adaptive selection of mutation operators
According to the adaptability of the current network element layout and the average fitness of the entire population, the adaptive mutation probability is selected. If the current layout fitness is greater than the average fitness, the mutation probability is smaller. On the con-trary, the mutation probability is larger. The adaptive mutation probability formula is as follows:
pm¼ f
k3
f0 −fmin
favg−fmin ;
f0 ≤favg
k4 ; f 0
>favg
ð12Þ
The purpose of improving the adaptive genetic algo-rithm is to prevent GA from falling into the local optimal solution. The algorithm uses the network element layout below the average fitness to find the optimal solution in the indoor positioning space. The network elements lay-out in this situation needs to be completely disrupted, so the value ofk4is set as 0.5, similarly, the value ofk3is also set as 0.5. Setk1=k2= 1.0 at the same time.
3.2.3 ASA-GA algorithm
The genetic algorithm can find an optimal solution from the whole, but it may fall into a local optimum, which can be avoided by the simulated annealing algorithm. In view of the shortcomings of slow convergence and poor quality of single intelligent optimization algorithm, a network layout ASA-GA optimization algorithm is proposed. The algo-rithm firstly adaptively improves the simulated annealing algorithm and the genetic algorithm. Secondly, the adaptive genetic algorithm is used as the optimization body of the ASA-GA algorithm. In addition, annealing mechanism is added into the adaptive mutation operation. The specific steps of ASA-GA algorithm fusion are as follows:
Set the initial value of the algorithm’s parameters, including population sizen, the number of
reproductive generationsG, crossover probabilitypc
and mutation probabilitypm, and theT0andkvalue
of simulated annealing algorithm, and set an generation numberTg.
Calculate the fitness of the individuals in the generated population, and record the optimal individuals, select the paired individuals according to Eq. (10) Perform the adaptive crossover and mutation operations on the individuals using Eqs. (11) and (12). The fitness of each individual in the newly generated population was calculated, and the individual with high fitness value was selected for the transfer step III to conduct annealing optimization gene operation.
Let us make the cycle counter of simulated annealing algorithmt, the simulated annealing operation is performed on the individuals with high fitness in the new population and optimize
individual genes. Calculate the disturbance value according to (8). The probability is accepted according to the formula (9). If accepted,t = t + 1, otherwise,tremains unchanged. The individuals with the least fitness in the population were replaced with the layout results after annealing.
If the reproductive generation numberTgis less
thanG, thenTg=Tg+ 1, return II, otherwise, end
the optimization process and output the result of base station layout.
4 Simulation experiment
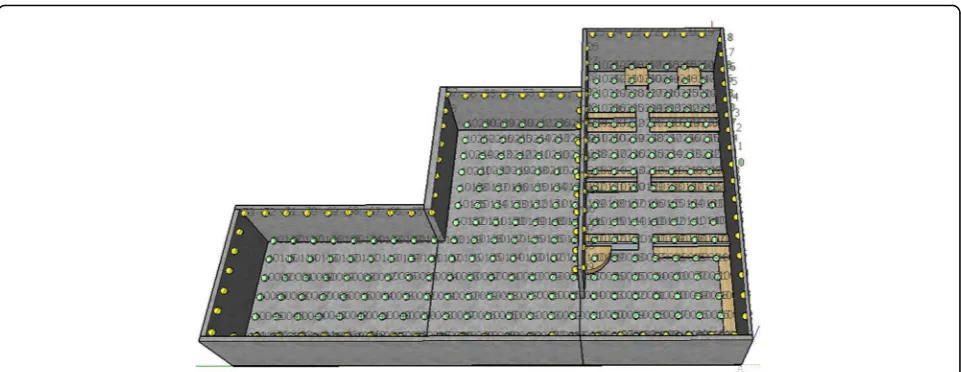
In the simulation experiment of network element layout, the experimental scene was set as a “double L” region, with a total length of 24.1 m and a width of 17.8 m. Ac-cording to the actual situation, for the sake of simplicity, in the layout of the network element, select 3 m from the ground height to divide the 1 m × 1 m grid. Due to the large number of multipath generated in the deployment of ceiling elements, the positioning error is greatly reduced. Therefore, the paper select a location near the wall as the deployment of base station, a total of 102 locations for network deployment. The selected position of the terminal is 1.2 m away from the ground, and the 3D grid of 1 m × 1 m × 1 m is divided. Two hundred sixty-four terminals are located at the center of gravity of the grid. The test scenario is shown in Fig. 1. The yellow dot indicates the network element location to be installed and the green dot indicates the user terminal location.
Before the simulation analysis, the parameters of the ASA-GA fusion algorithm are initialized. In the experi-mental simulation, eight network elements are pre-installed in the positioning area. Both the simulated an-nealing algorithm and the ant colony algorithm are iter-ated for 50 times. The population of genetic algorithm is set as 50, the genetic times are set as 50, and the number of ants of ant colony algorithm is set as 50. The algo-rithm parameter settings are shown in Table1.
5 Results and discussion
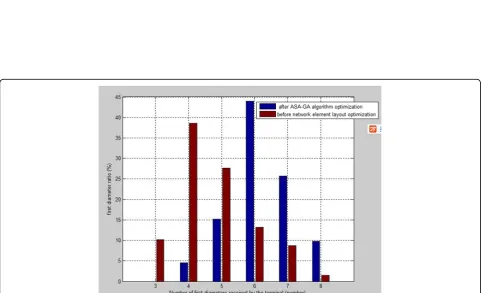
diameter coverage of the positioning area after the layout optimization of network elements is shown in Fig. 2.
According to the coverage of the first diameter in Fig.2, the number of the first diameter is mainly 5~7. Compared with the positioning signal coverage before the layout optimization of the network element, the coverage rate statistical diagram is shown in Fig.3.
It can be seen from the above figure that before the network element layout is optimized, the effective posi-tioning signal coverage rate of that the first diameter (i.e., direct arrival signals) number is greater than or equal to 4 is about 90%, and about 10% of the signal coverage holes exist. After adopting the ASA-GA fu-sion optimization algorithm proposed in this paper, the positioning signal coverage rate reaches 100% coverage, and the number of first diameter is mainly distributed from 5 to 7. Through the experiment, the change of positioning accuracy before and after the layout of the network element is obtained, and the positioning accuracy is obviously improved with the increase of the coverage rate. The changes in
coverage rate and positioning accuracy before and after optimization are shown in Table 2.
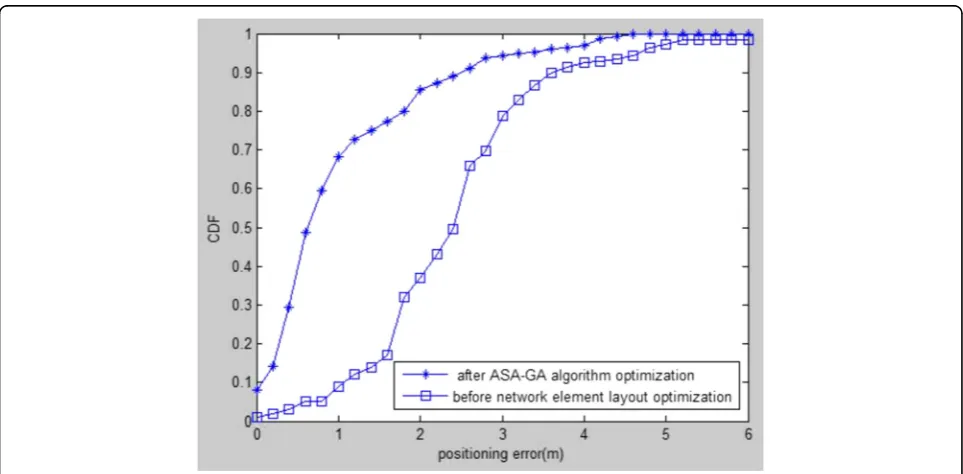
After the optimization of network elements layout, the ef-fective positioning signal coverage rate increased from 89.77 to 100%, the coverage rate increased by 10.23%, and the average positioning error decreased from 2.874 to 0.983 m. According to the cumulative distribution of positioning er-rors before and after network element layout optimization shown in Fig. 4, the number of terminals with positioning errors within 1 m accounts for about 68% of the total, and the number of terminals with positioning errors within 2 m accounts for about 85%. The ASA-GA algorithm’s position-ing accuracy and coverage rate have been significantly im-proved, which proves the effectiveness of the ASA-GA hybrid optimization algorithm proposed in this paper.
Comparing the proposed ASA-GA fusion optimization algorithm with the AGA and AG-AC joint optimization algorithm proposed in [25], the cumulative error distri-bution of the three algorithms is shown in Fig. 5. After the optimization of ASA-GA fusion algorithm, the posi-tioning error of target nodes within 3 m accounts for about 94% of the total, within 2 m accounts for about Fig. 1Simulation optimization scenario. In the simulation experiment of network element layout, the experimental scene was set as a“double L” region, with a total length of 24.1 m and a width of 17.8 m. According to the actual situation, select 3 m from the ground height to divide the 1 m × 1 m grid. A location near the wall was selected as the deployment of base station, a total of 102 locations for network deployment. The selected position of the terminal is 1.2 m away from the ground, and the 3D grid of 1 m × 1 m × 1 m is divided. Two hundred sixty-four terminals are located at the center of gravity of the grid. The yellow dot indicates the network element location to be installed and the green dot indicates the user terminal location
Table 1Algorithm parameter settings
Population quantity Ant quantity Genetic times Iteration times
ASA-GA 50 ---- 50 50
AG-AC 50 50 50 50
---Fig. 2The first diameter coverage. In the above positioning scenario, there are 8 optimal deployment positions number of network elements, namely, 16, 29, 33, 43, 81, 88, 95, 98. The number of the first diameter that the user terminal received is represented by the digit of
corresponding location
85%, and within 1 m accounts for about 68%, which is about 16% better than that of AG-AC algorithm and 22% better than AGA algorithm.
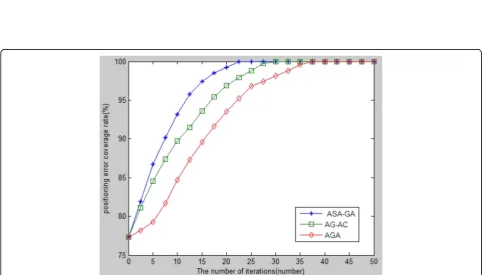
The variation of positioning signal coverage during the optimization of the three algorithms is shown in Fig. 6. Experimental results show that ASA-GA fusion algo-rithm needs to be inherited for 25 generations, AG-AC algorithm needs to be inherited for 30 generations, and AGA needs to be propagated for 38 generations to achieve full coverage.
6 Conclusion
Due to the complexity and the characteristics of non-line-of-sight of indoor scene, in the application of cel-lular network positioning, the influence of indoor three-dimensional positioning signal coverage and po-sitioning accuracy has not been considered in the base station deployment. This paper proposes an adaptive genetic algorithm based on fusion annealing indoor positioning base station layout method. This algorithm adopts an adaptive way to control crossover and
mutation probability, avoids sharp rise and fall, and makes the crossover and mutation operations tend to be stable, thus ensuring the stability of the algorithm, improving the convergence speed, and the simulating annealing mechanism is integrated into the internal genetic algorithm, which overcomes the shortcomings of falling into the local optimal solution. Through simu-lation experiments, the positioning accuracy of the ASA-GA algorithm is more than 80%. Compared with AG-AC and AGA algorithms, within 2 m, the performance is im-proved by about 12% and 21%, respectively. The conver-gence rate is significantly improved compared with the above algorithms, and the localization signal coverage rate is significantly improved compared with AGA algorithm.
In the future, we will further study the influence of multipath in positioning, minimize the multipath effect in combination with multi-objective optimization, prop-erly compensate the attenuated positioning signal in positioning, and analyze the specific factors that influ-ence the positioning accuracy caused by multipath effect.
Table 2Changes before and after optimization of network element layout
Before network element layout optimization After ASA-GA algorithm optimization
Average positioning error 2.874 m 0.983 m
Location signal coverage rate 89.77% 100%
Fig. 6Comparison of convergence of the three algorithms. The green curve with squares represents after AG-AC algorithm optimization, the curve with stars represents after ASA-GA algorithm optimization, and curve with diamonds represents after AGA algorithm optimization
Fig. 5Three optimization algorithms positioning error accumulation distribution diagram. The curve with circles represents after AG-AC algorithm optimization, the curve with stars represents after ASA-GA algorithm optimization, and the curve with crosses represents after AGA
Abbreviations
NLOS:Non-line of sight; ASA-GA: Adaptive Simulated Annealing and Genetic Algorithm; AG-AC: Adaptive Genetic Combining Ant Colony; AGA: Adaptive Genetic Algorithm; GPS: Global Positioning System; EM: Electromagnetic; OAM: Orbital angular momentum; WiFi: Wireless Fidelity; UWB: Ultra wide band; 5G: Fifth generation; 3D: Three-dimensional; GDoP: Geometric Dilution of Precision; NP: Non-deterministic polynomial; PSO-ANN: Particle Swarm Optimization - Artificial Neural Network; PSO: Particle swarm optimization
Authors’contributions
XMY contributed in investigation, methodology, draft manuscript writing, manuscript reviewing, and editing. HQW contributed in the overall design and network element optimization layout model. HWL contributed in the design of models and algorithms, reviewing and editing the manuscript, and funding acquisitions. XBL contributed in software and hardware development, simulations, result analysis and reviewing and editing the manuscript. JQW contributed in reviewing and editing the manuscript. All authors read and approved the final manuscript.
Funding
This research was funded by 3 foundation items: National Natural Science Foundation of China (No. 61872104 and 61901134), the National Science and Technology Major Project of China (No. 2016ZX03001023-005), and Basic business project in education department of Heilongjiang province of China (No. 135109243).
Availability of data and materials
The datasets used and analyzed during the current study are available from the corresponding author on a reasonable request.
Competing interest
The authors declare that they have no competing interests.
Author details
1College of Computer Science and Technology, Harbin Engineering
University, Harbin, Heilongjiang province, China.2College of Computer and Control Engineering, Qiqihar University, Qiqihar, Heilongjiang province, China.
Received: 15 July 2019 Accepted: 11 November 2019
References
1. Zhou M, Zhang Q, Tian Z, et al. IMLours: Indoor mapping and localization using time-stamped WLAN received signal strength// Wireless Communications and NETWORKING Conference. IEEE, 2015:1817-1822. 2. M. Terán, J. Aranda, H. Carrillo, et al., IoT-based system for indoor location
using bluetooth low energy//Communications and Computing (COLCOM), 2017 IEEE Colombian Conference on. IEEE, 1–6 (2017)
3. M. Chen, L. Jiang, W. Sha, Ultrathin complementary metasurface for orbital angular momentum generation at microwave frequencies[J]. IEEE Trans Antennas Propagation65(1), 396–400 (2017)
4. Chen M , Jiang L J , Sha W. Detection of orbital angular momentum with metasurface at microwave band. IEEE Antennas Wireless Propagation Lett, 2017:1-1.
5. X. Zeng, W. Lin, A kind of improved fingerprinting indoor location method based on WiFi//AIP Conference Proceedings. AIP Publishing1864(1), 020052 (2017)
6. C. Yara, Y. Noriduki, S. Ioroi, et al., Design and implementation of map system for indoor navigation - an example of an application of a platform which collects and provides indoor positions// IEEE International Symposium on Inertial Sensors and Systems. IEEE, 1–4 (2015) 7. Z. Yifan, Z. Zhifeng, Towards 5G: heterogeneous cellular network
architecture design based on intelligent SDN paradigm. Telecommun Sci 32(6), 28 (2016)
8. J. Wu, Q. Gang, K. Pengbin, Emerging 5G multi-carrier chaotic sequence spread spectrum technology for underwater acoustic communication. Complexity (2018)
9. A. Bais, H. Kiwan, Y. Morgan, On optimal placement of short range base stations for indoor position estimation[J]. J. Appl. Res. Technol12(5), 886– 897 (2014)
10. S. Yang, F. Dai, M. Cardei, et al., On connected multiple point coverage in wireless sensor networks[J]. Int. J. Wireless Inf. Networks13(4), 289–301 (2006)
11. M. Hefeeda, M. Bagheri, Randomized k-coverage algorithms for dense sensor networks//INFOCOM 2007. 26th IEEE International Conference on Computer Communications. IEEE, 2376–2380 (2007)
12. Kalantari E, Yanikomeroglu H, Yongacoglu A. On the number and 3-D placement of drone base stations in wireless cellular networks//Vehicular Technology Conference (VTC-Fall), 2016 IEEE 84th. IEEE, 2016: 1-6. 13. I. Sharp et al.,“Eanalysis for positioning system design,”IEEE Trans. Vehicular
Technol58(7), 3371–3382 (2009)
14. N. Levanon,“Lowest GDOP in 2-D scenarios,”IEE Proc. Radar Sonar Novigation147(3), 149–155 (2000)
15. M.A. Spirito, On the accuracy of cellular mobile station location estimation. IEEE Trans Vehicular Technol50(3), 674–685 (May 2001)
16. C.-H. Chen, An arrival time prediction method for bus system. IEEE Internet Things J.10(5), 4231–4232 (2018)
17. J.G. Andrews, A.K. Gupta, H.S. Dhillon, A primer on cellular network analysis using stochastic geometry. arXiv preprint arXiv1604, 03183 (2016) 18. J. Zhou et al., Landmark placement for wireless localization in
rectangular-shaped industrial facilities. IEEE Trans Vehicular Technol59(6), 3081–3090 (Jul 2010)
19. Y. Chen et al., inThirrd Annual IEEE Communications Society Conference on Sensor and Ad Hoc Communications and Networks. A practical approach to landmark deployment for indoor localization (2006), pp. 365–373 20. C. Shijun, H. Wang, C. Dawei, et al., Base Station layout optimization
algorithm based on improved tabu search[J]. Comp Eng Sci40(02), 341–347 (2018)
21. H. Zhang, S. Zhang, W. Bu, A clustering routing protocol for energy balance of wireless sensor network based on simulated annealing and genetic algorithm. Int J Hybrid Inf Technol7(2), 71–82 (2014)
22. M.B. Pereira, F.R.P. Cavalcanti, T.F. Maciel, Particle swarm optimization for base station placement//Telecommunications Symposium (ITS), 2014 International. IEEE, 1–5 (2014)
23. Meng H, Long F, Guo L, et al. Cooperating base station location optimization using genetic algorithm//Control and Decision Conference (CCDC), 2016 Chinese. IEEE, 2016: 4820-4824.
24. J. Munyaneza, A. Kurien, Optimization of antenna placement in 3G networks using genetic algorithm[J]. Commun Inf Technol36(5), 70–80 (2009) 25. H. Wang, L. Xiubing, L. Hongwu, et al., Method of diamond supplement for
indoor micro base station placement. J Beijing Univ Posts Telecommun 41(1), 51–58, 87 (2018)
26. S.K. Gharghan, R. Nordin, M. Ismail, et al., Accurate wireless sensor localization technique based on hybrid PSO-ANN algorithm for indoor and outdoor track cycling[J]. IEEE Sensors J.16(2), 529–541 (2016)
27. Y. Gao, S.L. Xie, Particle swarm optimization algorithms based on simulated annealing. Comput Eng Appl40, 47–50 (2004)
28. Zhang Q, Wang J, Jin C, et al. Localization algorithm for wireless sensor network based on genetic simulated annealing algorithm//Wireless Communications, Networking and Mobile Computing, 2008. WiCOM'08. 4th International Conference on. IEEE, 2008: 1-5.
29. C. Liu, G. Cao, Spatial-temporal coverage optimization in wireless sensor networks[J]. IEEE Trans. Mob. Comput.10(4), 465–478 (2011)
30. Z. Hao, T. Ran, L. Zhi-yong, et al., A feature selection method based on adaptive simulated annealing genetic algorithm [J]. Acta Armam30(1), 81– 85 (2009)
Publisher’s Note