ABSTRACT
KIM, CHANG HYEUK. A Study of Monochromatic X-ray Area Beam for Application in Diffraction Enhanced Imaging. (Under the direction of Dr. Mohamed A. Bourham.)
A Study of Monochromatic X-ray Area Beam for Application in Diffraction Enhanced Imaging
by
Chang Hyeuk Kim
A dissertation submitted to the Graduate Faculty of North Carolina State University
in partial fulfillment of the requirements for the Degree of
Doctor of Philosophy
Nuclear Engineering
Raleigh, North Carolina
2007
Approved by:
Dr. Mohamed A. Bourham Dr. J. Michael Doster
Chair of Advisory Committee
ii
DEDICATION
iii
BIOGRAPHY
I was born on May 22, 1976 in GwangJu, South Korea. I grew up within Gwangju with
parents, Woo-Jeon Kim and Kyoung-Sook Beck, and my sister, Nu-Lee Kim. After my graduation from Gwnagju In-Sung high school, I started my college studies in 1994 at
Chosun University in Nuclear Engineering. I joined the Korean Air Force in 1995 for military service as a missile launcher operator in the Air Defense Artillery. After two and half years of
military service, I returned to school in 1998. I obtained my B.S. degree in 2002 then joined the graduate program in the Department of Nuclear Engineering at North Carolina State
University. I joined the x-ray research group in 2003 and earned M.S degree in 2004 on the study of an area x-ray source for Diffraction Enhanced Imaging for clinical and industrial
iv
ACKNOWLEGEMENTS
I would like to express my gratitude to Dr. Mohamed A. Bourham. He has been my
academic advisor and good example to me as a researcher. Without his kindly and sincere guidance, I could not complete this dissertation. I am also grateful to my committee members,
Dr. J. Michael Doster, Dr. Man-Sung Yim and Dr. David S. Lalush for their help and discussions. Dr. Doster has provided substantial help in the target heat management and
thermal analysis. I greatly acknowledge the help and support I received from the Department of Nuclear Engineering during the course of my study. Special thanks to Dr. Man-Sung Yim
v
TABLE OF CONTENTS
page
LIST OF FIGURES...ix
LIST OF TABLES...xii
Chapter 1 Introduction... 1
1 Diffraction Enhanced Imaging... 3
1.1 Synchrotron based DEI... 4
1.2 X-ray source based DEI... 5
2 Wide beam x-ray source... 5
2.1 Steering electron trajectories ... 6
2.2 X-ray flux ... 6
2.3 DEI Images... 7
2.4 Heat removal ... 7
References ... 8
Chapter 2 A wide-beam X-ray source suitable for diffraction enhanced imaging applications.... 9
1 Introduction ... 10
2 General Considerations ... 11
3 Filament-target Design ... 12
4 Simulation Considerations... 12
4.1 Electrostatics and Particle Trajectories Simulation ... 12
4.2 Thermal Analysis Simulation ... 13
4.3 Characteristic X-ray simulation... 13
vi
5.1 Electrons Distribution on the Target... 13
5.2 Target Thermal Loading ... 14
5.3 Output X-Ray Flux ... 16
6 Conclusions ... 17
Reference... 18
Chapter 3 Diffraction Enhanced Imaging simulation based on the area x-ray generator... 19
Abstract ... 19
1 Introduction... 20
2 General considerations... 20
2.1 DEI theory ... 20
2.2 Area x-ray beam generator ... 22
3 Method... 25
3.1 Monochromatized beam ... 26
3.2 X-ray optics on the phantom ... 28
3.3 Image plate ... 31
4 Image simulation results... 32
5 Conclusion... 35
References ... 36
Chapter 4 Focal area optimization of the wide beam x-ray source... 38
Abstract ... 38
1 Introduction... 38
2 General considerations... 39
vii
3.1 Design parts ... 40
3.2 Simulation options... 41
4 Results and discussion... 43
5 Conclusion... 49
Reference... 50
Chapter 5 Target thermal management simulation using inner jet cooling concept... 52
Abstract ... 52
1 Introduction... 53
2 General considerations... 54
2.1 Convective heat transfer coefficient ... 54
2.2 Critical heat flux ... 55
3 Nozzle design in the x-ray target... 56
3.1 Equivalent beam current... 58
4. Simulation results and discussion... 58
5. Conclusion... 62
Reference... 64
Chapter 6 Conclusions and Recommendations for Future Work... 66
1 Conclusion... 66
2 Recommendations for future work... 68
Appendices... 70
Appendix A. SIMION geometry code for electron trajectory simulation... 71
Appendix B. MCNP5 code for x-ray flux calculation... 72
viii
C.1 The DEI images based on the wide beam x-ray source ... 74
C.2 Function of DEI algorithm... 82
Appendix D. ANSYS simulation results... 83
D.1 Target design with Solidworks... 83
D.2 ICEM CFD result views for initial mesh and prism added mesh ... 84
D.3 ANSYS CFX result views ... 88
ix
LIST OF FIGURES
page
Figure 1 . 1 The general DEI experiment setup... 2
Figure 2 . 1 Illustration of the filament assembly... 12
Figure 2 . 2 Geometry of the stationary target showing the copper body and molybdenum layer... 12
Figure 2 . 3 Floating and non-floating filament configurations... 13
Figure 2 . 4 Electron trajectories with -60kVp focusing cup and filaments at -12Vp ... 14
Figure 2 . 5 Electron deposition distributions with -60kVp focusing cup and filaments at -12Vp ... 14
Figure 2 . 6 Electron trajectories with -60kVp focusing cup and filaments ... 14
Figure 2 . 7 Electron deposition distributions with -60kVp focusing cup and filaments ... 15
Figure 2 . 8 Target temperature distributions at 70 sec... 15
Figure 2 . 9 Target temperature distributions at 15 sec... 16
Figure 2 . 10 Maximum target surface temperatures up to 10 seconds ... 16
Figure 2 . 11 Maximum target surface temperatures up to 100 seconds ... 17
Figure 2 . 12 X-ray spectra with Be and Al window ... 17
Figure 3 . 1 The Rocking curve of Si[333] with 18 keV x-ray... 21
Figure 3 . 2 Narrow beam diffraction concept... 24
Figure 3 . 3 Wide beam diffraction concept ... 25
Figure 3 . 4 X-ray distribution from the point electron source at the maximum flux position... 27
Figure 3 . 5 Electron distributions on the target surface... 27
Figure 3 . 6 Phantom design ... 29
Figure 3 . 7 X-ray pathway inside of single cylinder object... 30
x
Figure 3 . 9 Electron distribution on the actual focal area... 33
Figure 3 . 10 Images based on the fixed electron distribution... 34
Figure 3 . 11 Images based on the different electron distribution ... 35
Figure 4 . 1 Filaments assembly design... 41
Figure 4 . 2 Schematic drawing of the floating and non floating filaments connection... 42
Figure 4 . 3 Electron trajectories from SIMION simulation... 44
Figure 4 . 4 Standard deviation and Peak-to-average ratio VS Inner filament voltage change ... 46
Figure 4 . 5 Standard deviation and Peak-to-average ratio VS Middle filament voltage change... 47
Figure 4 . 6 Electron trajectories from SIMION simulation... 48
Figure 4 . 7 Electron distribution on the target surface ... 48
Figure 5 . 1 Wide beam x-ray oxygen free target with layer of molybdenum... 56
Figure 5 . 2 Configuration of the impinging jet nozzle ... 57
Figure 5 . 3 Convective heat transfer coefficient... 57
Figure 5 . 4 Optimized jet nozzle design ... 58
Figure 5 . 5 ANSYS CFX results... 59
Figure 5 . 6 Maximum target temperature as a function of time ... 61
Figure 5 . 7 Coolant temperature at the stagnation point as a function of time... 61
Figure 5 . 8 Critical heat flux as a function of the coolant inlet velocity ... 62
Figure A . 1 Target body design... 83
Figure A . 2 Coolant channel design... 83
Figure A . 3 Isometric view of initial mesh ... 84
Figure A . 4 Side view of initial mesh ... 84
xi
Figure A . 6 Middle cut view of initial mesh ... 85
Figure A . 7 Side view of prism mesh added ... 86
Figure A . 8 Top view of prism mesh added ... 86
Figure A . 9 Middle cut view of prism mesh added... 87
Figure A . 10 ANSYS CFX PRE view ... 88
Figure A . 11 ANSYS CFX Solver view of the convergence history plot for Momentum and mass ... 88
Figure A . 12 ANSYS CFX Solver view of the convergence history plot for Heat transfer... 89
Figure A . 13 ANSYS CFX Solver view of the convergence history plot for Turbulence Quantities.. 89
Figure A . 14 Average outlet temperature with varying inlet velocity at 300 mA beam current ... 90
xii
LIST OF TABLES
page
Table 2 . 1 Parameters of the circular filaments ... 12
Table 2 . 2 Stationary target parameters and thermal properties... 13
Table 2 . 3 MCNP results with Al and Be window... 18
Table 3 . 1 Material properties of phantom material ... 28
Table 3 . 2 Fuji BAS 2500 Image plate data... 32
Table 4 . 1 Filaments data... 41
Table 4 . 2 First simulation results... 45
1
Chapter 1 Introduction
Diffraction Enhanced Imaging was initially proposed by Dean Chapman in 1998 [1],
followed by an experimental setup performed with the synchrotron radiation source at National Synchrotron Light Source in Brookhaven National Laboratory. The DEI experiment
has shown good contrast images at lower radiation dose for materials with small x-ray attenuation coefficient [2]. The features of the DEI method were considered as a new
imaging modality for clinical and industrial fields. In clinical application, it is mostly desired for mammography because of the lower exposure rate and the higher contrast images.
The DEI system adopts a very narrow x-ray energy range to make successful x-ray diffraction on the analyzer crystal. A monochromator is utilized to select the energy range of
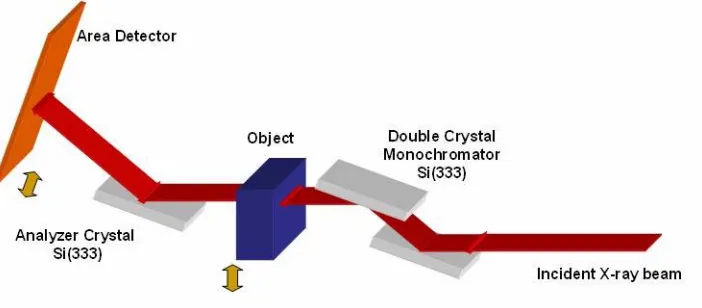
the x-ray from the provided raw synchrotron radiation, called white radiation [3]. The general DEI experimental setup is shown in Figure 1.1 in which the incident beam passes to a
double-crystal Si [333] monochromator then towards the object, and the exiting beam from the object passes to a Si [333] crystal analyzer, diffracted towards the detector. Most of the
x-rays, which do not meet the monochromator conditions, are absorbed by the monochromator and hence the x-ray flux leaving the monochromator is lower than the white
radiation. And, the monochromatized beam is also strongly collimated. According to this monochromatization process, the radiation dose to the object is relatively lower than that of
conventional x-ray radiography.
The main obstacle of the DEI application for medical use in a reasonable medical
facility, or at the clinical level, is the need for a synchrotron source, which is not a feasible component for practical employment of DEI systems, considering the size and cost of the
2
such tubes have lower flux and produce a fan-shaped beam and such features do not meet the requirements for the quality of the x-ray needed for DEI systems.
Figure 1 . 1 The general DEI experiment setup
The NCSU research group suggested a wide beam area x-ray source, which can
provide x-ray with flux comparable to synchrotron source [4]. This proposed x-ray source should meet specific conditions; appropriate ray energy range for mammography, higher
x-ray flux and large field of view. A cylindrical shape of stationary oxygen-free copper target with a layer of molybdenum was proposed. The molybdenum layer will generate the 18 keV
characteristic x-ray, which is preferred for mammography due to its low energy. Most of the electron beam energy will be transferred to heat on the target, which necessitates target
thermal management for high beam currents required to produce high photon flux. In most conventional x-ray tubes, a rotating target is used to spread the heat over larger surface and
thus reduce heat loading. In case of stationary targets in some x-ray tubes, a passive cooling system is employed either using air or oil cooling of the target. A rotating target is not
3
desirable and hence target active cooling will be necessary for the proposed wide beam x-ray source.
1 Diffraction Enhanced Imaging
After Roentgen discovered x-ray in 1895, x-ray radiography was used in many fields, for clinical and industrial purposes. The x-ray projection radiography is still treated as a basic
imaging method in medical field. It has many advantages, a simple scanning process, high contrast images, and low cost of examination. The superposition of images, and lower
contrast images of some materials, is mentioned as a disadvantage of conventional x-ray imaging systems. Cancerous tissues and joint cartilage are not shown very well in
conventional radiographs, as well as in the Computed Tomography (CT) due to their respective attenuation coefficient at the used range of x-ray. In general, conventional
radiography and CT machines use tungsten targets, which generate Kα1 characteristic x-ray at about 59.32keV energy. The attenuation coefficients of these materials in this energy range
are very close to the surrounded material, which reduces the contrast and consequently the readability of the radiographs. Other imaging modalities, other than using x-rays, are used
such as Magnetic resonance Imaging (MRI) or Ultrasound.
Diffraction Enhanced Imaging is a type of projection radiography and therefore it still
has a limitation on the pileup of objects in the imaging, however some research is ongoing to develop tomographic imaging with DEI [5]. As mentioned earlier, the DEI produces images
of higher contrast for materials with small attenuation coefficient, as compared to conventional and digital radiography. The attenuation coefficient of all materials is small at
4
lower energy x-ray is selected for DEI systems. The main interaction at the lower x-ray energy range is the photoelectric effect, which has a probability proportional to Z/E-3, where
Z is the atomic number of the material and E is the photon energy. Therefore, the difference in the attenuation coefficient on the lower energy produces better contrast at the DEI
absorption image. The other feature of DEI is the use of an analyzer crystal to diffract x-rays, and hence, the recorded x-ray contains selected information about the object. Consequently,
the DEI refraction image shows only one physical phenomenon between ray and objects, x-ray refraction angle; which would appear as “image blurring” in general projection
radiography.
1.1 Synchrotron based DEI
In the DEI experiment setup by Dean Chapman et al using a synchrotron source, three
crystals were used in the setup [1]. The incident x-ray beam falls on double crystal Si [333] monochromators, the exited beam traverses through the object then to a third Si [333] crystal
that acts as an analyzer. These crystals diffract the x-ray by the Bragg’s law [6] thus there are x-ray losses on the x-ray path way and the x-ray flux drops down by a factor of 4 during the
monochromatization [3]. Due to expected drop in x-ray flux, the use of synchrotron source at high photon flux was experimented with the white radiation has a spectrum that is almost
uniform through the entire energy range. The monochromator selects a specific x-ray energy from the white radiation. It is also important to mention that a synchrotron source can
provide a well-collimated x-ray beam, which implies that a synchrotron source would be the best to use for DEI to provide high quality images. The difficulty in using a synchrotron
5
in major medical facilities or hospitals.
1.2 X-ray source based DEI
As previously mentioned, a DEI system should employ an x-ray source capable of
producing high flux compatible with synchrotron sources, as well as a strongly collimated beam. Typical conventional x-ray tubes have relatively low x-ray flux. When used for
mammography, a longer scanning time would be necessary to obtain appropriate images. Additionally, such tubes have very small focal spot and large imaging area, and thus the
produced x-ray is divergent and not collimated. To use such source for a DEI system, the recorded x-ray shape on the imaging plate will be tiny as it follows the small effective focal
spot of the x-ray tube. Hence, using a conventional x-ray source is not a solution for the DEI application unless the source is modified to provide an area beam at high x-ray flux.
2 Wide beam x-ray source
The characteristics of a typical x-ray tube are not feasible for use in DEI application without serious consideration regarding x-ray flux, effective focal spot and size of the beam.
A wide beam x-ray source can correct the defects of a typical x-ray source. First, higher electron beam current can provide higher x-ray flux. A typical x-ray tube has relatively short
filaments for thermionic emission. For a wide beam source, three concentric filaments were considered to increase production of electrons and provide a higher electron beam current.
Second, a stationary target with large illumination area is chosen to provide a larger focal spot. Third, a target active cooling system is employed to manage thermal loading and allow
6
beam x-ray source, a proof-of-principle system, is computationally studied. A set of computer codes were used, such as SIMION 3D, MCNP5, Matlab, COMSOL Multiphysics, and
ANSYS CFX, with developed input codes for geometry and DEI imaging.
2.1 Steering electron trajectories
The wide beam x-ray source uses three concentric circular filaments to generate a large
focal area. Electrons are produced by thermionic emission and accelerated towards the grounded target by the electric field between the focusing cup and the target. Concentric
filaments may be all connected together and powered by same current and voltage or individually powered to provide independent control on electron flux and distribution of the
beam particles on the target. The focusing cup may be on same negative accelerating potentials as the cathode. An optimization of the electron trajectories and their distribution is
investigated in this dissertation.
2.2 X-ray flux
The x-ray flux from the wide beam source should be compatible with the synchrotron
radiation flux “white beam” in order to apply the DEI technique. The x-ray flux is affected by the electron beam current and the x-ray window material that acts as a final x-ray filter. The
x-ray window should stand high vacuum conditions while meeting other requirements such as eliminating bremsstrahlung radiation, which only contributes to the radiation dose while
7
2.3 DEI Images
The DEI image quality of the wide beam x-ray source depends on the electron
distribution on the target, known as the actual focal area. Therefore, the final image can change by optimization techniques for electron distribution and steering electron trajectories.
In this study, a phantom consisted of two materials, aluminum oxides and nylon, was computationally studied for simulation of DEI images from the area x-ray source. These
materials were selected as representation of microcalcification on breast cancer and normal tissue.
2.4 Heat removal
Accelerated electrons in the x-ray system impact and deposit their energy on the target, thus the target temperature rises as a result of transferring electron energy to heat on the
target. Conventional x-ray sources do not have serious heat removal problems because they either use a rotating target or a cooling system. Additionally, they use relatively low electron
beam current and thus thermal loading of the target is not an issue. This is not the case for an area x-ray source, in which the required electron beam current is up to 3A and if operating at
60kVp then the target heat loading would be 180kW. In this study, target thermal management is considered to ensure safe operation of such high beam current source for a
time sufficient to obtain DEI images without target deterioration, melting or even evaporation at such high heat flux. Conduction and convective heat transfer were considered in this study,
8
References
[1] Chapman D, Thomlinson W, Johnston RE, et al., Diffraction enhanced x-ray imaging,
Phys. Med. Bio. 42: 2015-2025, 1997.
[2] Pisano ED, Johnston RE, Chapman D, Geradts J, Iacocca MV, Livasy CA, Washburn DB,
Sayers DE, Zhong Z, Kiss MZ, Thomlinson WC. Human Breast Cancer Specimens: Diffraction-enhanced Imaging with Histologic Correlation - Improved Conspicuity of
Lesion Detail Compared with Digital Radiography, Radiology 414(3), 895-901, 2000. [3] Zhong Z., Thomlinson W., Chapman D., Sayers D. Implementation of Diffraction
Enhanced Imaging at the NSLS and APS, Nuclear Instrument and Method in Physics Research A 447: 556-568, 2000.
[4] E. Pisano, E. Johnson, D. Chapman , Z. Zhong, D. Sayers, K. Verghese, J.M. Doster, M.A. Bourham and M. Yaffee, “Clinical Diffraction Enhanced Mammography Unit”,
NCSU and UNC-CH Invention Disclosure, July 2000, NCSU File Number 01-59. [5] Dilmanian F. A., Zhong Z., B Ren, XY Wu, L D Chapman, I Orion, W C Thomlinson,
Computed tomography of x-ray index of refraction using the diffraction enhanced imaging method. Phys. Med. Biol. 45: 933-946, 2000.
[6] Andre Authier, Dynamical theory of x-ray diffraction, International Union of Crystallography, OXFORD University Press (2001).
9
19
Chapter 3 Diffraction Enhanced Imaging simulation based on the area
x-ray generator
Abstract
A synchrotron-based Diffraction Enhanced Imaging system is not a feasible for clinical applications due to the size of the synchrotron source and the cost associated with operation
and maintenance. The proposed area x-ray generator to develop a compact size synchrotron-compatible system, as proposed by North Carolina State University research group in
collaboration with University of North Carolina Chapel Hill Radiology group and other, represents a system that can be accommodated in major clinical facilities. In the previous
chapter, Chapter 2, on the study of the area x-ray generator it has been shown that generating the Kα1 x-ray flux can be comparable to a synchrotron source. In this chapter, Chapter 3, the study investigates imaging using the area x-ray source to produce DEI images through simulation techniques. A MATLAB protocol was developed for 0.8cm×0.8cm field of view,
which includes characteristics of an actual focal area, a monochromator, a designed phantom, an analyzer crystal, and an image plate. The major effect of the area x-ray generator in
obtaining DEI images originates from the distribution of the electrons on the target. In the current simulation, DEI images are obtained from two different forms of electron
distributions, one is for fixed distribution to both lower and higher side images, and the other is used for opposite distributions. The DEI absorption images have strong dependence on the
20 1 Introduction
As it has been previously shown, Diffraction Enhanced Imaging (DEI) has a strong
possibility to be employed in the medical field for soft tissue imaging, especially mammography [1-2]. A synchrotron based DEI system has shown high contrast images,
however, it is not feasible at the clinical level, and hence the area x-ray generator at high electron beam current is proposed [3]. The computational study, as shown in Chapter 2, has
showed that the area beam x-ray generator can provide good features suitable for a DEI system. It has an advantage of reducing the scanning time with the full field of view.
However, it also has a disadvantage in the non-uniformity of x-rays due to hot spots from electron distribution on the target. This chapter focuses on studying the effects of
non-uniformity on the final DEI images.
2 General considerations 2.1 DEI theory
In 1998, Dean Chapman et al have introduced a new radiography method, called Diffraction Enhanced Imaging, DEI [1]. It is based on the rejection of the scattered x-ray by
diffracting x-ray using a Si[333] crystal to act as an analyzer,. Scattered x-rays are considered noise and produce blurring in conventional radiography. The main function of the analyzer
crystal is to diffract a selected x-ray beam to the detector. The ratio of the crystal reflectivity, known as the rocking curve, highly depends on the crystal structure. Si[333] crystal has a
narrow rocking curve of few microradians at 18 keV, as shown in Figure 3.1, and the reflectivity has its maximum at the exact Bragg condition (zero microradians) and decreases
21
imaging from both the lower and higher sides of the rocking curve, representing the FWHM of the rocking curve, and the obtained two images are used in the DEI algorithm.
Figure 3 . 1 The Rocking curve of Si[333] with 18 keV x-ray
The intensity of x-ray after the analyzer crystal for any side of the rocking curve can be expressed by the Equation 3.1.
(
0)
i R z
I =I R θ + Δθ (3.1)
where IR is the incoming attenuated intensity to the analyzer crystal, R(θ0+ΔθZ) is the
reflectivity at the angle θ0+ΔθZ, with θ0 representing the tuned angle for the FWHM of
rocking curve and the ΔθZ is the small refraction angle by the object. This reflectivity term is
expanded in a Taylor’s series, and hence the higher (IH) and lower (IL) side intensities on the
detector can then be expressed by Equations 3.2 and 3.3.
( )
( H)H R H Z
dR I I R
d θ
θ θ
θ
⎛ ⎞
= ⎜ + Δ ⎟
22
( )
( )LL R L Z
dR I I R
d θ θ θ θ ⎛ ⎞ = ⎜ + Δ ⎟
⎝ ⎠ (3.3)
These equations can be rearranged for the IR and ΔθZ. This DEI algorithm applies for
the raw image data through pixel-by-pixel. And, the final expression for the DEI image is
composed of the refraction angle image Δθz, and the apparent absorption image IR as shown
in Equations 3.4 and 3.5, respectively
( ) ( )
( ) ( )
H L L H
Z
H L
L H
I R I R
dR dR I I d d θ θ θ θ θ θ θ − Δ = ⎛ ⎞− ⎛ ⎞ ⎜ ⎟ ⎜ ⎟ ⎝ ⎠ ⎝ ⎠ (3.4) ( ) ( ) ( ) ( ) ( ) ( ) H L L H R H L L H dR dR I I d d I dR dR R R d d θ θ θ θ θ θ θ θ θ θ ⎛ ⎞− ⎛ ⎞ ⎜ ⎟ ⎜ ⎟ ⎝ ⎠ ⎝ ⎠ = ⎛ ⎞− ⎛ ⎞ ⎜ ⎟ ⎜ ⎟ ⎝ ⎠ ⎝ ⎠ (3.5)
2.2 Area x-ray beam generator
A DEI system must have a strongly collimated x-ray beam and high photon flux, thus
the current DEI experiments are successfully performed using the synchrotron source at the National Synchrotron Light Source (NSLS) of Brookhaven National Laboratory (BNL) for
lower energy range (less than 30keV), and the Advanced Photon Source (APS) at Argonne National Laboratory for higher energy range (up to 60keV). These two DEI facilities
successfully performed DEI imaging experiments, thus confirming the feasibility of DEI as a new modality [4]. To move from a National Laboratory experimental setup to a
clinically-approved system, which can be installed in major medical facilities, a compact size area ray generator compatible to synchrotron source is required to be developed. An area beam
23
source [3]. In this research, a conceptual area beam x-ray generator is considered that generates electrons from three concentric filaments in a filament cup. The filament cup can
either be biased or float, which alters the formation and distribution of the electrons. High beam current is required for such an x-ray source and thermal management of the x-ray target
is a necessity at high beam current of 300mA and 3A; cryogenic active cooling of target may be employed.
2.2.1 Concept
The area ray beam from the generator could be quasi-collimated after exiting the x-ray window. The double crystal monochromator works as a filter of the direction and energy.
Some of the generated x-ray meets the Bragg condition as they go through the monochromator, and the other x-rays which do not meet the Bragg condition will be extinct
or absorbed by the crystal. Therefore, the output x-ray from the monochromator will be in the same direction and at same energy. In case of a conventional x-ray tube, the distribution of
the output x-ray is depending on an actual focal area on the target surface. Most conventional x-ray tubes have small focal area on the target, about 3 mm2 for most commercial x-ray tubes
[5], and thus they generate collimated and mono-energetic beam only within the actual focal area which is less then 3 mm2.
The x-rays from the synchrotron source NSLS of Brookhaven National Laboratory (BNL) for current DEI experiments is covering 80 mm wide and 1mm in height at the
location of the object [2]. This synchrotron beam is well collimated and has a flux of 107 ph/mm2/sec at 18keV. Because of the narrow imaging beam, it is required to scan line by line
24
is shown in Figure 3.2. For example, to scan 150 mm2 image it needs 3000 scans for a 50 micro pixel detector plate. The maximum scan time for the synchrotron-based DEI
experiment is about 200 sec., which is much less than the scan time of up to 10,000 sec if using a conventional x-ray tube [6] due to the small focal area and the low x-ray intensity.
Figure 3 . 2 Narrow beam diffraction concept
The proposed concept of an area x-ray generator, for an up-scaled version for commercial use, has an actual focal area of about 100 cm2 on the target, while the North
Carolina State University prototype lab-version source is 6.157 cm2. For a large crystal, the diffraction will occurred through the entire crystal surface and the beam is much wider. It is
possible for the prototype lab-version to have about 2.4 cm2 of actual focal area on the detector plate when the target angle is 22.5 degree. A conceptual drawing of the large focal
area diffraction is illustrated in Figure 3.3. Therefore, the wide beam x-ray generator will eliminate line by line scanning process, and hence the total scanning time can greatly be
reduced for feasibility as an attractive DEI application in the medical field. A long scanning time is not desirable and creates motion artifacts, which is more important for medical
25
require object compression during the entire scanning time. But, the DEI can provide more comfortable examination through eliminating the compression procedure. Such advantages
are achievable with the area x-ray source. However, non-uniformity of the electron distribution on the actual focal area may be problematic. The x-ray flux profile on the image
plate depends on the electron distribution on the target and the non-uniformity of the electron distribution could generate spotted images.
Figure 3 . 3 Wide beam diffraction concept
3 Method
In this study, computational simulations were performed to obtain DEI images and
analyze the artifacts from the wide beam x-ray generator. The final DEI images were obtained by using 2-dimensional convolution with each imaging component. Equation 3.6
shows the simulation kernel.
( ( ))
side
image source rad side z
I = I ⊗ ⊗I Rθ + Δθ ⊗ ⊗PSF Noise+ (3.6)
26
based on the actual focal area, R(θside+Δθz) represents the reflectivity function of the analyzer
crystal, PSF is the point spread function representing the response of the image plate.
Quantum noise is also added to the final images. The lower and higher side images are obtained using the above kernel, and the refraction and absorption images are generated by
applying the DEI algorithm to each pixel, on a pixel by pixel regime.
3.1 Monochromatized beam
Typical x-ray tube has a continuous energy spectrum, which is shown with
Bremsstrahlung and some characteristic x-ray peaks. As previously indicated the target is oxygen free copper with a layer of molybdenum; here the focus is on the Kα1 x-ray flux form the molybdenum target. It is computationally assumed that the monochromator is tuned to the Kα1 x-ray energy, which met the Bragg condition, and located at the maximum flux position next to the x-ray window. The monochromatized x-ray beam is shown as a source function in the simulation kernel, where the source function represents the x-ray intensity response of the
monochromator from a point electron source. Therefore, two features should be considered, the maximum intensity from a single electron hitting on the target and the electron
distributions on the target. The energy spectrum at the maximum flux position from a point electron source is shown in Figure 3.4. The target angle was set to the 22.5 degree, which
corresponds to the maximum angle for the prototype lab-version device. Only the x-rays of the Kα1 energy will be allowed and all others will be eliminated by the crystal. Therefore, the source function, which represents the monochromatized beam through the imaging area, can be obtained by convolution of the reflectivity of the crystals [7]. The electron distribution on
27
Figure 3 . 4 X-ray distribution from the point electron source at the maximum flux position
28
3.2 X-ray optics on the phantom 3.2.1 Phantom design
An appropriate mammogram phantom is computationally designed to simulate DEI images based on the use of the prototype lab-version area x-ray source. Breast cancer is
classified by the location of cancerous tissue and tumor size. There are two type of pre-cancer, the Ductal Carcinoma In Situ (DCIS) and the Lobular Carcinoma In Situ (LCIS). Such
cancers are likely to develop to invasive cancer. The physiological characteristic of these pre-cancers show some calcification on their respective regions. Breast cancer studies show that a
large calcification is not usually associated with cancer, but small calcifications, microcalcification, are related to cancer [8]. Based on the interest in soft tissues and
micro-calcification, the phantom in this simulation was chosen to contain two materials, nylon and aluminum oxide. Table 1 shows the properties of these materials, also air properties are added.
Table 3 . 1 Material properties of phantom material
Object Air Tissue Calcification
Equivalent material Air Nylon fiber Type 6/10 Al2O3
μ at 18 keV [cm-1] 1.47×10⁻³ 0.616 11.77
Density [g/cm3] 1.29×10⁻³ 1.14 3.69
Refractive Index n=1-δ ≈ 1 δ = 8.56×10⁻⁷ δ =2.46 ×10⁻⁷
The shape of the phantom is basically cylindrical, one large cylinder of nylon containing a small rod of aluminum oxide, as shown in Figure 3.6. The image simulation
29
Figure 3 . 6 Phantom design
3.2.2 X-ray path through the object
The image simulation code is designed to calculate the attenuation and refraction
with the simulation phantom. The x-ray path way has been divided into two regions by the geometry features, a single cylinder region and a dual cylinder region. The single cylinder
region is shown in Figure 3.7, and is similar to the single cylinder phantom previously considered by Kiss [9]. As seen from Figure 3.7, the single cylinder is a solid nylon
surrounded by air, the incident x-ray falls on the cylinder in the location y1 by an angle θ1i ,
traverses the cylinder and exiting with a refractive angle. The incident angle of the x-ray
beam on the cylinder can be calculated from Equation 3.7.
1 1 1 1 sin i y r θ = − ⎛ ⎞ ⎜ ⎟
⎝ ⎠ (3.7)
When the beam penetrates the object it undergoes two refractions and the refraction
angle can be calculated from the Snell’s law of refraction. The final refection angle is approximately twice of the single refraction angle and is expressed by Equation 3.8.
1
2 tan( )i air 1
Z tiss n n θ θ ⎡ ⎤ Δ ≈ ⎢ − ⎥
30
Figure 3 . 7 X-ray pathway inside of single cylinder object
In the dual cylinder configuration the x-ray beam refracts first in the nylon cylinder then incident on the calcification rod. In this case, the same equation for first region is
applicable and is used for the incident and refraction angles. The incident angle onto the calcification rod is determined by the first refraction angle and the location of calcification
rod. Consequently, the pathway of the incident x-ray on the dual configuration is subject to multiple refractions in the nylon cylinder and the calcification rod. Figure 3.8 shows the
x-ray pathway in the dual cylinder configuration, which complicates the calculation of x-x-ray pathway and refraction angle.
31
Two assumptions were applied to these calculations. The first assumption is that the x-ray travels into the objects in a straight line, which means that the refraction angle doesn’t
affect x-ray attenuation through the objects. The maximum refraction angle by the first cylinder, the nylon, is 1.0×10⁻⁵ radian, which is very small compared to the object’s diameter
0.635 cm. This assumption simplifies the calculation of x-ray travel length through the entire objects. The second assumption is that the second incident angle θ2i.mod does not change by
the first refraction angle θ1z. Therefore, modified second incident angle is defined as the
summation of the first refraction angle and the incident angle, which is calculated with x-ray
location, h. The definition of angles is given in Equations 3.9 and 3.10. The final refraction angle in this region is same as per the single cylinder case, which follows Equation 3.8 again
with the second incident angle θ2i.mod. These two assumptions minimized calculation
complexity, also reduced errors on the second assumption by the first assumption.
2 2 1
i.modfied i z
θ =θ +θ (3.9)
2 1 2 sin i h r θ = − ⎛ ⎞ ⎜ ⎟
⎝ ⎠ (3.10)
3.3 Image plate
The DEI algorithm is applied after obtaining the raw image, which contains
characteristics of an image plate, Point Spread Function (PSF) and Dynamic Range (DR). Possible x-ray detectors for DEI were compared By Kiss et al [10]. The Fuji BAS2500 Image
Plate Reader shows the largest dynamic range and active area among CCD devices, Mar USA and MicroPhotonics XQUIS 1000. In his study, the Fuji BAS2500 Line Spread
32
Function. The Fuji BAS 2500 Image plate data are shown in Table 3.2, in which it is obvious that the vertical and horizontal FWHM have similar value and therefore the Point Spread
Function can be considered as one of them. A Fuji image plate reads at latitude (L) of 5 and sensitivity(S) of 4000 with 16 bit gray level. The reader converted raw x-ray intensity Iraw to
output data Iin withas shown in Equation 3.11. The Dynamic Range is defined as a ratio
between maximum intensity on the detector and the background noise, which is 1.4 × 10⁵ for
the Fuji BAS2500 image plate. The detailed data were shown in Table 3.2
( / 0.5) 4000
10L Iraw G
in
I S
−
= (3.11)
Table 3 . 2 Fuji BAS 2500 Image plate data [10]
Fuji BAS 2500 Pixel size 50 μm Pixel format 4000 × 5000 pixels
Image area 200 × 250 mm2 Gray level 16-bit Readout time 5 min
Horizontal FWHM 145±1μm (2.9±0.1 pixels) Vertical FWHM 138±1μm (2.8±0.1 pixels) Saturation level 1.4×10⁴ photon / pixel
Noise level 0.101 photon / pixel Dynamic range 1.4 × 10⁵
Latitude 5 Sensitivity 4000
4 Image simulation results
33
assembly, 30 mA electron beam current, Si[333] double crystal monochromator and analyzer, and a Fuji BAS2500 Image Plate. The full field of view of the simulation is 0.8 cm × 0.8 cm.
The diameter of the nylon cylinder is 0.635cm, and the aluminum oxide rod is 0.05 cm diameter. After obtained the raw images on the image plate, the DEI algorithm was applied to
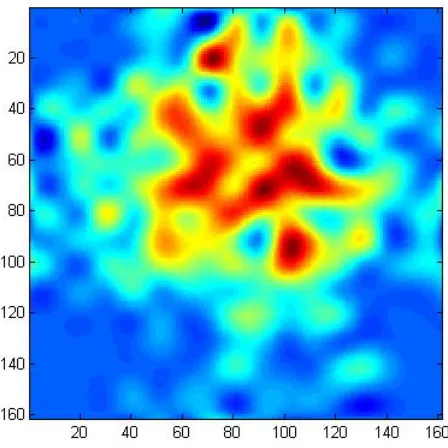
pixel by pixel for DEI refraction and absorption images. The simulations are also tested for different electron distributions on the x-ray target. Figure 3.9 shows the electron distribution
used for simulation, in which distribution (a) is a projection view of the actual focal area as obtained from SIMION simulation of electron trajectories, and distribution (b) which is a
flipped over from the original distribution. The DEI images, lower side, higher side, absorption and refraction images are shown in Figure 3.10. The images are truly affected by
the electron distribution, but the effect is reduced for the refraction image because it only represents the refraction angle difference between the raw lower side and higher side images.
Image blurring is observed at the edge of the nylon cylinder, where partial image blurring occurs at places of low electron density on the target.
34
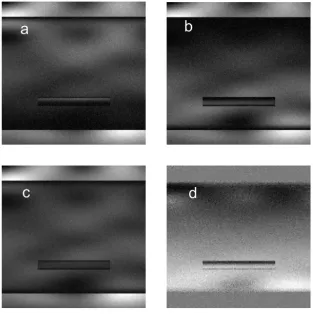
Figure 3 . 10 Images based on the fixed electron distribution, a. scaled higher side image, b. scaled lower side image, c. absorption image, d. refraction image
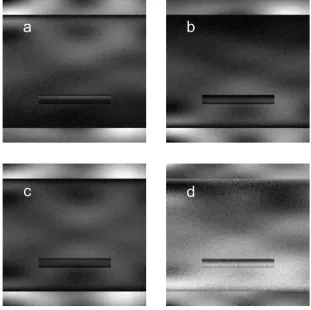
The second simulation was performed with an idea of varying the electron distribution at time of each side scan. In this case it was assumed that the distribution of the electrons is a
‘flipped over’ for the entire image surface. Image simulation was obtained for the higher side of the rocking curve using the original electron distribution with same data of the first
simulation. The lower side image was generated by the electron distribution (b), the flipped over distribution. Figure 3.11 shows the obtained images. In this simulation, the absorption
image contained the bright regions from the both side images. The refraction image had less blurring on the edge of the Nylon. Also, the region of aluminum oxide rod showed typical
35
from the electron distribution increased and showed highly spotted refraction image.
Figure 3 . 11 Images based on the different electron distribution, a. scaled higher side image, b. scaled lower side image, c. absorption image, d. refraction image
5 Conclusion
The area beam x-ray generator is adequate for DEI application and can obtain images in a reasonable time. However, electron distribution on the actual focal area produces
non-uniformity on the whole DEI images. In this research, MATLAB protocols ‘codes’ were written to simulate effects of the actual focal area distribution on the final DEI images. The
36
were obtained using two different electron distributions on the target. The first image set was obtained from applying same electron distribution to the lower and higher side images. The
DEI absorption images contained similar intensity distribution through the whole images, which is a natural outcome based on the expression of the absorption image. In case of the
refraction image, some regions showed similar intensity shapes with blurring at the edge of nylon cylinder. However, the image is more uniform compared to the absorption image. The
second simulation was performed with different electron distributions, one for the higher side image and one for the lower side image. The DEI absorption image shows some overlap
image, with increased non-uniformity on the refraction image but decreased edge blurring. Refraction images in both cases remained at good resolution for the aluminum oxide region,
which simulates the calcification inside the nylon cylinder.
References
[1] Chapman D, Thomlinson W, Johnston RE, et al. Diffraction enhanced x-ray imaging,
Phys. Med. Bio. 42: 2015-2025, 1997.
[2] Pisano ED, Johnston RE, Chapman D, Geradts J, Iacocca MV, Livasy CA, Washburn DB,
Sayers DE, Zhong Z, Kiss MZ, Thomlinson WC. Human Breast Cancer Specimens: Diffraction-enhanced Imaging with Histologic Correlation - Improved Conspicuity of
Lesion Detail Compared with Digital Radiography,Radiology 414(3), 895-901, 2000. [3] Chang H. Kim, Mohamed A. Bourham, J. Michael Doster, A wide beam x-ray source
suitable for diffraction enhanced imaging application, Nuclear Instrument and Method in Physics Research A 566: 713-721 ,2006.
37
Enhanced Imaging at the NSLS and APS, Nuclear Instrument and Method in Physics Research A 447: 556-568, 2000.
[5] Jerrold T. Bushberg et al, The Essential Physics of Medical Imaging, 2nded., Lippincott Williams & Wilkins (2002), Baltimore Maryland
[6] Wang, Xiaoqin, Line x-ray source for diffraction enhanced imaging in clinical and industrial application, Appendix D, Ph.D Dissertation, NC State University, 2006.
[7] Miklos Z. Kiss, Application of diffraction enhanced imaging for obtaining improved contrast of calcifications in breast tissue, Appendix A. Ph.D Dissertation, NC State
University, 2002. [8] www.breastcancer.org
[9] Kiss MZ, Sayers DE, Zhong Z, Measurement of imaging contrast using diffraction enhanced imaging, Phys. Med. Bio. 48: 325-340, 2003.
[10]Kiss MZ, Sayers DE, Zhong Z, Comparison of X-ray detectors for a diffraction enhanced imaging, Nuclear Instrument and Method in Physics Research A 491: 280-290,
38
Chapter 4 Focal area optimization of the wide beam x-ray source
Abstract
Previous studies of wide beam x-ray sources have shown compact systems can be
engineered that are adequate for Diffraction Enhanced Imaging applications with sufficiently high photon flux and production of strongly collimated x-rays. The x-ray distribution on the
imaging surface depends on the focal area distribution, which is based on the characteristics of the monochromator’s response. Therefore, the focal area distribution impacts the image
quality and the local heat loading, with the latter determining the limits on system operating time. This study seeks to optimize focal area uniformity by independently powering the three
concentric filaments in the proof of principle design. Electron distributions and their trajectories are simulated. The focusing cup voltage is set to -60kVp. Each filament has a
separate voltage to independently generate electrons at different rates. Evaluation of uniformity is determined by the standard deviation and peak-to-average ratio. The
independent voltage biasing of the filaments has shown that improved distributions can be obtained when the outer filament is at -60kVp, the middle one is at -48kVp and the inner
filament is at -40kVp.
1 Introduction
The study of Diffraction Enhanced Imaging has shown higher contrast images for
materials with lower attenuation coefficient, which provides for a more favorable x-ray modality for soft tissue imaging, specifically in clinical applications for mammography [1-4].
39
collimated x-ray beam have shown high contrast images as compared to conventional radiography. [5]. All conventional x-ray tubes generate low-flux beams that diverge at large
angles, and are thus less collimated, which makes conventional sources inadequate for DEI applications. Development of an area x-ray beam has shown the potential to provide
synchrotron-comparable photon fluxes from sources of sufficiently small size to fit in a compact integrated x-ray DEI system, suitable for installation in major medical facilities and
hospitals [6].
Previous studies of the wide beam x-ray source focused primarily on the production of
the required x-ray flux from concentric filament designs with all filaments at the same potential leading to non uniformities in the electron distributions on the target [7]. In the
image simulation study, non uniformities in the electron distribution resulted in some loss of phantom information due to saturation of the image plate [8]. Additionally, hot spots or
localized high heat flux, can result in target melting, damage and deterioration, especially for the target’s thin molybdenum layer. In this study, the electron distribution on the target
surface is improved by independently biasing the filaments at different voltages.
2 General considerations
In general, the x-ray tube cathode consists of a filament or a dual filament inside a
focusing cup, which provides electron control and focus prior to acceleration towards the target. The filaments and focusing cup are usually at negative potential and the target is at
positive potential or ground, thus providing the necessary electric field for electron acceleration and steering towards the target [9]. In conventional x-ray tubes, the electron
40
blurring. In the DEI system the double crystal monochromator serves to select a specific x-ray energy range and collimates the beam. X-rays from the source diverge to the x-ray
window, where most of the x-rays do not meet the Bragg condition of the crystal and are eliminated. If the monochromator and analyzer crystals are stable and tuned to the exact
Bragg angle, then the electron distribution on the target will be the main artifact for DEI imaging. It can be assumed that the actual focal area in the DEI setup represents the x-ray
flux on the imaging surface.
Electron trajectories are determined by the filament’s electric potential and the biasing
potential on the filament cup [9]. Biasing the filament cup is more effective in producing a small actual focal area, but a larger focal area is required for the proposed wide beam x-ray
source. The filament assembly for this specific design is composed of three concentric filaments housed inside the focusing cup. The spatial distribution of the electrons generated
by thermionic emission from the filaments depends on the location of the filaments and the amount of electric power into each filament. If all filaments are powered at same level, then
the electron generation would be non-uniform with a peak in the center. The resulting electron density at the target would be higher at the center resulting in the development of hot
spots. An un-biased filament cup in a floating configuration produces a more divergent shape and therefore can be helpful in producing a more uniform electron distribution on the target
and minimize generation of hot spots.
3 Simulation of electron trajectories 3.1 Design parts
41
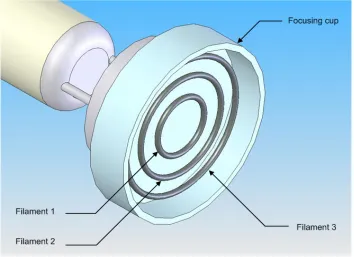
filament cup, and an actively-cooled oxygen-free copper target with a molybdenum layer [7]. Figure 4.1 illustrates the three filament assembly, the focusing cup and the supporting
structure. The radius of the focusing cup is 2.15 cm and the radius of each filament is shown in Table 4.1.
Figure 4 . 1 Filaments assembly design
Table 4 . 1 Filaments data
Filament location Radius # 1 inner 0.701 cm # 2 middle 1.215 cm # 3 outer 1.658 cm
3.2 Simulation options
42
SIMION 3D code [10]. The filament assembly can either be at common voltage with common current to all filaments or each filament be powered independently. In previous
simulations, all filaments were interconnected and thus the voltage to all filaments was equal in both floating and non-floating configurations [7]. In this chapter, an investigation of
independent filament biasing is conducted in order to improve the uniformity of the electron distribution on the target. Figure 4.2 illustrates the filaments when all are floating (Fig. 4.2a)
and when all are connected and non-floating (Fig. 4.2b). The focusing cup is at -60kVp for all simulations. The first simulation considers the effects arising from the voltage changes on
each filament. All filaments are assumed to be floating. One filament voltage would be reduced from -60kVp to -40kVp in 10kVp steps. This provides four simulation tests, for each
voltage change on a single filament there will be simultaneous change for the two other filaments. Based on the first simulation results, the second simulation would be performed on
a narrower voltage change of 2kVp at the determined voltage range.
Figure 4 . 2 Schematic drawing of the floating and non floating filaments’ connection
Electron distribution on the target surface is recorded and plotted by 15 x 15 arrays,
43
the uniformity of the electron distribution on the surface, the standard deviation and the peak-to-average ratio. Additionally, the electron utilization, which is the ratio between the number
of generated electrons from the filaments and the number of landed electrons on the target, is also used in the comparison. The definitions of standard deviation and peak-to-average ratio
are given in Equations 4.1 and 4.2, respectively
(
)
2 1/ 2 1 1 1 n i iSTD x x
n =
⎛ ⎞
=⎜ − ⎟
−
⎝
∑
⎠ (4.1)max
x x
Ω = (4.2)
where, 1 1 , 225 n i i
x x n
n =
=
∑
=The simulation results for this case of independent power to each filament are compared to the previous simulation results of the biased filaments at -60kVp [7]. The
obtained simulation results can also be compared with a reasonable assumption that the electrons landed uniformly on the target surface, this means that under such assumption the
standard deviation and the peak-to-average ratio would be zero and unity, respectively. Therefore, a lower value of the standard deviation and a close to unity peak-to-average ratio
would be preferred. The average number of electrons on each array, under such assumption, would be about 5.17 at a uniform distribution.
4 Results and discussion
44
filament was varied from -60kVp to -30kVp in 10kVp stepping down regime. One distinctive feature on the results is that the outer filament is better to be at the same voltage of the
focusing cup. The outer filament not only generates electrons but also has an additional feature in electron repulsion and thus reducing escape of electrons. Figure 4.3 shows electron
trajectories for two cases, option 1 with the inner filament at 40kVp (Figure 4.3 a: outer at 60kVp, middle at 60kVp and inner at 40kVp), and option 3 with the outer filament at
-40kVp (Figure 4.3 b: outer at --40kVp, middle at -60kVp and inner at -60kVp). The electron loss is higher when the outer filament is at a potential less than the focusing cup, as seen from
Figure 4.3b, and thus maintaining the outer filament at the focusing cup potential reduces electron loss.
The first simulation results showed that the outer filaments should be at the filament cup potential at -60kVp. The case of -60kVp for the middle filament and -40kVp on the inner
filament is showing the lowest standard deviation and high utilization of 98%.
45
Table 4 . 2 First simulation results
Option Outer Middle Inner Utilization STD Average Ω
-60 0.97 4.23 4.36 7.03 -50 0.98 4.85 4.41 6.75 -40 0.98 3.53 4.37 4.95 1 -60
-30 0.94 3.91 4.25 5.09
-60 0.97 4.23 4.36 7.03
-50 0.94 8.17 4.18 22.20
-40 0.73 5.07 3.30 14.75
2 -60
-30
-60
0.70 3.83 3.20 9.86
-60 0.97 4.23 4.36 7.03
-50 0.76 5.25 3.41 13.23
3
-40
-60
0.49 5.16 2.23 25.88
-60 -60 0.97 4.23 4.36 7.03 -50 -50 1.00 7.62 4.49 8.42 -40 -40 0.87 4.42 3.94 7.10 4 -60
-30 -30 0.71 3.65 3.26 5.81
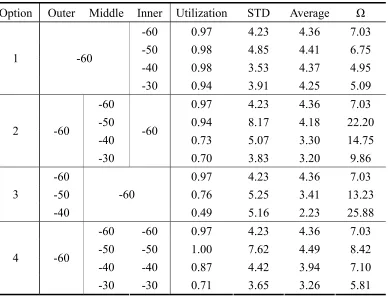
The second simulation applies more detailed voltage changes for this option by
maintaining the outer and middle filaments at -60kVp and varying the inner filament’s voltage between -30 to -50kVp on 2kVp steps. Figure 4.4 shows the change in the standard
deviation and the peak-to-average ratio over the entire range of change of the inner filament’s voltage. The standard deviation is the lowest at -40kVp and rises if the potential would be
increased or decreased, and the peak-to-average ratio is also at its lowest in this configuration. The second simulation confirms the results of the primary one indicating that the best
46
Figure 4 . 4 Standard deviation and Peak-to-average ratio VS Inner filament voltage change
(outer and middle : -60kVp)
The third simulation focused on option 2 in which the outer and inner filaments are
both at -60kVp, and varying the middle filament voltage between -60 to -30kVp on 10kVp steps. In this option it is also shown that the least standard deviation is when the middle
filament is at the lowest voltage. A simulation was performed with varying middle filament voltage on 2kVp increments while maintaining the outer and inner filaments at 60kVp and
-40kVp, respectively. Figure 4.5 shows that the key parameters, standard deviation and peak-to-average ratio, increase and peaking at -54kVp, and decrease for potentials above or below
the -54kVp. Table 4.3 shows the change in the parameters for all changes in the middle filament potential for this case, in which it is obvious that the lowest standard deviation
47
Figure 4 . 5 Standard deviation and Peak-to-average ratio VS Middle filament voltage change
(outer : -60kVp, inner : -40kVp)
Table 4 . 3 Third simulation results
Outer Middle Inner Utilization STD Average Ω
60 0.98 3.53 4.84 4.95
58 0.99 3.99 4.95 3.84
56 1.00 5.96 4.99 6.82
54 1.00 10.26 4.99 25.67
52 1.00 6.01 4.99 8.83
50 1.00 4.42 4.99 4.41
48 1.00 3.93 4.95 3.64
46 0.99 4.56 4.88 5.53
44 0.95 4.54 4.74 6.97
42 0.91 4.52 4.43 8.14
60
40
40
0.87 4.42 4.37 7.10
48
simulation, but this result of the third simulation provides higher utilization and peak-to-average ratio. The electron trajectory and their distribution on the surface of the target are
shown in Figures 4.6 and 4.7, respectively. As seen from Figure 4.6, all electrons emanating from the filaments land on the target without any loss. Figure 4.7 (a) shows the best result
among the performed simulations. Figure 4.7 (b) shows the electron distribution from the non-floating filaments option. These figures show that the uniformity of electron distribution
was improved by the independent powering of each filament.
Figure 4 . 6 Electron trajectories from SIMION – Floating filaments option (outer: 60kVp, middle: -48kVp, inner: -40kVp)
49 5 Conclusion
A large area, wide beam x-ray source has advantages over conventional x-ray tubes for
DEI applications. Electron trajectories in conventional x-ray tubes are focused on a tiny focal spot on the target. For DEI applications that require beam currents of up to 3A, the small
focal spots would be at extreme heat loadings. The x-rays will be limited by the electron focal area after passing through the monochromator, and thus the wide beam x-ray source is
advantageous in providing less operation time.
In this study, the three concentric filaments assembly was tested via computational
simulation and compared to the floating filament concept. The first simulation shows that the outer filament provides repulsion force on the electrons and reduces losses if it would be kept
at the same potential of the filament cup at -60kVp, and that a lower voltage on the inner filament helps to disperse electron trajectories to the target. For the quantitative comparison,
the standard deviation and the peak-to-average ratio were used as measures of the optimized independent filament performance. The final simulation results showed that the option of
having the outer filament at -60kVp, the middle at -48kVp and the inner at -40kVp, results in minimum standard deviation and peak-to-average ratio, and achieved 100% of electron
utilization. Therefore, wiring of the filaments in the filament cup should be independent to achieve better utilization on the target and near uniform distribution. Filaments may use the
50
Reference
[1] Shtern F. Digital Mammography and Related Technologies: A Perspective From the
National Cancer Institute, Radiology 183:629-630, 1992.
[2] Chapman D, Thomlinson W, Arfelli F, et al. Mammography Imaging Studies using a
Laue Analyzer Crystal, Rev. Sci. Instrum. 67(9): CD-ROM, 1996.
[3] Chapman D, Thomlinson W, Johnston RE, et al. Diffraction enhanced x-ray imaging,
Phys. Med. Bio. 42: 2015-2025,1997.
[4] Pisano ED, Johnston RE, Chapman D, Geradts J, Iacocca MV, Livasy CA, Washburn DB,
Sayers DE, Zhong Z, Kiss MZ, Thomlinson WC. Human Breast Cancer Specimens: Diffraction-enhanced Imaging with Histologic Correlation - Improved Conspicuity of
Lesion Detail Compared with Digital Radiography, Radiology 414(3), 895-901, 2000. [5] Zhong Z., Thomlinson W., Chapman D., Sayers D. Implementation of Diffraction
Enhanced Imaging at the NSLS and APS, Nucl. Instrum. Meth., In Phys. Res. A447: 556-568, 2000.
[6] E. Pisano, E. Johnson, D. Chapman , Z. Zhong, D. Sayers, K. Verghese, J.M. Doster, M.A. Bourham and M. Yaffee, “Clinical Diffraction Enhanced Mammography Unit”,
NCSU and UNC-CH Invention Disclosure, July 2000, NCSU File Number 01-59.
[7] Chang H. Kim, Mohamed A. Bourham, J.Michael Doster, A wide-beam X-ray source
suitable for diffraction enhanced imaging application, Nucl. Instrum. Meth, In Phys. Res. A566:713-721,2006.
[8] Chang H. Kim, Mohamed A. Bourham, “Diffraction Enhanced imaging simulation based on the area x-ray generator”, to be submitted to Phys. Med. Bio. 2007
51
Williams & Wilkins (2002), Baltimore Maryland
52
Chapter 5 Target thermal management simulation using inner jet cooling
concept
Abstract
A wide beam area x-ray source has been proposed as a practical replacement for synchrotron sources in clinical DEI applications. The proposed x-ray source can be employed
in major medical facilities due to its compact size, reasonable dimensions and power requirements. This source provides a wide x-ray illumination area and has characteristics
comparable to synchrotron radiation. Due to the large focal area, a decrease in x-ray flux is expected and thus high electron beam currents of up to 3A are considered. At such high beam
currents, the heat loading on the target can be significant and limit the operational time of the target. The anticipated scanning time for a DEI system is a few seconds, and thus target
thermal management is essential to ensure target performance without deterioration, melting, cracking or even evaporation. An active cooling system is required for the target block in
order to remove the heat and allow for sufficient scanning time. In this study, jet cooling of the target back is investigated for a prototype proof-of-principle target. The prototype target
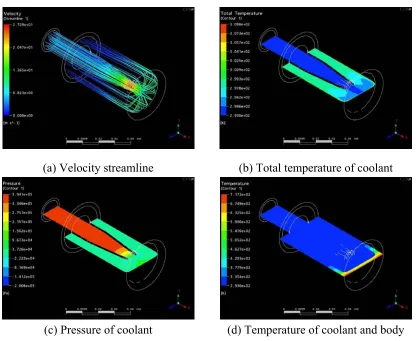
was simulated with the transient k-ε turbulence multiphysics model in ANSYS CFX. The jet nozzle was designed to produce the maximum convective heat transfer coefficient for the
range of coolant velocities considered. The simulations were conducted at a heat flux of 1.8×10⁷ W/m2, consistent with values anticipated for a full scale target. The target
temperature exceeds the copper melting point in 2 seconds at inlet velocities below 2 m/sec. The results show that a 3.5 m/sec inlet velocity at atmospheric pressure is a lower limit for
53 1 Introduction
In the proposed compact wide-beam x-ray source for Diffraction Enhanced Imaging
applications, the major requirements are a highly collimated, high intensity photon flux [1-3]. Conventional x-ray tubes can not meet these requirements due to their relatively low x-ray
flux and the fan shape of the x-ray beam. To increase x-ray flux to compete with a synchrotron radiation beam, a high electron beam current (up to 3A) is proposed in
conjunction with a large x-ray illumination area. Heat removal in a conventional x-ray source is not a critical issue because lower electron beam currents are used and a rotating target
allows for spreading the heat flux over a larger area of the target [4]. Conventional x-ray tubes which use stationary targets are passively cooled with air or oil. The wide-beam x-ray
source in this study has a stationary target (anode) and hence heat removal at high beam currents is essential. For a device expected to operate at the commercial level, a 3A beam
current would be required in order to generate the necessary high x-ray flux. At 60kV acceleration potential, this is a 180kW system that requires special thermal management for
target heat removal. The estimated scanning time of a DEI-based wide beam x-ray system is ~20 sec during which time the beam energy will be converted to heat energy on the target [5].
The cooling demands of such a target exceed the heat removal capacity of a passive cooling system and necessitate an active cooling system.
Early research work on the wide beam x-ray system considered cryogenic cooling using liquid nitrogen through a contact or invaded cold finger [1]. This study revealed that
heat removal via conduction utilizing liquid nitrogen could not obtain the required operating time before the target reached its melting temperature. In addition, the large thermal gradients
54
In this study, an inner impinging jet cooling method was employed for active cooling with water at atmospheric pressure and room temperature. The prototype proof-of-principle
design was simulated using the ANSYS CFX finite element code.
2 General considerations
Due to the high heat loads, target thermal management is an important issue for the
proposed wide beam x-ray system. Impinging jet cooling has been shown as an effective way to remove heat from the heated surface in various devices, and is considered in this study for
target cooling [6]. Design of a jet cooling system requires maximizing the convective heat transfer from the target back while satisfying thermal limits associated with maximum target
temperatures and critical heat flux. Convective heat transfer can be maximized by optimizing the geometry of the jet nozzle. To maintain target integrity, maximum target temperatures
must remain well below the melt temperature. This is dictated by the target materials, geometry and the efficiency of the target cooling system. If the heat flux at the coolant/target
interface exceeds the critical point, transition to film boiling can occur degrading heat transfer and potentially leading to target failure [7].
2.1 Convective heat transfer coefficient
Impinging jet cooling is a widely used method for many engineering applications and has been studied as a function of both the fluid characteristics and the shape of the jet [8-11].
Correlations for the convective heat transfer coefficient are a function of the ratio of the exit-to-impingement distance to the jet exit diameter (S/d) and the ratio of the diameter of the
![Figure 3 . 1 The Rocking curve of Si[333] with 18 keV x-ray](https://thumb-us.123doks.com/thumbv2/123dok_us/1733052.1221419/35.612.165.456.141.353/figure-rocking-curve-si-kev-x-ray.webp)