2923
Parametric Optimization Study of ABS Material Using
FDM Technique for Fatigue Life Prediction
N.Mohammed Raffic*
1, Dr.K.Ganesh Babu
2, Arjun Kumaran
3, Kiran G.R
41 Asst. Professor, Department of Mechanical Engineering, Nehru Institute of Technology, Coimbatore
2 Dean – Academic Affairs Bharath Institute of Engineering and Technology, Hyderabad, India,
3, 4
UG Scholar Department of Mechanical Engineering, Nehru Institute of Technology, Coimbatore
Email: [email protected], [email protected]
Abstract- Additive Manufacturing (AM) techniques have received more attention in today’s manufacturing scenario
due to its fascinating benefits to design and manufacturing engineers like no requirement of process planning and tool design, reduced lead time and highly skilled labour for its operation. The work presented in this paper, mainly focuses on optimizing the FDM process parameters for the Taguchi’s L9 Orthogonal Array based 3D printed ABS plastic sub-jected to rotating bending fatigue test. The three different parameters Infill Density, Layer Height and Print speed are considered for optimization. The results obtained from the experimental work are analyzed by Taguchi based Grey Relational Analysis procedure to find out the optimum process setting and the most significant factor over the output responses. The calculated values of MRPI by GRA have shown the optimum process setting for high Fatigue Strength with A1B3C3 (0.1 mm Layer Thickness, 80% Infill Density and a Print Speed of 75 mm/s).Through ANOVA it is ob-served that Layer Thickness is found to be most significant factor with contribution of 52.78% and Printing Speed is the insignificant factor over the output responses from the selected input variables.
Index Terms : ABS, Failure Cycles, Fused Deposition Modeling, Grey Relational Analysis, Rotating Bending
Fa-tigue Test1. INTRODUCTION
1.1 Fused Deposition Modelling (FDM)
Fused Deposition Modelling (FDM) is the low cost solid based rapid prototyping technique developed by Scott Crump in 1988 and the patent was awarded by USA in 1992. Stratsys Inc an USA based firm which leads in supplying FDM machineries with different ranges in according to the market need. As per the Global Scenario of Fused Deposition Modelling, Stratasys has got more than 60% market share of FDM in India and having more than 200+ FDM Systems Installed in Indian Market in various segments like Education, Defense, Government, Automotive, Aerospace, Consumer Goods and Heavy Industries. Balance 30% market share is of other RP Technologies. The Figure1 shows the percentage use of RP technology in various domains worldwide [1].
Figure1: Percentage Use of RP Technology World-wide
The principle of FDM is based on surface chemistry, thermal energy and layer manufacturing technology. Fused Deposition Modeling (FDM) is second most wide-ly used rapid prototyping technology, after Stereo-lithography (uses laser). In FDM a plastic filament is
2924 2. LITERATURE SURVEY
Ludmila Novakova et.al [4] 2012 have studied and re-ported the basic and advancement in the materials used for FDM process. The authors have stated that the basic materials for FDM process includes ABS plus, ABS-M30 , PC-ABS , PPSF and so on . They also reported that the FDM technique also uses some advanced metallic and ceramic materials for 3D printing includes Silicon Oxide, PZT, Aluminum Oxide, Hydroxypatite and Stainless Steel. Lamborghini is one customer which uses FDM technique to manufacture car parts with advanced FDM materials.
Sandeep Raut et.al[5] 2014 investigated the effect of FDM process parameters on mechanical properties and total cost of FDM parts. The authors have considered built orientation to find its effect over the mechanical properties such as tensile strength and bending strength or flexural strength. The authors have observed and con-cluded that parts built with Y-axis at 0° built orientation has good tensile strength and minimum cost and the parts fabricated with X-axis at 0° orientation has good flexural strength and medium cost.
Fahraz Ali et.al [6] 2014 have studied the effect of seven different FDM parameters such as Slice height, road width, raster angle, number of contours, air gap, STL deviation and angle over the parameters like build time , material usage and surface roughness of FDM built part. The authors have used L18 Orthogonal Array to build the parts by FDM and they have plotted Signal to Noise ratio for the results obtained and found the optimum values for all the seven different parameters. The authors have con-cluded that in order to minimize model build time larger slice height of 0.2540 mm , larger road width 0.6604 mm and positive air gap was more effective. The optimal values for build time, support and model material con-sumption are 13 minutes, 0.737 cm3 and 10.799 cm3, respectively. The optimal experimental values can bring a savings of 67% for model build time, 25% for support material, 33% for model material and 80% improvement of surface quality.
N.Mohammed Raffic et.al [7] 2017 have studied the ef-fect of FDM process parameters on vibration properties of PET-G and ABS plastics. The authors have considered Infill Density, Layer Thickness and Printing Speed with two different levels and created L4 Orthogonal Array using Minitab. The authors have prepared a specimen in rectangular shape and conducted impact hammer testing. The authors have observed that the changes in FDM pa-rameters have shown considerable effect in frequency and amplitude of the specimen. The authors have concluded that for ABS material 50 % Infill density , Layer thick-ness 0.15 mm and 55 mm/s speed are the optimized val-ues and for PET-G 100 % Infill density , Layer thickness 0.20 mm and 55 mm/s speed is optimum.
Madhuri Chaudhari et.al [8] 2018 have reported about the comparative study of parts built using FDM by varying Layer thickness , Infill density , Built orientation and Post processing treatment. By using those four parameters with three different levels L9 Orthogonal Array is
pre-pared and measured the surface finish of the specimens produced. The authors have plotted S/N ratio for PRSR Ra, Time and Cost. The authors have concluded that the use of soluble support is best suited compared to other
Mechanical testing of components is highly essential to ensure the reliability and durability of the parts produced by any manufacturing process. The various mechanical properties of any part that has to be verified are Tensile Strength, Compressive Strength , Fatigue Strength , Im-pact Strength and so on .The values of such parameters are generally evaluated by conducting experimental work rather than by using analytical methods. In the present study the number of failure cycles of a 3D printed ABS plastic specimen is considered for study. In order to eval-uate the above said parameter one of the standard test called Rotating Bending Fatigue test may be conducted. The term Fatigue can be understood when structures are derstand fatigue failure is rotating bending fatigue test. In rotating bending fatigue test to create a failure on the specimen, a constant-stationary force is applied on the specimen, which creates a constant bending moment. A stationary moment applied to a rotating specimen causes the stress at any point on the outer surface of the speci-men to go from zero to a maximum tension stress, back to zero and finally to a compressive stress. Thus, the stress state is one that is completely reversed in nature.
4. ORTHOGONAL ARRAYS (OA)
Taguchi Orthogonal Array (OA) design is a type of gen-eral fractional factorial design. It is a highly fractional orthogonal design that is based on a design matrix pro-posed by Dr. Genichi Taguchi and allows you to consider a selected subset of combinations of multiple factors at multiple levels. Taguchi Orthogonal arrays are balanced to ensure that all levels of all factors are considered equally. For this reason, the factors can be evaluated in-dependently of each other despite the fractionality of the design. In the present study three different parameters Layer Thickness (LT), Infill Density (ID) and Print Speed (S) are considered with three different levels. Hence 33 is the type of 3 Level design with three factors involved and L9 Orthogonal Array is considered. The Table1 shows the L9 Orthogonal Array design for three factors with three levels.
Table1: L9 Orthogonal Array
Trial
2925
The specimens are prepared by using Makerpi machine made from china which has a build envelope of 450 x 450 x 830 mm with bed size of 200 x 200 x 480 mm. The envelope temperature is maintained between 180° - 250°. The Figure.2 shows the Photographic view of three different levels and the same is being inputted to Minitab 18.0 for the preparation of Orthogonal Array (OA). L9 (33) Orthogonal Array is developed with Minitab 18.0 as the parameters are considered with three different levels for preparing the specimen.
Figure3: 3D Model of Fatigue Specimen
The Table 2 Shows the 3 different printing parameters and their levels considered. The specimen is of
cylin-drical form with a length of 180 mm and it has two di-ameters 12 mm at the holding portion and 10 mm at the centre region. The 3D model of the specimen is prepared by using CATIA V5R20 which is presented in the above Figure.3.
Based upon the input given to Minitab 18.0 the soft-ware has prepared the Orthogonal Array table for pre-paring the specimen and the specimens are prepared following the Minitab 18.0 Orthogonal Array Table. The specimens are prepared by using ABS filament of 1.75mm diameter by extruding through the nozzle with 0.4mm diameter in FDM machine. Table 3 shows the experimental design matrix as per L9 Orthogonal Ar-ray. The output responses considered are shown in Ta-ble 4.
Table2 : FDM Process Parameters and Levels
Printing Parameter Low
Table3: Experimental Design Matrix
Trial.No A B C A B C
Code Output Response Unit
R1 Model Building Time Mins
R2 No of Cycles to
Failure -
The 9 different specimens have been printed as per the experimental design matrix and the values of Model building Time and the cost for printing the specimen are tabulated in Table 5.
Table5: Model Building Time and Material Consumed
Trail No Building
Time (Secs) Cost (Rs)
2926
2 244 976
3 283 1132
4 103 412
5 123 492
6 143 572
7 72 288
8 86 344
9 98 392
6. EXPERIMENTAL SETUP
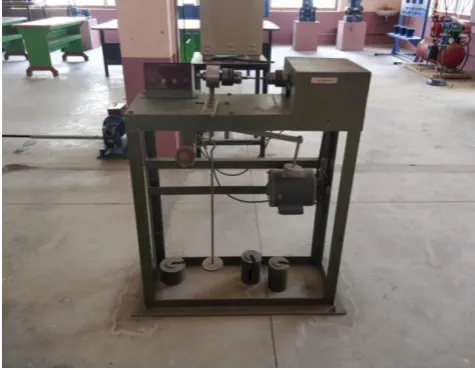
In the present work we have conducted a beam type test. The machine consists a DC electric motor for its operation to rotate the fatigue specimen. The machine has provision to add different loads ranging between 1Kg to 100 Kg to the specimen while rotating. The machine consist a cycle counter to count the number of revolutions that the specimen can rotate without fail-ure. The Figure 4 shows the experimental setup used for conducting the fatigue test.
Figure 4: Experimental Setup
7. EXPERIMENTAL PROCEDURE
In the present work the 9 different 3D printed speci-mens are tested for the number of cycles to failure by applying a constant load of 4 Kg. The specimens are fixed in the machine and rotated. The cycle counter fixed to the rotating specimen displays the number of rotations the specimen have withstood the load applied without undergoing failure. A stop watch is used to calculate the time taken by the specimens to undergo failure. The specimens have undergone failure by breaking into two parts at different regions of the spec-imen. The Figure 5 (a), (b), (c) shows the images of broken specimens 1-9. The Table 5 shows the number of failure cycles for the 9 different specimens and the time taken.
Table5: Failure Cycles and Time Taken Trial
No
Number of Cycles for
Time (Mins)
Failure
1 37819 482
2 54948 695
3 156200 1949
4 70439 914
5 125251 1632
6 59852 755
7 17708 132
8 49646 628
9 82236 1033
Figure5 (a): Fracture Regions of Specimen No 1, 2, 3
Figure5 (b): Fracture Regions of Specimen No 4, 5, 6
2927 8. ANALYSIS OF EXPERIMENTAL RESULTS
The data obtained through the specimen preparation and the experimental work are considered for statistical treatment using Taguchi approach to find out the respective influencing parameter. Taguchi’s method has been extensively used by many authors to optimize the process parameters of FDM [13].Grey Relational Analysis (GRA) is a technique which is commonly used along with Taguchi’s OA design data for finding out the optimal process settings. In the present work
GRA is used to find the optimal process settings by adopting the following steps [14].
Step 1: Calculate the Signal to Noise Ratio (S/N Ratio) by selecting the appropriate type. In case of Model Building Time (R1), Smaller the best is preferred and for the Number of Failure Cycles (R2) Larger the best is considered.
Step 2: Convert the calculated S/N ratio to its normalized form by using the standard equations.
Table6: S/N Ratio and Normalized Values
Table7 Deviation Sequence and Grey Relation Coefficient Trial
No
S/N Ratio Normalized S/N Ratio (xi)
R1 R2 R1 R2
1 -46.32 91.55 0.7712 0.3485 2 -47.75 94.80 0.8915 0.5201 3 -49.04 103.87 1.0000 1.0000 4 -40.26 96.96 0.2616 0.6342 5 -41.8 101.96 0.3911 0.8986 6 -43.11 95.54 0.5013 0.5594 7 -37.15 84.96 0.0000 0.0000 8 -38.69 93.92 0.1295 0.4735 9 -39.82 98.30 0.2246 0.7053
Trial No
DeviationSequence Grey Relation Coefficient (
R1 R2 R1 R2
1 0.2288 0.6515 0.6861 0.4342
2 0.1085 0.4799 0.8217 0.5103
3 0.0000 0.0000 1.0000 1.0000
4 0.7384 0.3658 0.4037 0.5775
5 0.6089 0.1014 0.4509 0.8314
6 0.4987 0.4406 0.5006 0.5316
7 1.0000 1.0000 0.3333 0.3333
8 0.8705 0.5265 0.3648 0.4871
2928 For the Smaller-the-better (SB) condition,
xi (k) = (1)
For the Larger-the-better (LB) condition,
xi (k) = normalized value from the equations 1 and 2
Step 3: Calculate the Deviation Sequence for R1 and R2 using equation 6.3
= x0(k) – xi(k) (3)
Step 4: Calculate the Grey Relation Coefficient by us-ing the standard relation
(4)
Step 5: Calculate the Grey Relation Grade and consider the same as Multiple Response Performance Index (MRPI)
Step 6: Find the average values of MRPI for the indi-vidual factors and the larger value implies the optimal parameter values and calculate the Mean MRPI to find out the optimal process settings.
Step 7: Conduct ANOVA to find out the influence of controllable factors on the responses at 5% significance level (i.e., 95 % confidence level based on F value and
P-value). A P-value of < 0.05 means that the factors have high influence on the responses.
The Table 7 shows the calculated Deviation sequence and Grey Relation coefficient for the Reponses R1 and R2
The Table 8 shows the Grey Relational Grade for the respective trials
Table8: Calculated Grey Relational Grade Trial No GreyRelational
From the calculation of Grey Relational Grade and its ranking the trial no 3 holds the top rank and trial no 7 holds the last rank. The obtained value of GRG has to be considered as MRPI in Grey Relational Analysis method. The larger MRPI value implies the optimum process setting. The mean MRPI values are calculated to find the best level in individual factors. From the calculation of Mean MRPI it is found that A1B3C3 (0.1 mm Layer Thickness , 80% Infill Density and Print Speed 75 mm/s). The Table 9 shows the calculat-ed Mean MRPI values.
Table 9: Mean Multiple Response Performance Index
Factors Levels three factors. It is observed that Layer Thickness is the most influencing factor than Infill density and Print Speed with a maximum contribution of 52.78%. The P-value of Layer Thickness and Infill density are less than 0.05 and considered to be significant factors. The print speed has got P-value less than 0.05 is considered to be insignificant as per ANOVA results. The regres-sion equation for MRPI is used for calculating the pre-dicted values of MRPI to plot a graph between the cal-culated and predicted for different trials .Table 10 shows the MRPI Experimental and Predicted values and they are in good agreement. The Table 11 shows the ANOVA results of different factors and their sig-nificances.
2929 Table10: MRPI Experimental and Predicted
Trial
The following conclusions may be drawn from the ex-perimental work and further statistical analysis car-ried out
1. Through Taguchi based Grey Relational Analysis the optimal process setting is found to be A1B3C3 (0.1mm Layer Thickness, 80% Infill Density and Print Speed 75 mm/s) for the higher fatigue strength of the material and Trial No 3 is found to have the same process settings which also have shown the maximum value for the number of cycles to failure.
2. The optimal settings for low model building time are found to be A3B1C1 (0.3mm Layer Thick-factor than infill density and speed.
4. As per ANOVA results , the factor A (Layer Thickness) is found to have maximum contribu-tion of 52.78% which is in good correlacontribu-tion with Mean MRPI value calculated
5. ANOVA results have revealed that Layer Thick-ness and Infill Density are significant factors with P-value less than 0.05 and Printing Speed is found to be the insignificant factor with P-value more than 0.05.
REFERENCES
[1] Ojas Dandgaval , Pranita Bichkar, Rapid Prototyping Technology - Study of Fused Deposition Modeling Technique, International Journal of Mechanical And Production Engineering. 2016; Volume 4 : 44-47.
[2] Pranjal Jain, A. M. Kuthe , Feasibility Study of manu-facturing using rapid prototyping: FDM Approach, The Manufacturing Engineering Society Internation-al Conference, MESIC 2013, Spain. 2013; 4-11. [3] N.Mohammed Raffic ,Dr. K.Ganesh babu ,
Palaniappan P. L, RajeshKannan P, Santhanabharathi N S, Venkatramanan S, Effect of FDM Process Pa-rameters in ABS Plastic Material, International Jour-nal on Mechanical and Production Engineering.2017; Volume 3:14-23.
[4]LudmilaNovakova-Marcincinova, Ivan Kuric , Basic and Advanced Materials for Fused Deposition Mod-eling Rapid Prototyping Technology , Journal of Manufacturing and Industrial Engineer-ing.2012;Volume 11: 24-27.
[5] Sandeep Raut,VijayKumar S. Jattib, Nitin K. Khedkar,T.P.Singh, Investigation of the effect of built orientation on mechanical properties and total cost of FDM parts, 3rd International Conference on Materials Processing and Characterisa-tion.2014;1625-1630.
[6] Fahraz Ali , Boppana V. Chowdary , Justin Maharaj, Influence of Some Process Parameters on Build Time, Material Consumption, and Surface Rough-ness of FDM Processed Parts:Inferences Based on the Taguchi Design of Experiments, Proceedings of The 2014 IAJC/ISAM Joint International Confer-ence, Florida.2014.
[7] N.Mohammed Raffic , Dr. K.Ganesh babu , ManojKannan.M , Arul Mani.G , Nandhu Krish-nan.R , Midhuvin George , Effect of FDM Process Parameters on Vibration Properties of Pet-G and ABS Plastics, Internationanal on Mechanical and Production Engineering.2017;Volume 3:28-38. [8] Madhuri Chaudhari, Bhagwan F. Jogi , R.S Pawade
2930 [9] Cany Mendonsa, KV Naveen, Prathik Upadhyaya,
Vyas Darshan Shenoy,Influence of FDM Process Pa-rameters on Build Time Using Taguchi and ANOVA Approach, International Journal of Science and Re search.2015;Volume 4 :330-333.
[10] C.A. Griffiths, J. Howarth, G. de-Almeida Row-botham, A. Rees , Effect of build parameters on pro-cessing efficiency and material performance in fused deposition modeling, The Second CIRP Conference on Biomanufacturing.2016;28-32.
[11] Nitesh Kumar Dixit, Rajeev Srivastava, Rakesh Na-rain, Comparison of Two Different Rapid Prototyp-ing System based on Dimensional Performance us-ing Grey Relational Grade Method, Global Colloqui-um in Recent Advancement and Effectual Research-es in Engineering, Science and Technology (RAEREST 2016),Kottayam ,India.2016;908-915. [12] Vishal N. Patel , Kamlesh P. Kadia , Parametric
Optimization of The Process of Fused Deposition Modeling In Rapid Prototyping Technology- A Re-view, International Journal for Innovative Research in Science & Technology.2014; Volume 1:80-82.
[13] Ludmila Novakova-Marcincinova, Jozef Novak-Marcincin, Verification of Mechanical Properties of ABS materials used in FDM Rapid Prototyping Technology, Proceedings in Manufacturing Sys tems.2013;Volume 8:87-92.
[14] Palanisamy Angappan , Dr Sivasankaran Subbarayan , Taguchi-based grey relational analysis for modeling and optimizing machining parameters through dry turning of Incoloy 800H , Journal of Mechanical Science and Technology.2017; 4159-4165.
[15] RajendraDarbar ,Prof. D. M. Patel ,Prof. Jaimin Patel Process Parameters Optimization Of FDM Process and Application Of Taguchi Approach And ANN – The Review, International Journal of Engineering Research and Applications (IJERA).2013;Volume 3:743-746.