OpenCommons@UConn
Doctoral Dissertations
University of Connecticut Graduate School
7-26-2019
Linear Methods for Joint Analysis of Multivariate
Genomics Data
M. Henry Linder
University of Connecticut - Storrs, [email protected]
Follow this and additional works at:
https://opencommons.uconn.edu/dissertations
Recommended Citation
Linder, M. Henry, "Linear Methods for Joint Analysis of Multivariate Genomics Data" (2019).Doctoral Dissertations. 2272.
Genomics Data
Matthew Henry Linder, Ph.D. University of Connecticut, 2019
ABSTRACT
The rise of Big Data has enabled sophisticated analysis of the human genome in unprece-dented detail. Large datasets are now collected as a matter of routine, and their scope spans multiple data types and multiple functional units at the molecular level of the cell. The breadth and depth of these data offer the opportunity for complex experiments and extensive structural modeling. But, given the intricacies of these data and the nuanced challenges they pose, robust and rigorous methods are essential to ensure the value and validity of the resulting scientific research. In this dissertation, we consider statistical methods for networks, applied to signaling pathways in the human genome. We construct joint, integrative models that employ a variety of data types simultaneously. These pathway models provide a unified approach to analysis of genetic, epigenetic, transcriptomic, and other types of genomic data, and incorporate function-ally meaningful biological relationships. In particular, we propose a new pathway model that integrates non-coding micro RNAs, proteins that play a regulatory role with respect to genes. We also propose methods to address obstacles that arise in the course of real-world research. We consider missing data, a fundamental reality of -omics Big Data due to variability in data quality and experimental design. We adapt a low-rank method for matrix completion to apply
to bioinformatic datasets with arbitrary patterns of missing data. We apply the imputation and pathway methods to a large-scale research study that profiles more than 30 cancer types. We also propose an algorithm to identify important subnetworks within large signaling pathways, in order to hone our understanding of the drivers of complex diseases. Through the use of interactive data visualization and analysis, we promote access to -omics analyses. Taken together, these methods provide a suite of tools that empower biological research using -omics data. Our methods span functional genomic models, address real-world problems in data analysis, and seek to make analysis of complex datasets more tractable, all while maintaining a statistically sound foundation.
Genomics Data
Matthew Henry Linder, B.A., M.S.
A Dissertation
Submitted in Partial Fulfillment of the Requirements for the Degree of
Doctor of Philosophy at the
University of Connecticut 2019
Copyright by
Matthew Henry Linder
APPROVAL PAGE
Doctor of Philosophy Dissertation
Linear Methods for Joint Analysis of Multivariate Genomics
Data
Presented by
Matthew Henry Linder, B.A., M.S.
Major Advisor Yuping Zhang Associate Advisor Ming-Hui Chen Associate Advisor Zhiyi Chi Associate Advisor Lynn Kuo University of Connecticut 2019
Dedication
To my mother Deborah, who taught me to love learning.
To my father Brett, who showed me how to think, inside and outside of the box. To my brother Andrew, my role model for adventure and exploration.
Acknowledgements
I thank the Department of Statistics for the financial and intellectual support necessary to earn this Ph.D. I would also like to thank Utility Operations & Energy Management at the University’s Facilities Operations for ample opportunities to apply the statistics I learned to real-world problems.
Thank you to Jaya Wen for her never-ending emotional, intellectual, and logistical support. Without her, I might not have begun a Ph.D., and certainly would not have finished it.
Thank you to Nitis Mukhopadhyay for the passion with which he taught me mathematical statistics; his humor; and the joy he brings to the classroom and those he teaches.
Thank you to Haim Bar for instruction in applied statistics, as well as consulting—in particular, for introducing me to R Shiny, and cheering me on along the way.
Thank you to Jun Yan for nurturing my interest in computing, and permitting me the freedom to learn on the job.
Thank you to Nalini Ravishanker for her generosity with her time and willingness to col-laborate with me. In particular, I am grateful for her masterful intuition for organization and logistics, and her encouragement that I dream big.
Thank you to Ming-Hui Chen for mentorship and friendship. So much of my experience of graduate school was enriched and enlivened by his instruction, influence, and inspiration. I cannot imagine this journey without him as a guide, role model, and companion.
Contents
Dedication iii Acknowledgements iv 1 Introduction 1 1.1 Overview . . . 1 1.1.1 Literature . . . 4 1.2 Overview of Datasets. . . 51.2.1 The Cancer Genome Atlas. . . 5
1.2.2 Pathway Interaction Database . . . 10
1.3 Dissertation Outline . . . 10
2 Network models for integrative pathway analysis 13 2.1 Pathway analysis for -omics observations of gene activity. . . 15
2.2 miRNA-gene targeting . . . 19
2.2.1 miRNA-gene target dataset . . . 22
2.2.2 Data processing. . . 23
2.2.3 Method . . . 24
2.2.4 Results . . . 28
3 Low-rank imputation of -omics missing data 49
3.0.1 Structured matrix completion . . . 52
3.1 Integrated iterative imputation . . . 54
3.2 Results. . . 58
3.2.1 Simulations . . . 58
3.2.2 EMC-NetGSA . . . 64
3.2.3 miRNA-EMC-NetGSA analysis of breast tumor subtypes . . . 81
3.3 Discussion . . . 88
4 Interactive data visualization and analysis 91 4.1 Interactive visualization for pre-defined pathways . . . 92
4.2 Interactive pathway analysis for subpathway identification . . . 97
4.2.1 Greedy algorithm. . . 99
4.2.2 Algorithm performance . . . 102
4.2.3 Analysis: results and visualization . . . 105
4.2.4 Interactive analysis . . . 111
4.3 Discussion . . . 113
5 Concluding Remarks and Future Research 116 5.1 Concluding Remarks . . . 116
5.2 Future Research . . . 118
List of Tables
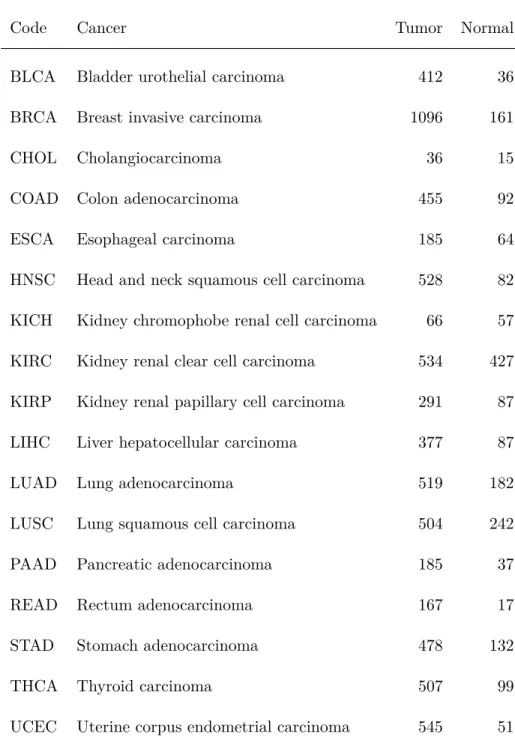
1 Sample sizes for cancer and control populations in data for 32 cancers from The Cancer Genome Atlas (TCGA). The cancer “code” is an abbreviation for each cancer. All samples are from tissue in the afflicted, cancerous region. For the cancer population, tissue samples are from tumorous tissue. For the normal population, tissue is from healthy normal tissue. Cancers marked with a star (?) were included in the analysis of pathway disturbance, on the basis of each sample population including more than 10 samples. . . 8
2 In-degree by BRAF pathway gene, for edges into the gene from miRNAs. Values count the number of edges into a given gene from any miRNA. . . 41
3 TCGA cancer types used for BRAF signaling pathway data analysis. Given are the TCGA cancer code abbreviation, cancer name, and sample population sizes for tumor and normal tissue samples. Only TCGA cancers with gene expression observations for all 10 BRAF pathway genes, as well as more than 10 samples in each population, were considered. . . 42
4 Breast tumor subtype definitions and prevalence in data from The Cancer Genome Atlas (TCGA). IHC status refers to immunohistochemical status for the three specified genes. Prevalence measures a proportion. . . 67
5 Pairs of cancer and pathway for which the residual from a regression of the logit(p)-value was negative, and larger in magnitude than a Bonferroni-adjusted critical value. In sarcoma, we observe 8 disturbed pathways; in thymoma, we observe 2 disturbed pathways; and we observe 1 pathway disturbance in each of kidney renal clear cell carcinoma, ovarian serous cystadenocarcinoma, and pancreatic adenocarcinoma. . . 79
6 Breast tumor molecular subtype sample sizes and prevalence in the TCGA dataset. Also given are the overall sample size of all tumors and healthy breast tissue. . . 83
7 Subpathways which were consistent between the expression-only and integrated analyses, and contained three or more genes. Cancers are labeled according to the codes in Table 1 (BLCA is bladder urothelial carcinoma; BRCA is breast invasive carcinoma; LUAD is lung adenocarcinoma; and THCA is thyroid car-cinoma). p gives the total number of genes in the pathway, while q gives the number of genes in the subpathway. . . 106
8 Subpathways that recurred exactly in multiple pathways for the same cancer, under the EMC-NetGSA analysis. Cancer gives the cancer code from Table 1 (KIRP is kidney renal papillary cell carcinoma; LUAD is lung adenocarcinoma; THCA is thyroid carcinoma). q is the number of genes in the subpathway, and
List of Figures
1 Sample sizes for TCGA populations with more than 10 samples. . . 8
2 A toy example of the integrated graphGmiEMC. White vertices (labeled “G”) are
gene expression nodes, which specify a signaling pathway topology. The three miRNA nodes (red, labeled “mi”) target the genes, and methylation and copy number nodes integrate the multi-platform, gene-level data (black and grey, respectively). . . 28
3 A simulated five-level binary tree signaling pathway. Shown is the treatment net-work, which consists of: a full five-level binary tree of genes (large grey nodes); miRNA targeting 1, 2, and 3 genes (colored red, yellow, and green, respectively); and methylation and copy number nodes (white and black, respectively). Gene “G01” corresponds to the root node, which is the first level of the binary tree; “G02” and “G03” the second level; and so on. All integrated edges, that is, those from miRNA, methylation, or copy number nodes, are directed into the relevant gene node. . . 30
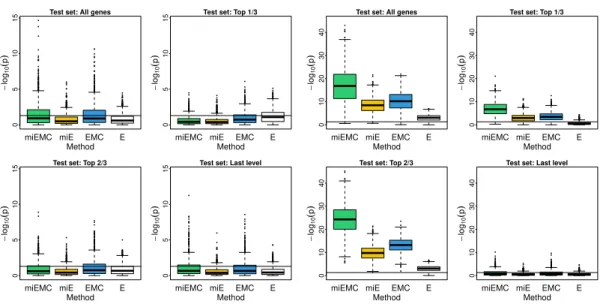
4 Boxplots of −log10p-values from simulation study. The left-hand panel shows significance tests for four gene sets of interest, under the first mean scenario in which no -omics features exhibit differential activation. The right-hand panel shows the second mean scenario, in which the top two-thirds of the simulated binary tree signaling pathway is differentially activated, but the final third is equal in the control and treatment populations. miEMC-NetGSA is shown in green, miE-NetGSA in yellow, EMC-NetGSA in blue, and NetGSA (“E”) on expression only in white. . . 33
5 Network diagrams for the BRAF signaling pathway. The left-hand network is the directed graph representing the BRAF genetic signaling pathway, consisting of 10 genes with 12 directed edges between. The right-hand network contains the same 10 gene vertices, but edges represent a shared miRNA parent. In other words, two genes that share an edge are both targets of a single miRNA, and possibly several. The graph contains 25 such edges. miRNA-gene targets are chosen as those entries in the mirDIP database with with an “very high” confidence score. Neither the BRAF nor MAP2K2 genes are targeted by any miRNAs. . . 36
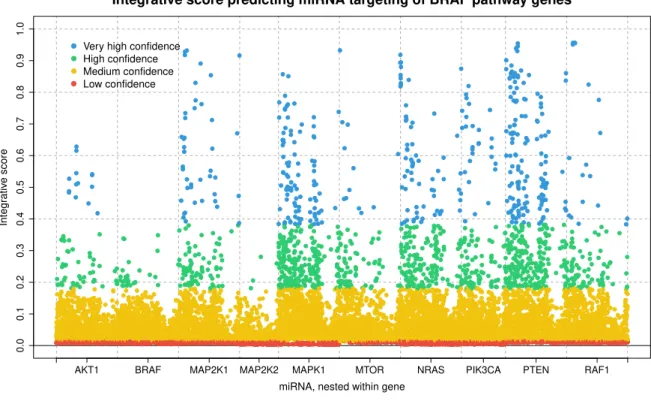
6 miRNA-gene interaction scores for all miRNA in TCGA dataset that target any of the 10 genes that comprise the BRAF pathway. Scores are grouped by gene, and colored by confidence class: very high, high, medium, and low confidence are colored blue, green, yellow, and red, respectively. For our data analysis, we included only miRNA-gene target interactions with “very high” confidence that the interaction exists, i.e., the blue scores. . . 38
7 Topology of subnetwork of the integrated BRAF signaling pathway correspond-ing to the unweighted adjacency matrixA?mi in Equation 2.9, namely, the graph formed by miRNA-gene targets. All edges are directed from the miRNA ver-tex to the gene verver-tex. The miRNA node colors, edge widths, and edge colors correspond to the degree of the miRNA vertex, that is, the number of genes in the BRAF pathway targeted by a given miRNA. Grey graph nodes are genes, while colored graph nodes are miRNAs, targeting 1 gene (red), 2 genes (yel-low), 3 genes (green), 4 genes (blue), and 5 genes (purple). The genes BRAF and MAP2K2 are not targeted by any genes. Darker edge colors correspond to higher out-degree of the associated miRNA. . . 40
8 Results of significance tests for pathway disturbance in the BRAF pathway, across 17 TCGA cancers. Barplots give values of−log10p-values, after Benjamini-Hochberg adjustment for multiple comparisons. Full gene expression miRNA expression, and gene-level methylation and copy number is shown in green (“miEMC”); integration of gene and miRNA expression is in yellow (“miE”); integration of gene expression and gene-level methylation and copy number is in blue (“EMC”); and the original, expression-only NetGSA results are in white (“E”). The horizontal dotted line gives the significance threshold at theα = 0.05 level. . . 44
9 Test statistics for pathway disturbance in 17 TCGA cancers, for the BRAF pathway. Barplot heights give the test statistic value. miEMC-NetGSA is in green, miE-NetGSA in yellow, EMC-NetGSA in blue, and NetGSA (“E”) in white. 45
10 Iterative integrated imputation with a toy example. X is a data matrix of 5 observation vectors with missing values that do not form a rectangle. Iteratively for each column with missing elements xi (i = 3,4,5), we apply structured
matrix completion to the matrixχi, consisting of all complete data vectors;xi;
and any columns with missing values that are a subset of those missing from
xi. Imputation is performed on the entire rectangular submatrix of all features
missing in xi, with any observed elements not from xi treated as missing. So, imputing x3 and x4 uses x5, whereas x5 is imputed using only the complete
11 Boxplots of−log10(p)-values for simulation study tests of pathway disturbance. Network structure is a binary tree. X(shown in blue) represents EMC-NetGSA applied to the complete data matrix, with no missing values. X˜ is the matrix with all samples with any missing values dropped. I3 (in green) refers to our integrated, iteratively imputed matrix. SMC uses imputed values obtained by treating the entire minimal covering submatrix as missing, and KNN isK = 10-nearest neighbors imputation. Horizontal line gives −log10(0.05). Scenario 1
(left): No features differential. Scenario 2 (right): Top 2/3 features differential. 61
12 Simulation results for missing data in a rectangular submatrix, using the sec-ond mean scenario in which the top 2/3 of binary tree nodes are differentially expressed. In this special case, our iterative imputation method (I3, in green) has identical power to that of the basic SMC method. . . 63
13 −log10(p)-values for integrative tests of network disturbance in genetic signaling pathways. Shown are pathways that changed significance after imputation in at least one sample population. Separate differential analyses were performed for each of four breast cancer subtypes, as well as a composite population of all tumors. . . 68
14 −log10(p)-values for significance tests of integrated genomics data for the entire Smad2 / Smad3 signaling pathway and selected genes, by subtype. Gene-level significance tests considered integrated triplets of pathway nodes, namely, ex-pression, copy number, and methylation observations for each gene.. . . 70
15 Coefficient estimates for expression in the Smad2 / Smad3 signaling pathway, by subtype. Selected genes shown only. Coefficients were estimated separately by population (cancerous tumor and healthy control). Within the tumor popu-lation, separate estimates were obtained using the raw data with missing data removed, and using the imputed data. . . 71
16 Expression coefficient estimates for a selected subset of Smad2 / Smad3 sig-naling pathway genes, by subtype. Coefficients were estimated separately by population (cancerous tumor and healthy control). Within the tumor popula-tion, separate estimates were obtained using the raw data with missing data removed, and using the imputed data. . . 73
17 Shown is the−log10(p) transformation of the BH-adjustedp-values obtained for 22 TCGA cancer types among 173 NCI PID pathways. Darker colors indicate stronger significance, in terms of a smallerp-value. A white value indicates the pathway was not tested for that cancer. We observe strong patterns of increased significance across all pathways within individual cancers, such as elevated sig-nificance in sarcoma (SARC) and thymoma (THYM) and reduced sigsig-nificance in colon adenocarcinoma (COAD) and rectum adenocarcinoma (READ). We also observe patterns in significance within pathways, across cancers, such as elevated differential activity in B-cell receptor (BCR) signaling, and a lack of disturbance in the glypican 2 and 3 networks. . . 76
18 −log10(p)-values for the EPHA forward signaling pathway. Axis labels indicate the integration scheme: miEMC is miRNA-EMC-NetGSA; miE is miRNA and expression only; EMC is EMC-NetGSA; and E is NetGSA on gene expression only. . . 84
19 Network-adjusted expression parameters for EPHA4 in healthy tissue and tumor subtypes. Integration of miRNA data only substantially alters the parameter estimates for all subtypes, in terms of both magnitude and sign. But, joint integration of miRNA, methylation, and copy number data clarifies and high-lights the difference between the ER- HER2 over-expressed subtype and the ER+ luminal subtypes, as well as the basal subtype. . . 85
20 −log10(p)-values for the BCR pathway. Integration of miRNA data alone cap-tures only marginal significance in the basal subtype. But, integration of miRNA in conjunction with gene methylation and copy number boosts the signal in basal subtypes, as well as the others, compared with integration of methylation and copy number without miRNAs. . . 86
22 −log10(p)-values (top) and signed test statistics (bottom) for the signaling events mediated by focal adhesion kinase pathway, in sarcoma cancer tumors. These plots were generated procedurally using an interactive data visualiza-tion applicavisualiza-tion, publicly accessible online. Shown are the results of hypothesis tests for the full pathway, as well as the -omics features for each individual gene, tested as separate subpathways. The pathway analysis was performed on a fully-integrated dataset consisting of expression, methylation, and copy num-ber, using the EMC-NetGSA model; expression and methylation (EM-NetGSA); expression and copy number (EC-NetGSA); and expression alone (NetGSA). . 95
23 Interface components for interactive data visualizations. Top left: Pathway graph topology visualization, EMC-NetGSA analysis of breast cancer subtypes.
Top right: Inference outputs: p-values and test statistics, EMC-NetGSA
pan-cancer analysis. Bottom left: Coefficient estimates, miRNA-EMC-NetGSA anal-ysis of breast cancer subtypes. Bottom right: Coefficient estimates, miRNA-EMC-NetGSA pan-cancer analysis. . . 97
24 Pathway for “signaling events mediated by PRL.” The subpathway genes are shown in yellow (seed node) and orange. This subpathway of three genes was obtained from bladder urothelial carcinoma (BLCA), and was identified consis-tently in the NetGSA and EMC-NetGSA analyses. . . 107
25 Results of greedy algorithm for subpathway discovery, using NetGSA with ex-pression values only (top), and integrated EMC-NetGSA (bottom). The sub-pathway search was initialized using the single most significantly-disturbed gene in the pathway. The subpathway was expanded by including adjacent genes that increased the subpathway’s significance. Counts of gene occurrence in subpath-ways for any signaling pathway, organized by cancer. Only genes that recurred in some cancer across four or more pathways are shown. Genes identified in this manner as “drivers” were broadly consistent in the two analyses. This suggests these driver genes contribute to subpathway activity in a robust manner, and are not merely spuriously significant genes. Integration of methylation and copy number resulted in a larger number of driver genes within each cancer. More-over, these significant driver genes do not recur in the same patterns across multiple cancers, which indicates differential functions for these genes across different cancers. . . 110
Chapter 1
Introduction
1.1
Overview
Systematic -omics research studies offer opportunities for comprehensive modeling of the hu-man genome at the molecular level. These studies produce rich datasets measured across hundreds of patients, providing not only biological insight into the healthy interoperation and function of the cell, but also the opportunity to compare and contrast healthy and diseased cells. Equipped with an improved understanding of the mechanisms that give genesis to com-plex diseases, researchers will be more targeted in the development of treatments based on specific molecular characteristics of disease, and clinicians will be better able to apply individ-ualized treatments.
Integrated datasets observed on -omics data types beyond gene expression allow for an unprecedented level of detail. The diversity of data available for study improves the detail with which to characterize functional processes that underlie the genome. Multi-view datasets are now routinely collected in multiple modalities across separate biological structures, and large-scale research studies are coordinated to increase the quality and quantity of data available to advance knowledge, treatment, and prevention.
it is critical to apply methods that are scientifically valid and statistically rigorous. Different data types can provide new insight into unique facets of genomic systems, and deepen un-derstanding of complicated biological functions. However, development of flexible statistical methods for these trends in research and next-generation data platforms has not kept pace with the speed of data collection. Moreover, the viability and validity of a statistical method does not equate with accessibility and interpretability. Expressive tools for functional analysis are critical to advance scientific understanding of the systems processes of the cell, and to develop and utilize novel treatments for complex diseases with distinctive genomic characteris-tics. Robust methods are essential to ensure scientific rigor and validity, and new experimental techniques require novel analytic tools grounded in solid statistical theory.
This thesis contributes to active research in integrative genomics and the study of complex disease by focusing on developing applied methods for biological analysis. Broadly, we consider pathway analysis of functional gene networks, and implement several analyses on multiple cancer types. In this introductory chapter, we provide an overview of literature related to integration of multi-platform data collected at the level of the gene, in particular integration of gene expression, methylation, and DNA copy number. We also review methods for pathway analysis. We then introduce the primary datasets used in our analyses, specifically a large-scale -omics dataset, and a source for known functional gene networks.
In Chapter 2, we discuss a model framework for pathway analysis of gene expression. We also discuss an integrative extension of that model that incorporates additional -omics data types collected at the level of genes. From these gene-level analyses, we progress to a novel pathway model by further integrating non-gene functional units, embedded within the same
pathway framework. Finally, we apply the fully-integrative analysis to an example signaling pathway across multiple cancer types.
In Chapter 3, we consider missing data that often afflicts even the most comprehensive -omics studies. A critical aspect of the analysis of genetic systems processes in a variety of different cancer types is the availability of complete data for analysis. To remedy missing data in -omics datasets, we consider an existing imputation procedure based on an assumption that large-scale -omics data matrices exhibit low rank. We highlight the shortcomings of the simple assumptions of that method. We propose a more comprehensive approach to accomplish imputation of missing data in arbitrary configurations. We then perform pathway analysis of breast tumor subtypes using the imputed dataset.
In Chapter4, we discuss the use of interactive data visualization for exploration of the out-put of pathway analysis for -omics Big Data. We provide an overview of a basic web application that we use for exploratory data visualization of pathway outputs from the integrative models discussed in Chapter2and implemented using imputed data from Chapter3. We discuss four implementations of the web application, for displaying pathway models with gene-level and miRNA-gene integration, applied to multi-cancer datasets as well as breast tumor subtypes. After reviewing the use of web applications for interactive data visualization, we discuss a computational approach to identify subpathways of interest within larger signaling pathway networks. We apply the approach to several datasets, and discuss the use of interactive tools for interactive analysis.
Finally, Chapter 5provides commentary on and discussion of the preceding chapters. We also discuss avenues for further work in integrative pathway analysis.
1.1.1 Literature
To match the complexity and novelty of -omics datasets, statistical methods have been devel-oped to model complex biological processes and to integrate multiple data types. The variety of approaches available for analysis of -omics data is rich, and may address different dimensions of genomic Big Data. Recent work has gone beyond simpler methods for statistical analysis, such as gene-set enrichment analysis (GSEA; Subramanian et al., 2005), to emphasize appli-cation of system-level models of biological processes. With respect to -omics datasets, basic approaches often focus on a single data type. Gene expression and clinical covariates have been applied to assess cancer survival outcomes across many different cancer types [Chandrashekar et al., 2017], which leveraged the large sample sizes that are be available.
Systematic statistical models provide a solid theoretical foundation for integrative analysis. Much work has been done to identify common signals across genomic features and -omics data types. The iCluster model of Shen et al. [2009] applies PCA-style dimension reduction for cluster analysis. PARADIGM [Vaske et al., 2010] uses network information to integrate -omics data via a latent factor model. DIG [Zhang et al., 2017b] is a statistical framework for estimating networks integrating multiple -omics data types and biological conditions. In their clinical study, Danielsen et al. [2015] integrated the results of multiple separate analyses by data type in an ad-hoc, manual fashion. This approach is typical of the literature.
Integrative analyses offer unified approach for joint analysis of a large number of genomic features across multiple data platforms. Linear methods have been applied to gene-level mea-surements of expression, methylation, and copy number within individual cancers [Network et al., 2017], emphasizing the aggregate information obtained from distinct data platforms. In
addition to using integration to increase knowledge of molecular processes, integrative analysis has also been applied with a focus on clinical survival outcomes across multiple cancers [Liu et al., 2018].
Pathway analysis offers a more systematic, structural approach to modeling genomic pro-cesses [Yan et al., 2017]. Pathway analysis incorporates knowledge of biological network struc-ture into statistical models of expression. Pathway models such as the NetGSA model [Shojaie and Michailidis, 2009] (discussed in detail below) exploit results from graph theory to account for co-expression due to pass-through effects from features with differential activity to those that are not.
1.2
Overview of Datasets
1.2.1 The Cancer Genome Atlas
The Cancer Genome Atlas (TCGA) [Tomczak et al., 2015] is a long-running international study, funded by the National Cancer Institute (NCI), to collect observations of cancerous tissue in more than 30 cancers and across multiple distinct -omics data platforms. We downloaded the TCGA data from the NCI Genomic Data Commons (GDC; Grossman et al., 2016), using the TCGA-Assembler software, v2.0.0 [Zhu et al., 2014, Wei et al., 2017].
We obtained level-3 TCGA data for 33 cancers. The data were collected from individ-ual subjects, and we obtained subject-level covariates that included sex, survival outcomes, and other phenotypic information. Within a single subject, multiple tissue samples may be obtained. For a given cancer, the tissue was collected from the anatomical region that corre-sponds with the cancer type. For example, breast cancer data was collected from breast tissue.
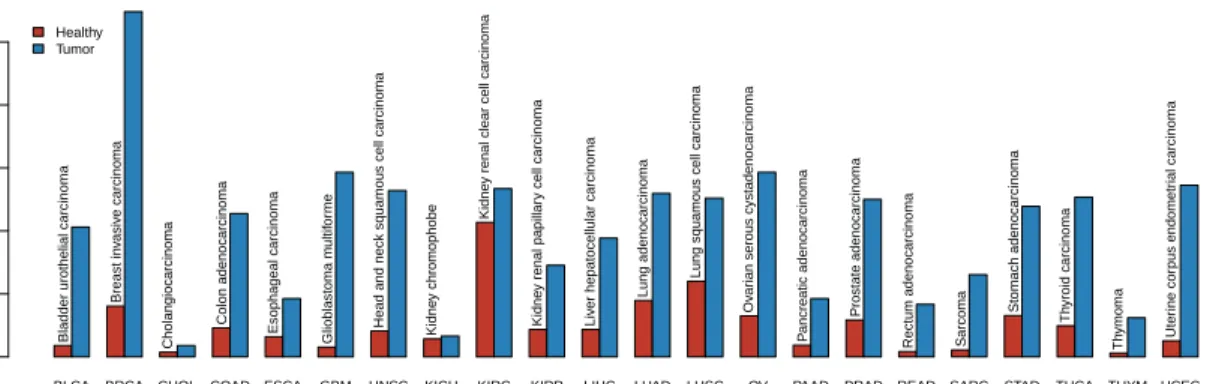
Tissue samples were classified at the time of collection as belonging to one of more than one dozen tissue types. The population sample sizes are given in Table 1. The samples sizes for populations with at least 10 samples are shown in Figure 1. The data exhibit a systematic imbalance between the two populations, with the number of tumor sample consistently higher than the number of healthy samples.
Sample sizes
Cancer Code Cancer Normal
Adrenocortical carcinoma ACC 92 5
Bladder urothelial carcinoma? BLCA 412 36
Breast invasive carcinoma? BRCA 1096 161
Cervical squamous cell carcinoma and endocervical adenocarcinoma CESC 308 8
Cholangiocarcinoma? CHOL 36 15
Colon adenocarcinoma? COAD 455 92
Lymphoid neoplasm diffuse large B-cell lymphoma DLBC 48 0
Esophageal carcinoma? ESCA 185 64
Glioblastoma multiform? GBM 586 31
Head and neck squamous cell carcinoma? HNSC 528 82 Kidney chromophobe renal cell carcinoma? KICH 66 57 Kidney renal clear cell carcinoma? KIRC 534 427 Kidney renal papillary cell carcinoma? KIRP 291 87
Brain lower grade glioma LGG 516 0
Lung adenocarcinoma? LUAD 519 179
Lung squamous cell carcinoma? LUSC 504 240
Mesothelioma MESO 87 1
Ovarian serous cystadenocarcinoma? OV 586 130
Pancreatic adenocarcinoma? PAAD 185 37
Pheochromocytoma and paraganglioma PCPG 179 5
Prostate adenocarcinoma? PRAD 500 117
Rectum adenocarcinoma? READ 167 17
Sarcoma? SARC 261 22
Skin cutaneous melanoma SKCM 104 3
Stomach adenocarcinoma? STAD 478 131
Testicular germ cell tumors TGCT 150 0
Thyroid carcinoma? THCA 507 99
Thymoma? THYM 124 12
Uterine corpus endometrial carcinoma? UCEC 545 51
Uterine carcinosarcoma UCS 57 6
BLCA BRCA CHOL COAD ESCA GBM HNSC KICH KIRC KIRP LIHC LUAD LUSC OV PAAD PRAD READ SARC STAD THCA THYM UCEC Cancer type Sample siz e 0 200 400 600 800 1000
Bladder urothelial carcinoma
Breast in v asiv e carcinoma Cholangiocarcinoma Colon adenocarcinoma Esophageal carcinoma Gliob lastoma m ultif or me
Head and neck squamous cell carcinoma
Kidne
y chromophobe
Kidne
y renal clear cell carcinoma
Kidne
y renal papillar
y cell carcinoma
Liv
er hepatocellular carcinoma Lung adenocarcinoma
Lung squamous cell carcinoma
Ov
ar
ian serous cystadenocarcinoma
P
ancreatic adenocarcinoma
Prostate adenocarcinoma
Rectum adenocarcinoma Sarcoma
Stomach adenocarcinoma Th yroid carcinoma Th ymoma Uter ine cor pus endometr ial carcinoma Healthy Tumor
Figure 1: Sample sizes for TCGA populations with more than 10 samples.
Table 1: Sample sizes for cancer and control populations in data for 32 cancers from The Cancer Genome Atlas (TCGA). The cancer “code” is an abbreviation for each cancer. All samples are from tissue in the afflicted, cancerous region. For the cancer population, tissue samples are from tumorous tis-sue. For the normal population, tissue is from healthy normal tissue. Cancers marked with a star (?) were included in the analysis of pathway disturbance, on the basis of each sample population including more than 10 samples.
For our analysis, we downloaded and considered tissue collected from either “primary solid tumor” or “solid normal” tissue. We constructed sample populations from these two tissue types, so the populations permit comparison of tumorous and healthy tissue from the same location. Because of their situation within the corresponding tissue, we refer to the non-tumor
samples as matched normal tissue.
For each tumor and matched normal tissue sample, we obtained multi-platform -omics data, collected on the following platforms.
1. Gene expression was measured on the Illumina HiSeq RNASeqV2 platform. Level-3 TCGA data was available as both raw read counts, and a normalized format. The latter is provided as fragments per kilobase of transcript per million mapped reads (FPKM), normalized as the upper quartile (UQ) of nonzero counts [Dillies et al., 2013, Grossman et al., 2016], or FPKM-UQ. We used these normalized values rather than the raw read counts.
2. DNA copy number variation (CNV) was collected using the Affymetrix Genome-Wide Human SNP Array 6.0 platform. We used data with germline copy number variants removed.
3. DNA methylation was measured using the HumanMethylation450 BeadChip. Observa-tions are organized at the level of CpG sites.
We also obtained micro RNA (miRNA) observations that were collected on the Illumina HiSeq platform. We defer details of miRNA data processing until Section2.2below.
We performed additional data processing after downloading from TCGA, prior to analysis.
1. We applied a log2 transformation to the RNASeq data.
2. We averaged gene-level CNV by DNA region.
1.2.2 Pathway Interaction Database
Much of the analysis that follows is oriented toward network analysis of genetic signaling pathways. To this end, we downloaded the 212 signaling pathways that comprise the NCI Pathway Interaction Database (PID, Schaefer et al., 2008). To obtain the PID, a collection of known gene networks specified as directed, functional relationships between genes, we used thegraphitesoftware [Sales et al., 2018] within R.
The PID pathways are defined over 2393 genes, which correspond to 2369 genes observed on 6973 -omics features in the TCGA dataset, across the three gene-level platforms for expression, methylation, and copy number. In particular, within each data type, we observed 2363 genes with expression measurements, 2279 genes with methylation, and 2331 genes with copy number. Of the 212 pathways that comprise the PID, 173 pathways were such that observations of expression were available for every gene in the pathway. The number of missing genes per pathway was one gene for 32 pathways, two genes for four pathways, three genes for one pathway, and four genes for two pathways.
1.3
Dissertation Outline
In this thesis, we considered several methods and procedures oriented towards integrative pathway analysis. These methods not only offer statistical models for signaling pathways that integrate multiple -omics data types, but also address real-world obstacles to applications, including missing data, effective communication and exploration of statistical output, and a computational method to identify important subpathways in known pathways.
diseases. We discussed some contemporary research in integrative genomics. We introduced a large-scale, ongoing research study, The Cancer Genome Atlas (TCGA), that provides access to multi-platform genomic data on cancer. We also discussed a dataset of signaling pathways, the NCI Pathway Interaction Database.
In Chapter2, we gave an overview of approaches to pathway analysis of functional networks of genes. We gave an overview of a basic pathway model, NetGSA, as well as EMC-NetGSA, an integrative adaptation that jointly models gene expression, methylation, and copy number. We then introduced non-coding micro RNAs (miRNAs), and discussed their role in gene regulation. We introduced a dataset of functional miRNA-gene target relationships, and we proposed an extension of EMC-NetGSA that also includes miRNAs. This approach provides a secondary mechanism to account for correlation across genes beyond the graph topology of the signaling pathway. We demonstrated the method on an example pathway, using the TCGA dataset.
In Chapter3, we presented a procedure to impute missing data in integrative genomics. We applied a matrix completion method in an iterative fashion, imputing non-rectangular missing data in a way that uses all available information in a genomic sample. Our approach permits application of a theoretically-appealing model for imputation to real-world data. We applied pathway analysis to the imputed data, and demonstrated through simulation the increased power of our strategy, with a smaller rise in false discoveries than the original SMC method. We demonstrated that the I3 method improves the precision of the basic SMC method, while still leveraging the linear dependencies that make SMC attractive in the first place.
Our data analysis demonstrated the power to stabilize coefficient estimates of subtypes, despite small sample sizes. Furthermore, it reinforced the importance of subtype analysis of
tumors, rather than across entire populations. Among the pathways in the NCI Pathway In-teraction Database, we found many possible pathway disturbances. Some of these pathways play known roles in breast cancer, which supports evidence of disturbance in other path-ways not previously known. The FOXA2 and FOXA3 transcription factor networks and the ErbB2/ErbB3 signaling events pathways, in particular, displayed pathway disturbances that have been relatively unexplored in breast cancer. Based on the results of the simulation study and the data analysis, iterative integrated imputation (I3) struck a balance between local ac-curacy and global structural constraints when imputing missing data. We demonstrated the bias introduced by the assumption that missing data occurs in blocks, and we propose a pro-cedure based on SMC that includes the original block-missing SMC as a special case, while flexibly handling non-rectangular missing data. Our method imputed values that permit anal-ysis of datasets with missing data, without providing imputed values that distort the output statistical analysis.
In Chapter 4, we discussed the challenges posed by large-scale data analysis of -omics Big Data. We reviewed some existing approaches to interactive data visualization, and we provided details of an interactive data visualization that gives access to our own pathway analysis of the previous chapters. We also discussed subpathway discovery, for the purposes of identifying important subnetworks among a broader pathway network. We proposed a greedy search algorithm, and implemented the procedure on both expression-only and integrated datasets. We also discussed the combinatoric and computational challenges posed by subgraph searches, and gave details of an interactive analysis tool that permits user-specified subpathway analysis.
Chapter 2
Network models for integrative
pathway analysis
In this chapter, we discuss pathway analysis for -omics data that comprise known signaling pathways. These pathways are specified as known, directed graphs, with graph vertices that represent -omics features, and directed graph edges that represent known functional relation-ships.
Application of GSEA to genes a priori known to comprise a signaling pathway can give comparative insight into patterns of differential activity across multiple cancers [Ge et al., 2018]. But, more mature pathway methods have been introduced and applied. The random walk with restart has been applied to assess both network cohesion and compare the explanatory power of several different pathway databases [Huang et al., 2018]. The SAFE model [Baryshnikova, 2016] identifies local neighborhoods of high enrichment situated within larger networks. A factor model approach, PARADIGM, was applied to a single unified network of multiple signaling pathways [Vaske et al., 2010], and has also been used for comparative analysis of individual pathways across cancer types [Campbell et al., 2018]. Graphical methods have also been developed, for directed as well as undirected Gaussian networks [Ma et al., 2014b].
In Section 2.1, we provide an overview an overview of the NetGSA framework for joint modeling of gene expression observations that correspond to the vertices in a graph for a ge-netic signaling pathway. The framework also offers hypothesis testing of differential expression between two populations, which we situate within the context of cancer and healthy popula-tions. We also discuss an integrative refinement of the NetGSA model, EMC-NetGSA, which provides a joint model for several -omics data types observed at the gene level.
A natural fusion combines data integration and pathway analysis. This has been applied to comprehensive analysis of individual signaling pathway in a single cancer using gene-level covariates including expression, methylation, and copy number, and somatic mutations to analyze androgen receptor signaling[Robinson et al., 2015]. Also available for integration in pathway analysis is inclusion of non-gene features, like miRNA expression along with gene expression, methylation, and DNA copy number [Danielsen et al., 2015]. Pathway analysis has also been applied across multiple cancers and multiple pathways [Sanchez-Vega et al., 2018], and the Lemon-Tree model [Bonnet et al., 2015] used a module network model to integrate data and identify novel pathway components.
In Section 2.2, we propose a further extension of the EMC-NetGSA model to integrate -omics data collected for biomolecular units other than the gene, namely, non-coding micro RNAs. We implement and discuss a data analysis of the BRAF pathway to demonstrate the new integrative method.
2.1
Pathway analysis for -omics observations of gene activity
The NetGSA model, introduced by Shojaie and Michailidis [2009], offers a graphical model for joint modeling of gene expression. The model accounts for known functional dependencies between genes comprising a signaling pathway. As originally proposed, the model applied only to directed acyclic graphs (DAGs). The same model was shown by Shojaie and Michailidis [2010] to apply to a more general class of directed graphs. Moreover, that same work proposed a procedure to apply the basic NetGSA model to arbitrary directed graphs. The work of Ma et al. [2014b] extended the model further, to include undirected Gaussian networks.
Each of these iterations on the basic NetGSA framework focused on signaling pathway graphs and models of gene expression. The model was further extended by Zhang et al. [2017a] to the -omics setting. Their integrative EMC-NetGSA was so named because it provides a joint model for expression, methylation, and copy number data, each observed at the level of individual genes.
We proceed constructively. We start with a genetic signaling pathway specifying known functional relationships between p genes. We represent the pathway as a directed graph G =
{V,E}, whereV is a set ofp graph vertices, and E is a set of directed edges between elements of V. The graph vertices in V represent genes, while the edges in E represent the functional pathway interactions.
We represent the graph topology of Gby a p×pgraph adjacency matrix, denotedA?E. We use the subscript “E” to emphasize that the graph specifies relationships between vertices that represent measurements of gene expression. The element αjk of A?E takes the value 1 if there
may be interpreted as an indicator function for the conditional dependence of gene j on gene
k. Corresponding to each gene we observe gene expression, which we format as a vector with
p elements,yi1, where i= 1, . . . , N indexes each ofN independent samples.
For each element in yi1, we also observe copy number and methylation beta values for
the corresponding genes. Denote the vectors of methylation and copy number by yi2 and
yi3, respectively. The EMC-NetGSA integration procedure, proposed in Zhang et al. [2017a],
incorporates the methylation and copy number measurements into the graph topology ofG. In particular, we augmentGby adding 2pvertices toV, one each for methylation and copy number for every gene. We also add 2pedges toE, directed from the methylation or copy number vertex to the corresponding gene expression vertex. Therefore, the final EMC-NetGSA graph consists of two separate layers of network topology:
1. The primary, inter-gene signaling pathway network, giving edges between elements of
yi1;
2. A secondary integration network of edges between elements of yi2 oryi3, and the
corre-sponding elements in yi1.
Denote the full observation vector for sample i by yi123 = (y0i1,y0i2,y0i3)0. For some genes,
copy number or methylation values are unavailable, and in these cases, the number of copy number (methylation) observations inyi2 (yi3) will be less thanp. We resolve this by removing
the non-expression vertex fromV and the corresponding integrated edge fromE. Without loss of generality, we assume yi2 and yi3 each contain p elements, and adjust yi123 accordingly.
identity matrices along the right-hand margin and zero matrices along the bottom: A?EMC = A?E Ip×p Ip×p O2p×p O2p×p O2p×p (2.1)
whereO2p×p is a 2p×p matrix of zeros. Here, the identity matrices reflect the directed edges
from copy number and methylation vertices to expression, and the zero matrices reflect the lack of any network structure within or between the additional data types, or a directed relationship from genes to -omics features.
Each pair of vertices in {(j, k)|αjk = 06 }, where αjk is an element of A?EMC, specifies a
directed edge from yik toyij, i= 1, . . . , N, yik, yij ∈yi123. This is a conditional dependence
relation of vertexj on vertexk, given the effects of the other (3p−2) network features. In the context of Gaussian graphical models, conditional dependence of random variablesXj andXk,
conditional on a set Z of additional random variables of interest, is formalized as the partial correlation ρjk with respect toZ. That is,ρjk = corr(Xj\Z, Xk\Z), whereXj\Z =Xj− PZXj
is the orthogonal complement ofXj with respect toZ, andPZ is a projection ontoZ [Krämer
et al., 2009]. Intuitively, ρjk represents the association between -omics features j and k,
controlling for each of their associations with other features in the pathway. We estimate
ρjk by the sample partial correlation rjk, which is obtained by regressing each of Xj and Xk
separately on Z, and then calculating Pearson’s correlation coefficient between the vectors of residuals. Using the partial correlations and A?EMC, we construct the weighted adjacency matrixAEMC with elementsajk =rjkαjk,j, k= 1, . . . ,3p.
introduced by Shojaie and Michailidis [2009]. The influence matrix ΛEMC captures the
cumu-lative network effect of each gene on the expression of all others. In the case of directed acyclic graphs (DAGs), the authors derive the identityΛEMC = (I3p−AEMC)−1.
Shojaie and Michailidis [2010] extended this formula to apply to general, non-DAG graphs. In particular, they demonstrate that the relationship between the influence and adjacency matrices applies to any graph that is substochastic, which occurs when the adjacency matrix has eigenvalues all of which have magnitude smaller than 1. They apply a graph theoretic result, Gershgorin’s Disk Theorem, to obtain a limit approximation for the influence matrix when the adjacency matrix is not substochastic, in particular,
α(δ) = (αjk(δ))j=1,...,3p;k=1,...,3p, δ >0 (2.2) αjk(δ) = AEMCjk (P3p `=1|AEMCj`|) +δ (2.3) ΛEMC= lim δ→0(I3p−α(δ)) −1 (2.4)
Then, an approximation toΛEMC is constructed using a small value ofδ >0.
The EMC-NetGSA model usesΛEMC to structure the mean in a mixed-effects model with
unknown regression coefficients βEMC ∈ R3p, with Eyi123 = ΛEMCβEMC. We may interpret
βEMC as the network-adjusted expression coefficients for the 3p -omics features, and we note ΛEMC also structures the covariance ofyi123.
The NetGSA framework also provides for significance testing of two populations, control (healthy) and treatment (disease). Denote the population label for sample i as ci ∈ {C,T}.
ATEMC, corresponding to influence matricesΛCEMC,ΛTEMC, and parameterized with population-specific pathway-adjusted expression parametersβCEMC,βEMCT , respectively.
The EMC-NetGSA statistical model is then given by
yi123=Λci EMCβ ci EMC+Λ ci EMCγi123+i123, i= 1, . . . , N (2.5) γi123 ∼N3p(03p, σγ2I3p) (2.6) i123∼N3p(03p, σ2I3p) (2.7)
To test differential activity in subsets of the pathway’s genomic features, represented by elements of βEMCC and βEMCT , we specify features of interest through an indicator vector b. We use the NetGSA network contrast `EMC = (−b ·bΛCEMC,b·bΛTEMC) to compute the
test statistic TEMC ∝ `βEMC, where βEMC = (βC
0
EMC,βT
0
EMC) 0. T
EMC follows a Student’s t
distribution with degrees of freedom estimated by the Satterthwaite approximation.
2.2
miRNA-gene targeting
Bioinformatic data is increasingly collected from functional genomic units in the cell other than genes. These new genomic entities present new opportunities for integrative analysis, and include non-coding micro RNAs (miRNAs). These small, noncoding RNAs are understood to play a regulatory role for genes, and the identification of miRNA-gene targets is critical to understanding the biological function of each [Hammond, 2015].
However, to date, development of advanced statistical methods has lagged behind the rapid growth in experimental methods and available data. We address the lack of sophisticated
technical methods by proposing an integrated model for simultaneous network analysis of miRNA-gene target interactions and their association with genetic signaling pathways. We extend existing methods for graphical analysis of gene-level -omics data, specifically the EMC-NetGSA model, to include functional relationships between miRNAs and genes. In particular, we represent miRNA-gene target relationships through the same graphical structure as we used in the previous section to integrate methylation and copy number.
Individual miRNA are believed to target genes in a functional manner [Lewis et al., 2005], and it is often the case that single miRNAs target multiple genes. To model correlated gene activity due to a shared miRNA parent, miRNA-gene target interactions must be known and available to researchers. Early miRNA-gene target research validated individual targets exper-imentally, but the combinatoric problems introduced by large numbers of genes and miRNAs motivated meta-analytic and computational approaches. One study to identify miRNA-gene targets was miRTarBase [Hsu et al., 2010], which identified gene targets for fewer than 700 miRNAs by manual aggregation of experimental evidence. Despite the intensive cost of this type of study, the authors anticipated the use of small, manually-integrated datasets as inputs to computational approaches to identify interactions.
Computational resources such as the miRTar [Hsu et al., 2011] and miRDIP [Tokar et al., 2017] aggregate individual experimental findings on miRNA-gene target relationships. These centralized databases offer a starting point for more sophisticated functional analysis across datasets with thousands of genomic features, reducing the combinatoric burden of a purely computational association analysis between miRNAs and genes.
Early statistical analyses of miRNAs were characterized by straightforward statistical meth-ods. For example, the CORNA method introduced by Wu and Watson [2009] applied methods including the hypergeometric and Fisher’s exact tests to assess differential activity in miRNA-gene interactions and networks. Subsequently, miRNA analysis has gained popularity in appli-cation to cancer datasets. Enerly et al. [2011] studied miRNA suppression in a novel miRNA and gene expression breast tumor dataset. They observed roles played by miRNAs in genetic activity, immunohistochemical characteristics, and system-level cellular processes. Yu et al. [2019] identified specific biomarkers with differential survival outcomes in lung cancer. Li et al. [2018] used differential correlation analysis between miRNAs and genes in cancer and normal populations, which they applied across multiple distinct cancer types.
Joint analysis of separate functional components may integrate marginally univariate data, such as miRNA expression paired with gene expression [Chu et al., 2015]. But, multi-level integrative analysis is also performed, such as an analysis of breast and gynecological cancers including somatic mutations and copy number, gene expression, methylation, and multiple types of non-coding RNA [Berger et al., 2018].
The nature of miRNA research is foundationally integrative in nature, given the funda-mental nature of miRNA-gene interactions. Nevertheless, integrative analysis is not restricted to focus on the relationship between miRNAs and genes. Some researchers integrate epige-netic data, including Miao et al. [2017], who analyzed the relationship between miRNAs and DNA methylation in sheep. Du and Zhang [2015] integrated methylation in a small-sample analysis of lung cancer that also included expression in genes and miRNAs. Volinia and Croce [2013] applied a similar approach to breast cancer data. Transcriptomic data has also been
integrated: Cava et al. [2014] considered copy number as well as gene and miRNA expression. Modern informatic methods permit large-scale analyses to identify miRNA targets. Frame-works such as miRTarBase and DIANA-miRPath [Vlachos et al., 2015] utilize web interfaces to access and explore association analyses between miRNAs and genes. DIANA-miRPath adapts methods originally applied to gene expression. In addition to Fisher’s exact test, they also test for differential activity in miRNAs using the enrichment analysis method of Bleazard et al. [2015]. Computational approaches have been used to identify targets, too. Hsu et al. [2011] proposed miRTar, a successor to miRTarBase that used gene set enrichment analysis for signifi-cance testing of differential activity. These are often applied to specific phenomena or systems. Other databases include DIANA-TarBase [Karagkouni et al., 2017] and TargetScan [Agarwal et al., 2015]. Coll et al. [2015] used correlation analysis to find miRNA-gene targets related to cirrhosis of liver tissue. Godard and van Eyll [2015] performed pathway analysis of miRNA in the context of Alzheimer’s disease with an approach derived from enrichment analysis. But, methods for comprehensive, graph-theoretic pathway analysis remain undeveloped.
2.2.1 miRNA-gene target dataset
As described above in Section 1.2.1, it is straightforward to construct a direct mapping be-tween the basic methylation and copy number features, on the one hand, and a single gene, on the other. In contrast, no such standard, direct mapping exists between genes and miR-NAs. Instead, we use resources on functional miRNA-gene targets to construct an integrated statistical model. Substantial work has been done to identify miRNA-gene targets. One re-source that quantifies the degree of experimental evidence in support of a given miRNA-gene
target interaction is mirDIP. Tokar et al. [2017] compiled the database as a meta-analysis to integrate predicted miRNA-gene targets from 30 separate sources of experimentally-validated interactions. It includes information on the degree to which the source databases overlap in their conclusion.
2.2.2 Data processing
As discussed above in Section1.2.1, we aggregated expression, methylation, and copy number data at the level of individual genes. Similar to gene expression, miRNA expression data are available from TCGA in two formats: raw read counts, and normalized reads-per-million (RPM). Raw read counts were collected on the miRNASeq platform, and the TCGA processing pipeline outlined by Chu et al. [2015] is consistent with procedures in comparable projects, such as ENCODE [Consortium et al., 2012]. After alignment and read trimming, a library of approximately 22 base pairs of mature strands was used with an insert length of approximately 22.
Typical miRNASeq analyses use methods traditionally developed for RNASeq. For ex-ample, Stokowy et al. [2014] employed RPM normalization and cited its original definition from Mortazavi et al. [2008], in the context of gene expression. They cited other work that applies RPM normalization to miRNASeq data, including Chen et al. [2013]. Following RPM normalization but prior to the primary analysis, those authors applied a log2 transformation. Han et al. [2018] integrated gene and miRNA expression. They first applied FPKM-UQ nor-malization RNASeq gene expression values, then calculated RPM for miRNASeq values and transformed logarithmically. TCGA provides RPM normalized transformation of the data, so
for our integrative analysis, we applied a log2 transformation to the RPM-normalized values. Empirically, we observed that this normalization was comparable to FPKM-UQ applied to the raw read counts.
2.2.3 Method
Integration of miRNA observations into the NetGSA framework proceeds from a known set of functional miRNA-gene target relationships. In addition to the signaling pathway topology represented in the adjacency matrix A?E, we also consider g miRNAs with known functional targets among thepgenes observed inyi1. For each sample, we observe a vector ofgelements yi4,i= 1, . . . , N, the values of which measure miRNA expression.
To represent the miRNA-gene target interactions, we construct ap×ggraph adjacency ma-trixA?mi, with columns that correspond to miRNAs and rows that correspond to genes. Then, as before in the NetGSA and EMC-NetGSA models, the element τj` of A?mi is an indicator
value for miRNA`targeting genej,j = 1, . . . , p,`= 1, . . . , g. Here, we have represented each miRNA-gene target as a directed edge, andτj`=1(Genej is conditionally dependent on miRNA`).
We construct an integrated adjacency matrixA?miEthat includes both the signaling pathway and the miRNA-gene targets:
A?miE= A?E A?mi Og×p Og×g (2.8)
which is a square (p+ g) ×(p +g) matrix with elements taking values of either 0 or 1. Correspondingly, we integrate the graph G by adding g vertices to V, one for each miRNA.
For each miRNA-gene target, we add toE a directed edge from the miRNA vertex to the gene vertex.
Then, we use the EMC-NetGSA method to construct a fully-integrated adjacency matrix, by augmenting V to contain a total of (3p +g) vertices, and adding the corresponding 2p
additional edges from the methylation and copy number vertices to the corresponding gene expression vertex.
Mechanically, this integration scheme produces another, fully-integrated adjacency matrix,
A?miEMC, which composesA?miE with identity matrices:
A?miEMC= A?E Ip×p Ip×p A?mi O(g+2p)×p O(g+2p)×p O(g+2p)×p O(g+2p)×g (2.9)
whereOm×nis am×nmatrix of zeros. The identity matrices reflect that the network topology
consists of (1) directed edges between elements ofyi1, and (2) directed edges from elements in yi2,yi3,yi4 to associated elements inyi1. In particular, we do not model any directed network effect from genes to any of miRNAs, methylation, or copy number vertices. As before, without loss of generality, we consider the full (g+ 3p)×(g+ 3p) adjacency matrixA?miEMC, with the knowledge that its true dimensionq is such thatq ≤(g+ 3p).
We may interpret the network adjacency matrix specified in Equation2.9as a composition of three distinct network layers: (1) a primary network specified between elements of yi1; (2)
a miRNA-gene integration layer giving directed network relationships, possibly many-to-one, from miRNA elements of yi2 to gene elements of yi1; and (3) a within-gene integration layer
element inyi1. Therefore, the graph represented byA?miEMCsimultaneously provides for causal
relationships between genes due to the signaling pathway; correlation between genes due to miRNA-gene targeting; and reduces the statistical noise associated with observations of gene expression by removing effects due to epigenetic and transcriptional factors. Moreover, each of these three components is motivated by scientific understanding of the complex functional processes that produce the observed genomic features.
For expositional clarity, we definem= (g+ 3p) and denote the full observation vector ofm
elements byyi = (y0i1,y0i2,y0i3,y0i4)0. Writing A?≡A?miEMC, denote the elements ofA? byδjk,
j, k= 1, . . . , m. Depending on the location of δjk inA?, j and kmay index vertices for gene
expression, miRNA expression, gene copy number, or gene methylation. Each pair of vertices indexed by{(j, k)|δjk 6= 0}corresponds to a directed edge from yik toyij,i= 1, . . . , N.
Then, the fully-integrated NetGSA model is
yi=Λciβci+Λciγ
i+i, i= 1, . . . , N (2.10)
γi∼Nm(0m, σγ2Im) (2.11)
i ∼Nm(0m, σ2Im) (2.12)
where, again, ci ∈ {C,T} indexes the sample population as either control (healthy) or
treat-ment (cancer). Here, γi is a sample-level random effect.
Inference proceeds as with the expression-only NetGSA model, and the integrated EMC-NetGSA model: We test for differential activity in subsets of the pathway features, correspond-ing to elements in βC,βT, by indicating the features of interest in an indicator vectorb. The
NetGSA network contrast is `= (−b·bΛC,b·bΛT), and this yields a test statistic T ∝`β,
β= (βC0,βT0)0. T follows a Student’s tdistribution with degrees of freedom estimated using Satterthwaite’s approximation.
We may also characterize the miRNA integration into the network topology through a set-theoretic lens, rather than the previous focus on the adjacency matrix. We again proceed from a signaling pathway defined on p vertices. Denoting the set of expression nodes by VE
and the set of signaling pathway edges by EE, we characterize the signaling pathway as the directed graphGE={VE,EE}.
Next, we consider the set of gmiRNAs known to target the p genes inVE. Denote the set
of miRNAs by Vmi, which represent observations miRNA expression, and the set of edges for the miRNA-gene targets byEmi. The elements ofEmiare directed edges defined from a miRNA vertex inVmito a gene vertices inVE. Then, we may consider the integrated miRNA-expression
graphGmiE={VmiE,EmiE}, whereVmiE=VE∪ Vmi, and EmiE=EE∪ Emi.
For each gene, we define two additional vertices, one for methylation and the other for copy number. Denote the sets of methylation and copy number vertices byVMandVC, respectively.
We integrate these vertices with the vertices of VE by constructing edge setsEM, EC, each of which contains p edges. Without loss of generality, we consider a single index j = 1, . . . , p, which relates the p gene-level observations in VEMC = VE∪ VM∪ VC, such that νEj ∈ VE
gives the expression vertex for genej,νMj ∈ VM gives the methylation vertex for genej, and νCj ∈ VC gives the copy number vertex for genej.
Denote the final, joint graph by GmiEMC={VmiEMC,EmiEMC}, whereVmiEMC=VE∪ Vmi∪ VM∪ VC and EmiEMC =EE∪ Emi∪ EM∪ EC. To illustrate the integrative graph topology, we
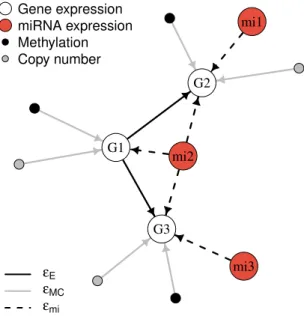
show in Figure 2 a toy example. In this example, we set p = 3 and g = 3. The signaling pathway is a 2-layer binary tree that contains a root node with two child nodes. These gene expression nodes are labeled with “G”. Two of the miRNAs target one gene each, while the third miRNA targets all three genes. miRNAs are labeled “mi”. Finally, for each gene, the toy graph contains one methylation vertex and one copy number vertex.
G1 G2 G3 mi1 mi2 mi3 Gene expression miRNA expression Methylation Copy number εE εMC εmi
Figure 2: A toy example of the integrated graph GmiEMC. White vertices (labeled “G”) are gene expression nodes, which specify a signaling pathway topology. The three miRNA nodes (red, labeled “mi”) target the genes, and methylation and copy number nodes integrate the multi-platform, gene-level data (black and grey, respectively).
2.2.4 Results
First, we use a simulation study to demonstrate the improved power of our method due to the integration of miRNA-gene target information. We then apply our method to the TCGA
dataset for pathway analysis of the BRAF signaling pathway.
Simulations
Our simulation study follows the template of the simulations in the EMC-NetGSA paper [Zhang et al., 2017a]. Broadly, we construct a pathway composed of a binary tree signaling pathway; we model miRNA-gene targets that drive correlated gene expression; and we integrate the methylation and copy number within genes. This supplies three separate layers of network information that may contribute to gene expression, and we examine the relationship between -omics integration and statistical power.
We modeled a signaling pathway consisting of a five-level binary tree containing 31 genes. We integrated miRNA with directed edges from miRNA to corresponding genes. For every gene, we added three distinct miRNA vertices, i.e., each had out-degree 1. We then partitioned the genes in V into disjoint sets of two, proceeding from the root node. We assigned to each pair of genes one shared miRNA, i.e., with out-degree 2. Finally, we repeated this procedure for sets of three genes. We assigned each triplet one miRNA with out-degree 3. The network topology for the control population signaling pathway used the same integrated binary tree structure, with all edges in the tree’s left branch removed. For EMC-NetGSA integration, we add to G directed edges into each gene from two vertices representing methylation and copy number.
The network topology of the simulated binary tree is shown in Figure 3. We set the corre-lation between expression vertices to 0.8 in the top third (two levels) of the tree; association is 0.5 in the middle third (third level); and association 0.2 in the final third (final level).
G01p G02p G03p G04p G05p G06p G07p G08p G09p G10p G11p G12p G13p G14p G15p G16p G17p G18p G19p G20p G21p G22p G23p G24p G25p G26p G27p G28p G29p G30p G31p Gene
miRNA targets 1 gene miRNA targets 2 genes miRNA targets 3 genes Methylation
Copy number
Figure 3: A simulated five-level binary tree signaling pathway. Shown is the treatment network, which consists of: a full five-level binary tree of genes (large grey nodes); miRNA targeting 1, 2, and 3 genes (colored red, yellow, and green,