Abstract—today, it is widely recognized that electricity is needed for society mobility. But traditional electricity sources that are relatively using fossil energy resources will not be able to address supply and demand in rural areas which are scattered over huge geographic distances. Solar power is one of solutions for those problems concerning environmental impact and emissions. This paper aims to map out trade-off between generations of solar cells that were ever invented. Various materials display varying efficiencies and costs so that materials must have characteristics matched to the spectrum of available light. This paper also describes a comparative value chain of solar power to evaluate activities within and around and relates them. From those value chain, then areas in Indonesia are discussed to know where can be used as a source for material constituent of solar PV to reduce the dependence on imported raw materials. This paper also discusses about trends in global PV supply and demand to measure global market shares of PV system. In addition, this paper also describes about solar financial to discuss the economics of solar modules.
Index Terms— electricity, solar energy, solar finance source area, value chain
I. INTRODUCTION
OLARpower, also known as solar photovoltaics (PV), has received a lot of attention recently in the wake of growing environmental concerns [1]. It converts the sun’s energy into electricity, which can be used to run household appliances and lighting [2]. PV technologies use both direct and scattered sunlight to create electricity. However, the amount of power generated by a solar system at a particular site depends on how much of the sun’s energy reaches it. Thus, PV systems, like all solar technologies, function more efficiently in the place which receives the greatest amount of solar energy [3].
Solar PV electricity has enormous potential. It can be a reliable and pollution-free producer of electricity [4] -[5]. It will save nearly two tonnes of carbon dioxide every year on a 4 kilowatts peak (kWp) solar PV system [2]. It does not
This work is supported by Program of HIBAH RISTEK FY 2013; Decree of The State Ministry of Research and Technology (No. 187/M/KP/XI/2013, Nov. 7, 2012).
W. Sutopo and D. I. Maryanie are with the Laboratory of Logistics System and Business, Department of Industrial Engineering, Sebelas Maret University, Surakarta, 57126, INDONESIA (+6281548747464; e-mail: [email protected])
A. Purwanto is with the Department of Chemical Engineering, Sebelas Maret University, Surakarta, 57126, INDONESIA (e-mail: [email protected])
M. Nizam is with the Research & Dev. for Indonesia Electric Vehicle Consortium Team Sebelas Maret University and with the Department of Mechanical Engineering, Sebelas Maret University, Surakarta, 57126, INDONESIA (e-mail: [email protected]).
only combat global climate change through the significant reduction of greenhouse gas emissions, but also contribute substantially to global energy security by consuming free sunlight as renewable resources [6] -[7]. Solar electricity also provides a cost-effective power supply in locations where it is expensive or impossible to send electricity through the conventional power lines [3]. Besides that, PV systems can be designed to meet any electrical requirement, no matter how large or how small it is, because of their modularity [8].
To compete with fossil fuels, there are two challenges to be met for renewable energies, like solar energy. They are increasing efficiencies and reducing production costs [9] -[10]. The key component for both efficiency and production cost is in the types of solar cell technology itself, especially in its module technology [3].
In accordance with the development of science and technology, the types of solar cell technology have been developed with a range of innovations. These innovations which are usually called by generations, are done to get solar cell which is highly efficient, cheap and easy to be made [11]. It has to be studied to determine what generation that is the most suitable for solar cell technology in emphasizing on the infrastructure, sources and the effects to the environment.
This research aims to map out trade-off between generations of solar cells that were ever invented. Then, in order to be able to capture more value and to mitigate the inherent risks of the supply chain [12], this paper also describes the solar value chain to evaluate activities within and around and relates them, which value each particular activity adds to the solar power. It is crucial to build strong partnerships with others in the value chain because close coordination across the value and supply chains is key to moving things forward [13]. Based on this value chain, it will be identified about the supply chain of solar energy to know which areas in Indonesia that can be used as a source for material constituent of solar PV. This paper also describes about solar financial to discuss the economics of solar modules. Then, this paper will discuss about trends in global PV supply and demand. They are important measurement that can be used to determine the international competitiveness in global market shares of PV system.
II. GENERATIONS OF SOLAR CELLS
Solar cells, as the basic building blocks of a PV system, consist of semiconductor materials [14]. Various materials display varying efficiencies and costs. Materials for efficient solar cells must have characteristics matched to the spectrum of available light. Only sunlight of certain wavelengths will work efficiently to create electricity. PV systems can still
A Comparative Value Chains Analysis of Solar
Electricity for Energy
Wahyudi Sutopo, Dwi Indah Maryanie, Agus Purwanto and Muhammad Nizam
produce electricity on cloudy days, but not as much as on a sunny day [15].
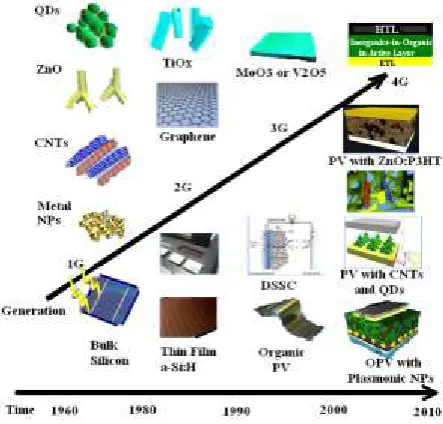
[image:2.595.97.245.133.250.2]The performance of PV is measured in terms of its efficiency at converting sunlight into electricity [3]. There are a variety of solar cell materials available, which vary in conversion efficiency. They are usually divided into four main categories called generations.
Fig. 1. Comparison of efficiency and production costs between generations of solar cells.
A. First Generation
The first generation includes cells consisting of silicon or germanium, that are doped with phosphorus to get silicon material type n and boron to get silicon material type p, in a pn-junction [16]-[17]. This generation is dominating the commercial market. It contains solar cells that have a quite high efficiency, but are relatively expensive to produce compared to the power output, due to very pure silicon is needed [17]. So many researchers assume that the solar cell from first generation is inefficient to be alternative energy sources.
Bulk silicon is separated into multiple categories according to crystalline and crystal size in the resulting ingot, ribbon, or wafer. They are monocrystalline silicon (c-Si), polycrystalline silicon, ormulticrystalline silicon, (poly-Si or mc-(poly-Si), ribbon silicon, and mono-like-multi silicon [18]-[19].
B. Second Generation
The second generation is solar cell used from thin film technology. Thin-film technologies reduce the amount of material required in creating the active material of solar cell in order to decrease the cost of making solar cells [20]. They only need less than 1 % silicon materials if compared to the materials for wafer silicon type [21]. Although this generation contains types of solar cells that are much cheaper to produce, such that the cost per watt is lower than in first generation cells, but they have not become mainstream solar products due to their lower efficiency and corresponding larger area consumption per watt production [20].
Cadmium telluride (CdTe), Coper indium gallium selenide (CIGS) and amorphous silicon (a-Si) are three thin-film technologies often used as outdoor photovoltaic solar power production [20]. CdTe technology is most cost competitive among them. CdTe technology costs about 30% less than CIGS technology and 40% less than A-Si technology in 2011 [22].
C. Third Generation
Many research attempts to make cheaper solar cells so that they led to this third generation technology. This generation is the technology of manufacturing of solar cells
from polymer materials, or also usually known as organic solar cells and photo electrochemical solar cells. Solar cells made from organic materials such as polyphenylene vinylite organic semiconductors and fullerenes [23]. This generation is usually called by dye-sensitized solar cells (DSSC) [24].
Although this third generation solar cells still have a big problem in terms of efficiency, age of active cells still too short [24], and is not yet commercial, but there is a lot of research going on in this area. This type of solar cells will be able to have a huge impact in the next ten years given the price and the manufacturing process that would be very cheap.
D. Fourth Generation
Solar cell from fourth generation is based on ‘inorganics-in-organics’, offers improved power conversion efficiency to third generation solar cells, while maintaining their low cost base [25]. This generation defined combine –within a single layer– the low cost and flexibility of conducting polymer films (organic) with the lifetime stability of novel nanostructures (inorganic), and leverage the properties of these new, hybrid active materials for performance beyond that of the third generation device [26].
For renewable energies, like solar energy, to compete with fossil fuels, there are two challenges to be met that are increasing efficiencies and reducing production costs. The comparisons efficiency and production costs between generations of solar cells are shown in fig. 1 [9]. Then, the changes materials from the first generation (1G) to the last generation (4G) are displayed in fig. 2 to describe about the development of solar cells nowadays [25].
Fig. 2. The changes from first generation (1G) to fourth generation (4G)
III. VALUE CHAIN AND SOURCE AREAS
A. Value Chain of Solar Cells
The value chain of solar cells needs to be studied for evaluating activities within and around and relates them so that it will be known what activities will give value added to the photovoltaic technology. The value chain of electric car batteries is found in Fig. 3 [27].
[image:2.595.316.538.418.630.2]Countable Indicated Identified Hypothetical SiO2
(ton) (ton) (ton) (ton) (%)
1 North Sumatera 225.430 94,08
2 Riau 5.405.175 1.300.000 85.100.000 99,51
3 West Sumatera 780.000 10.772.110 3.751.000.000 Good
4 South Sumatera 59.350.653 11.575.000 8.327.836 14.951.100 87,4-99,68
5 West Java 11.043.092 10.252.000 73,54-99,33
6 Central Java 572.189 886.737 14.050.000 68,37-96,00
7 East Java 1.168.854 2.725.000 89,65-98,8
8 West Borneo 330.950.000 96,65-99,63
9 South Borneo 810.700 49.000.000 97,99-99,50
10 East Borneo 4.000.000 not identified
11 South Sulawesi 95.530.000 90,00-97,17
Province No
Composition %
SiO2 72,92
Al2O3 14,73
K2O 6,17
CaO 2,31
Na2O 1,59
MgO 0,65
No Region Total (billion tons)
1 Central Borneo 88,4
2 Sumatera (Aceh, Lampung, Bangka, Belitung) 327,5
3 West Java 2700
4 Papua 21,5
[image:3.595.365.480.710.809.2]3137,4 Total
Fig. 3. The solar cells value chain
The solar value chain consists of several distinct steps, starting with the extraction of quartzite through to the production of solar modules which are used in systems to generate electricity from the sun. Beginning from the first column, a compound of silicon and oxygen in the form of quartz sand or quartzite must be changed to obtain silicon only. To obtain it, oxygen must be removed from quartzite at high temperature. The next column is mixing quartzite with carbon (in the form of coal, charcoal and petroleum coke) and wood chips in an electric-arc furnace and heated at temperatures up to 2,5000C. The intense heat allows the
oxygen to migrate from quartzite to carbon, leaving liquid silicon to collect at the bottom. The result of this step is Metallurgical-grade silicon (Si). In order to purify Mg-Si further to solar grade silicon, Mg-Mg-Si is transformed into a feed liquid called trichlorosilane (TCS).
Next, high purity TCS and hydrogen are fed into a thermal deposition reactor, where it solidifies on heated rods, in order to obtain solar-grade polysilicon (Poly-Si). Solar grade Poly-Si has a purity of 99,9999% or higher. Then, Poly-Si are melted down and crystallized to form multisilicon blocks (Casting Process) or round monocrystalline ingots (Czochralsky process). The ingots are cut into bricks to achieve the desired shape. These are then sliced into ultra-thin wafers. In order to enhance conductivity of silicon material, certain impurities are deliberately introduced into it, a process also known as “doping”.
Solar cells, otherwise known as photovoltaic cells, are the units that collect the sunlight and convert light into usable electricity. These are the building elements of modules. Solar modules are clusters of solar cells soldered together on a plate. This is followed by encapsulation under a sheet of glass. Lastly, a power socket is installed on the reverse side of the module. The final column of the chain is aligning modules in large numbers to create industrial scale solar power plants or used individually for residential use.
B. Sources of Material
Indonesian government statistics show that only 65% of Indonesia’s 240 million citizens have access to electricity. Because the large population is distributed on over 17.000 islands, some of the villages, especially in the easternmost
region, are not connected to the National Grid [28] -[30]. It is difficult task to make the installation and operation of electrical grids in those locations, on islands that are not easily accessible.
The conditions for solar energy are perfect in Indonesia, as the country is blessed with daily sunshine. Solar energy potential in Indonesia is 4,8 kWh/m2 per day of 1.906.240
km2, Indonesia will receive 91.499 Twh per day [31]. It is
based on how many kilometers would be used to generate electricity from the solar cell.
Not only focus on its technology, but also on the availability of raw materials for solar cells. It is expected that the raw materials do not depend on import. In terms of potential solar cell material is quartzite sand (silica), according to the latest data of The Ministry of Energy and Mineral Resources in 2008, there are mineral deposits which reached 17.491 billion tons of quartz sand, scattered in various locations in Indonesia [31].
The quality of silica in each region is different. Quality silica which has reached 99% is equivalent to the metallurgical grade silicon. It is usually found in the province of Riau. Table 1 below shows data for silica potential in various provinces in Indonesia [32].
TABLE I
DATA FOR SILICA POTENTIAL IN VARIOUS PROVINCES IN INDONESIA
Besides data in table 1 above, there are data from the Central Bureau of Statics about the total silica deposits in Indonesia that is about 3137,4 billion tons, which can be seen in table 2 below [32].
TABLE II
TOTAL DATA FOR SILICA IN VARIOUS REGIONS IN INDONESIA
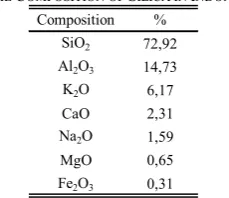
Generally, silica located in Indonesia has predominant compositions that are silicon oxide (SiO2), alumina oxide
(Al2O3) and potassium oxide (K2O) with varied levels for
each region in Indonesia. The compositions of silica found in Indonesia can be seen in table 3 below [32].
TABLE III
With those potential, Indonesia should begin to improve in support of national energy security. Now, the solar cell market is still dominated by silicon solar cells, both mono and multi-crystal silicon. A market non-silicon solar cell is expected to rise to 13 % of the total production of solar cells in the next 10 years because of the relatively lower cost of production [33]. Non-silicon solar cells are partly based thin film solar cell, organic solar cells and polymer, and dye-sensitized solar cell (DSSC). Research on the type of solar cell based on dye technology such as low-sensitized solar cell –DSSC– began to be studied for development in Indonesia [31], [34] -[38], because this type of solar cells do not require high-tech equipment for the fabrication process so that with these conditions, the researchers in Indonesia could also participate in the part of the DSSC development world and also for the possibility of mass production locally. The Indonesian government expects to generate 25% power from renewable sources by 2025. With the new solar projects, the government hopes for more of its citizens to an electrical supply source [29].
IV. SUPPLY AND DEMAND
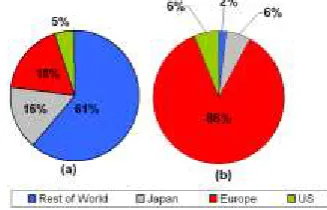
[image:4.595.89.253.447.552.2]Currently the top five solar energy markets are Germany, the US, China, Spain and Japan with Germany leading the way [24]. In fact, US led to PV shipments before 1999, but lost market leadership over the subsequent decade –first to Japan and then to Europe (primarily Germany), and finally to China or Taiwan which shipped 46% of total product in 2009. All those countries had strong production growth rates in the past decade, but market share in Japan, Europe and US dropped due to the emergence of China and Taiwan. They surged to dominance primarily due to price leadership [35].
Fig. 4. Global PV supply and demand (% of annual shipments MW) (a) supply and (b) demand
Fig. 4 shows about global PV supply and demand (cell and module shipment).It is seen that 86% of demand is in Europe, especially 53% from Germany, and much of it supplied from Asia. China and Taiwan surged to dominance primarily in supply dimension, whose 38% of 61% is theirs [35].
The major solar panel technologyn manufacturing countries are China, Japan, Europe and the US. China produced zero solar panels in 1999 and has grown to be the largest solar panel manufacturer with 40% of the global market production in 2008. China is currently putting infrastructure in place to build up to 20 GW (equivalent to 20 nuclear power plants) in solar power generation capacity by 2020. In comparison, the US is planning to build up to 3000 GW of solar power generation capacity by 2050 to reduce dependence on fossil fuels. The US was a leader in polysilicon production in 2008, but this is probably no longer the case that Chinese PV cell and module
manufacturers have invested in polysilicon facilities to lock up supply [35].
Despite a long history of public and private investments in PV technology, the US continues to be a relatively immature PV market. In 2008, the US accounted for : (1) 8% or about 440 megawatts (MW) of PV global market demand and (2) 7% or about 385 MW of global market supply. The technical potential of the US PV market is substantial, but the land area required to supply all end-use electricity in the US using PV is only about 0.6% of the country's total land area or about 22% of the “urban area” footprint.
In contrary, with the US, China’s PV industry has predominantly supplied export markets, but the government is now stimulating domestic demand. Since the industry’s modest beginnings in 2002, domestic cell and module manufacturers have exported more than 95 percent of their products to overseas markets –relying on the favorable energy policies of European governments to drive demand for Chinese production. As China has rapidly vaulted to the top of global solar cell manufacturing capacity, it has done so largely due to unprecedented demand from countries like Germany, Spain, Italy, and the United States, among others [35].
V. SOLAR FINANCE
By using solar electricity, there are many benefits the users get. One of them is cutting the electricity bills. In the UK, the average domestic solar PV system is 3.5 to 4kWp and costs around £7,000 (including VAT at 5%), with the typical cost ranging from £5,500 to £9,500. If the system is eligible for the Feed-In Tariff scheme (FITs), it could generate savings and income of around £785 a year (based on a 4 kWp solar PV system eligible for a generation tariff of 14.9 p/kWh). Even the users will get paid for both the electricity they generate and use, and what they don't use and export to the grid. When applying for FITs they will need to show evidence of their property's Energy Performance Certificate and this will affect what tariff they can get [2].
[image:4.595.306.534.611.756.2]There are variable values between PV projects based on the choice of location, orientation of the modules, technology choices, size of installation as well as actual installation and operation costs. It can be estimated that by using photovoltaic modules, it will return long payback time that is 9-10 years, but good annual returns. The internal rate of return is about 10% pa. The cash flow from photovoltaic modules can be seen in fig. 5 below [12].
Fig. 5. The cash flow from photovoltaic modules
Fig 5 above is from a case that if 1 kW installed in Exeter, UK where equivalent with 1400 kWh/m2, the panel is
located in the roof (optimal slope facing south), the module is crystalline Si and the degradation 0,5% pa. Then, UK FIT is 0,361 £/kWh, export tariff is 0,03 £/kWh, installation cost is £3500, operating is £210 pa and installation is 2% pa (for tariff and operating cost).
In order to save money, these are factors that affect PV installation costs [2] are (1) the more electricity the system can generate, the more it costs, but the more it could save, (2) larger systems are usually more cost-effective than smaller systems (up to 4kWp), (3) PV panels are all around the same price per kWp, but PV tiles cost much more than a typical system made up of panels, and (4) panels built into a roof are more expensive than those that sit on top.
VI. CONCLUSIONS
This paper analyses trade-off between generations of solar cells that were ever invented. It is because various materials display varying efficiencies and costs so that materials for efficient solar cells must have characteristics matched to the spectrum of available light. There are four generations of solar cells that type of solar cell based on dye technology (DSSC) is suitable in developing country like Indonesia because this type of solar cells do not require high-tech equipment for the fabrication.
In order to be able capture more value and to mitigate the inherent risks of the supply chain, this paper also describes the value chain of solar cells to evaluate activities within, around and relates them, so that it will be known what activities will give value added to the solar power. Based on this value chain, it will be identified about the supply chain of solar energy to know which areas in Indonesia that can be used as a source for material constituent of solar PV in order not to depend on imported raw materials. Quartzite sand (silica) as the solar raw material scatters in various locations in Indonesia. Quality silica, which is equivalent to the metallurgical grade silicon is usually found in the province of Riau.
This paper also describes about trends in global PV supply and demand. They are important measurement that can be used to determine the international competitiveness in global market shares of PV system. Currently the top five solar energy markets are Germany, the US, China, Spain and Japan with Germany leading the way. All those countries had strong production growth rates in the past decade, but market share in Japan, Europe and US dropped due to the emergence of China and Taiwan. They surged to dominance primarily due to price leadership
In addition, based on the previous study, it is known that using solar electricity will cut the electricity bill. It will give variable values between PV projects based on the choice of location, orientation of the modules, technology choices, size of installation as well as actual installation and operation costs. It can be estimated that by using photovoltaic modules, it will return long payback time that is 9-10 years, but good annual returns.
REFERENCES
[1] G. Hariharan, S. Sato and C. Liu, “Solar cell supply chain”, in Asia
Pacific Equity Research, U.K., January 2008
[2] Energy Saving Trust Organizations, “Solar panels (PV)”, U.K.,
January 2013, Available :
http://www.energysavingtrust.org.uk/Generating-energy/Choosing-a-renewable-technology/Solar-panels-PV
[3] U.S. Department of Energy, “Small solar electric systems”,
Washington, July 2012, Available :
http://energy.gov/energysaver/articles/small-solar-electric-systems [4] Activ Solar Organization, “Why solar energy”, Available :
http://www.activsolar.com/why-solar
[5] Q. Wells, Smart Grid Home, 1st Edition, United States : Cengage
Learning, Inc, 2013
[6] Louise, “Solar panels help reduce greenhouse gas emissions”, April 2013, Available : http://www.climate2003.com/?p=13
[7] Solar Energy Industries Association, “Climate change”, 2013, Available : http://www.seia.org/policy/environment/climate-change [8] College of Technology and Innovation, “Solar power overview”, US,
Available : http://voctec.asu.edu/solar
[9] A. Creatore, R.van de Sanden,and E. Kessels, “Solar cell research activities”, November 2012, Technische Universiteit Eindhoven- University of Technology
[10] P. Lorenz, D. Pinner and T. Seitz, “The economics of solar power”, US : McKinsey and Company, June 2008
[11] British Petroleum, “Going for grid parity”, 2011, Available : http://web.archive.org/web/20110608081013/http://www.bp.com/gen ericarticle.do?categoryId=9013609&contentId=7005395
[12] Green Rhino Energy, “The Solar value chain : key success factors”, Av : http://www.greenrhinoenergy.com/solar/industry/ind_ksfs.php [13] EY Global Limited, “Value and Supply Chains for Electric Vehicles”,
2010, Available : http://www.ey.com/GL/
[14] Green Energy Times, “ Small solar electric systems for your home”, Dec. 2012, Available :http://www.greenenergytimes.net/2012/12/ 15/small-solar-electric-systems-for-your-home/
[15] Encyclopedia of Alternative Energy, “How small solar electric
systems work”, Available :
http://www.daviddarling.info/encyclopedia/S/AE_ small_solar_electric_systems_how_they_work.html
[16] J.B.Calvert, “Silicon”, September 2007, Available : http://mysite.du.edu/~jcalvert/phys/silicon.htm
[17] H. Lund, R. Nilsen, O. Salomatova, D. Skare and E. Riisem, "Different generations of solar cells“, 2008, Available : http://phys.org/news/2013-08-manucloud-solar-cell-chain-online.html [18] D.S. Kim, A.M. Gabor, V. Yelundur, A.D. Upadhyaya, V. Meemongkolkiat, and A. Rohatgi, "String ribbon silicon solar cells with 17.8% efficiency", Proceedings of 3rd World Conference on
Photovoltaic Energy Conversion, Mei 2003, pp: 1293–
1296, ISBN 4-9901816-0-3.
[19] G.N. Tiwari, and R.K. Mishra, “Advanced Renewable Energy Sources”, UK : Royal Society of Chemistry, 2011
[20] J. Pearce and A. Lau, "Net Energy Analysis For Sustainable Energy Production From Silicon Based Solar Cells", Proceedings of
American Society of Mechanical Engineers Solar: Sunrise on the
Reliable Energy Economy, editor R. Cambell-Howe, 2002
[21] Datasheets of the market leaders: First Solar for thin film, Suntechand Sun Power for crystalline silicon
[22] Marvel Green Energy, “Thin PV films”, 2011,Available : “http://www.marvelgreenenergy.com/thin.php”
[23] M. Osborne, “NREL validates Konarka’s 8,3% ‘power plastic’ efficiency record”, November 2010,Available : http://www.pv-tech.org/news/nrel_validates_konarkas_8.3_power_plastic_efficiency _record
[24] Solar Tech USA, “Types of solar cells”, 2012, Available : http://www.solartech-usa.com/types-of-solar-cells
[25] R. Silva, “Fourth generation solar cell technology for high efficiency, large area, low cost photovoltaics defined by surrey academic”, UK : University of Surey
[26] K. D. G. I. Jayawardena, L. J. Rozanski, C. A. Mills, M. J. Beliatis, N. A. Nismy, and S. R. P. Silva, ‘”Inorganics - in – Organics: Recent Developments and Outlook for 4G Polymer Solar Cells, Nanoscale”: DOI: 10.1039/C3NR02733C.
[27] Activ Solar Organization, “Solar Value Chain”, Available : http://www.activsolar.com/why-solar/solar-value-chain
[28] PRWEB, “PROINSO supplies in Indonesia 1 MW in PV solar products to stand-alone facilities”, November 2013,Available : http://www.prweb.com/releases/2013/11/prweb11304444.htm [29] S.Olson, “Indonesia to build solar plants for electricity use in rural
[30] Antaranews, “Solar energy can cut down electricity costs”, August 2013, Available : http://www.antaranews.com/en/news/90479/solar-energy-can-cut-down-electricity-costs
[31] H.K. Dipojono, “Going to the independence of solar cell industry and
fuel cells, July 2012, Available :
http://tf.fti.itb.ac.id/2012/07/27/menuju-kemandirian-industri-solar-cell-dan-fuel-cell/
[32] Masmui, and N. Suhendra, “The making of metal silicon prototype for solar cell materials”, Proceeding of InSINas 2012, Indonesia [33] L. Geospasial, “Main mineral prospect of quartzite sand as solar cell
renewable material”, 2011, Available : http://labgeospasial.blogspot.com/2011/06/10.html
[34] Ahmed, “Photovoltaic rurall electrification possibilities in Indonesia and the Philippines”, Desember 2013, Available : http://www.123helpme.com/view.asp?id=26543
[35] A. Purwanto and Paryanto, “Extraction and powdering of natural dyes”, International conference on Natural Dyes 2013, May 29, 2013, Solo, Indonesia (INVITED SPEAKER), international seminar [36] A. Purwanto, ”Transparent and conductive fluorinated-tin oxide
prepared by atmospheric deposition technique”, The 2013 International Conference on Advanced Materials Science and
Technology (ICAMST 2013) Yogyakarta, Indonesia, September
17-18, 2013
[37] Agus Purwanto, ” Transparent and conductive fluorinated-tin oxide prepared by atmospheric deposition technique”, Advanced Materials
Research, 2013, Accepted after minor revision
[38] S. Landuma, D. A. Haryanto, and Agus Purwanto, “Application of Sappan Wood (Caesalpinia sappan Linn) as Sensitizer for Dye-sensitized Solar Cell (DSSC)”, The 5th Nanoscience and
Nanotechnology Symposium (NNS2013), 23-25 October 2013,
Surabaya, Indonesia