Experimental Analysis and Optimization of A-MIG
Welding Process for Hardness of SS 316 by
Taguchi Method
Akshay Harkal1, Saili Kulkarni2, Kishor Madavi3, Nakul Agwan4
1, 4
PG Scholar, Department of Mechanical Engineering, Government College of Engineering Aurangabad, Maharashtra, India
2, 3
Assistant Professor, Department of Mechanical Engineering, Government College of Engineering Aurangabad, Maharashtra, India
Abstract: The MIG welding is leading in the development in an arc welding process due to its high productivity, low cost and good in quality. The present work is planned to investigate and optimize the effect of different parameters such as current, gas flow rate and flux on hardness of Stainless Steel 316. In this research work the Taguchi L9 orthogonal array is used to optimize hardness. ANOVA (Analysis of Variance) is used to determine most significant input parameter in experiment. The effect of individual parameters on hardness is also investigated. In this design of experiment the three factors with three levels current (120,150,180A), gas flow rate (12, 14, 16 Lit/min) and flux (SiO2, ZnO, Al2O3) are consider for experiment. The ANOVA results
shows the welding current is the most significant parameter followed by gas flow rate and flux which influence hardness. Keywords: Gas Metal Arc Welding (GMAW), Taguchi Method, Hardness, Activated Flux, Signal to Noise Ratio (S/N Ratio), Analysis of Variance (ANOVA).
I. INTRODUCTION
MIG (Metal Inert Gas) welding is the most widely used welding process in industry and also known as GMAW (Gas Metal Arc Welding). It is suitable for ferrous and non-ferrous material. In MIG welding process, it generates electric arc by using power supply between consumable electrode and workpiece. The different types of shielding gases used in Metal Inert Gas welding are carbon-di-oxide, argon, helium along with different mixture proportion is considered depending on material composition. Basically quality and performance of MIG welding process is always rely on the number of welding parameters like welding current, welding voltage, welding speed, gas flow rate, nozzle distance, types of shielding gas, electrode angle etc.
Fig.1: Mechanism of MIG welding
II. LITERATUREREVIEW
D.Bahar et al. studied the effect of Metal Inert Gas Welding process parameters for Micro-hardness and Tensile strength by using Grey relational analysis. The Stainless Steel (SS 316) and Mild Steel (MS1020) two dissimilar material was taken for this work with L16 orthogonal array is constructed. The ANOVA shows GFR has most influence on hardness and ultimate tensile strength. In multi response optimization for hardness as well as ultimate tensile strength contribution factor of welding speed is higher followed by wire feed rate, GFR and welding voltage [1].
Izzatul Aini Ibrahim et al. studied the Gas Metal Arc Welding (GMAW) processes and effects of different welding parameters on it. The welding current, welding voltage and welding speed are taken as a input parameters while depth of penetration and hardness are considered as a output parameters. As a results show the depth of penetration (DOP) is increased by increasing welding current. The maximum penetration get at current of 210A, voltage of 26V and welding speed of 60cm/min. In hardness, the higher value of hardness is at current of 90A, voltage of 26V and 60cm/min [3].
Her-Yueh Huang studied the effect of activating flux powder on the welded joint in Metal Inert Gas (MIG) welding process by using Taguchi method. In this work, three kinds of flux powder (Fe2O3, SiO2, MgCO3) were used to evaluate and optimize effect of this fluxes on mechanical properties in AISI 1020 Carbon Steel. The experimental results shows, MgCO3 flux gives the noticeable effect on penetration as well as hardness and reduces angular distortion in the welding area [4].
III.EXPERIMENTALPLAN,SETUPANDPROCEDURE
A. Taguchi Method
Taguchi method is invented by a Japanese scientist Dr.Genichi Taguchi. It is statistical method which is commonly applicable in many engineering problems. The Taguchi design of experiment gives competent and methodical path to optimize design of performance, quality and cost. Taguchi method is mainly based on the Orthogonal Array experiments which provide balanced design for the experiment and optimal number of process control parameters. Taguchi method uses signal-to-noise (S/N) which takes ratio of mean (signal) to the standard deviation (noise). Generally there are three Signal-to-Noise ratio are used for optimization.
1) Signal-to-Noise Ratio for Smaller-The-Better Characteristics: n = -10log10 [Mean of sum of square of measured data]
2) Signal-to-Noise Ratio for Larger-The-Better Characteristics: n = -10log10 [Mean of sum of reciprocal of measured data]
3) Signal-to-Noise Ratio for Nominal-The-Best Characteristics: n =10log10 (Square of mean) / Variance
B. Material Selection
The work material used for present work is Stainless Steel 316 having dimension of 100mm ×60mm×5mm thickness. The mixture of argon and carbon-di-oxide is used as shielding gas in (80%-20%) proportion. The chemical composition of base material is shown in Table1.
Element Wt%
C 0.047
Mn 1.58
P 0.027
S 0.016
Si 0.428
Cr 16.425
Ni 11.90
[image:2.612.201.414.652.720.2]Mo 2.27
Table 1: Chemical Composition
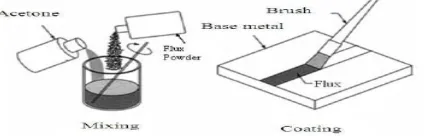
C. Experimental Procedure
The parameters that mostly affects the quality characteristics was optimized by S/N ratio. The lower the hardness value it emphasizes better will be the welding performance. So, smaller-the-better S/N ratio is selected for hardness to maximizing the response.
Input Parameters
Levels of Parameters
Level 1 Level 2 Level 3
Current (Ampere)
120 150 180
Gas flow rate (Lit/min)
12 14 16
Flux used (gm/cm2)
[image:3.612.163.448.112.463.2]SiO2 ZnO Al2O3
Table 2: Levels for DOE
[image:3.612.179.433.257.450.2]D. Design of Experiment (DOE)
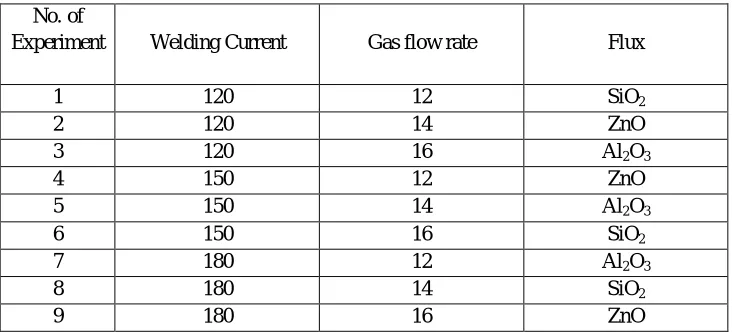
Fig.3: Based on L9 orthogonal array 9 samples for Hardness test
In DOE the parameters are arranged by using orthogonal array according to sample range. The Taguchi method is applied because it reduces the number experiment and which reduces cost as well as time of experiment. In this experiment, three levels are used along with three factors consider and based on that L9 OA is selected. The below table shows DOE of L9 orthogonal array with three input parameters which have to employed for welding the samples.
No. of
Experiment Welding Current Gas flow rate Flux
1 120 12 SiO2
2 120 14 ZnO
3 120 16 Al2O3
4 150 12 ZnO
5 150 14 Al2O3
6 150 16 SiO2
7 180 12 Al2O3
8 180 14 SiO2
9 180 16 ZnO
[image:3.612.124.490.545.711.2]IV.RESULTANDDISCUSSION
A. Result and Analysis for Hardness
[image:4.612.106.509.158.320.2]The micro-hardness analysis was done to know the characteristics of hardness in different zones in workpiece such as base metal zone, heat affected zone and weld metal zone. The micro-hardness test is performed on Vickers hardness tester and test was performed on all nine samples. The hardness test is performed at SN Metallurgical Services, Waluj, Aurangabad and Vickers hardness tester used for test is manufactured by Fuel Instruments & Engineers Pvt, Ltd.
Table 4: Hardness results
From above table it is seen that sample number 3 gives the lowest hardness with Al2O3 flux at 120A current and 16 lit/min gas flow rate respectively.
180 150
120 -48.0
-48.5
-49.0
-49.5
-50.0
16 14
12 1 2 3
Current
M
e
a
n
o
f
S
N
r
a
ti
o
s
GF R F lux
Main Effects Plot for SN ratios
Data Means
Signal-to-noise: Smaller is better
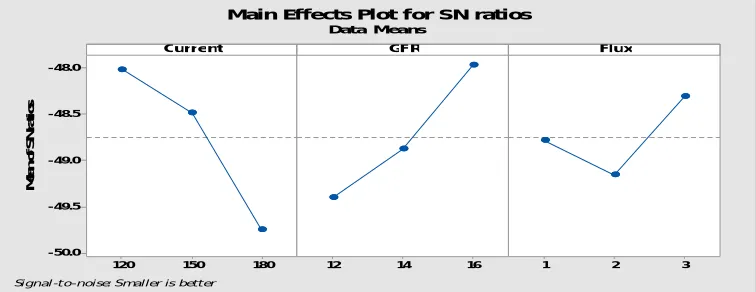
Chart 1: Main effects plot for S/N ratios of Hardness
From the above chart we get optimum value for micro-hardness for different input parameters. The mean of S/N ratio graph shows optimum parameters are 120 amp current, Al2O3 flux and 16 litre/min of gas flow rate.
B. Analysis of Variance (ANOVA)
Source DF Seq SS Adj SS Adj MS F-Value P-Value Contribution
Current 2 4850.0 4850.0 2425.0 10.09 0.090 52.59%
GFR 2 2920.7 2920.7 1460.3 6.08 0.141 31.67%
Flux 2 970.7 970.7 485.3 2.02 0.331 10.53%
Error 2 480.7 480.7 240.3 5.21%
Total 8 9222.0 100.00%
S=15.5027 R-Sq=94.79% R-Sq (Adj)=79.15%
Table 5: ANOVA Results for Hardness Sample
No.
Micro hardness (HV)
Base metal zone Heat affected zone Weld metal zone
1 205 247 272
2 197 232 260
3 184 202 225
4 224 283 309
5 190 208 256
6 192 213 237
7 220 281 306
8 236 290 322
[image:4.612.119.497.368.514.2]ANOVA is statistical method to calculate percentage contribution factor of each parameter. The all Analysis of Variance (ANOVA) calculations for hardness test was performed in excel sheet in MINITAB 18 software. Table 5 shows that current is the most significant factor with 52.59%, followed by gas flow rate with 31.67% and activated flux with 5.21%.
C. Confirmation Test
The confirmation test was performed at optimum value of process parameter which are current of 120A, gas flow rate of 16 lit/min and Al2O3 flux. To perform a confirmation test, the regression equation for hardness is calculated by using MINITAB 18 software. The regression equation gives the predicted value of test.
Hardness (HV) =305.7 + 0.917 Current - 10.92 GFR - 7.33 Flux
Table below shows results obtained from confirmation test.
Test Predicted Value Experimental Value Error
Hardness (HV) 233.69 216 7.56%
Table 6: Confirmation Test Results for Hardnes
V. CONCLUSION
The present work is on the effect of MIG welding parameters on hardness of Stainless Steel 316 grade and the results were optimized by using Taguchi method. Based on investigation and optimization following conclusion were drawn based on the results of this experiment:
A. For optimum hardness, considering all input parameters welding current is most significant factor on hardness followed by gas flow rate and flux.
B. The optimum welding parameters are found to be current of 120A, gas flow rate of 16lit/min and Al2O3 flux.
C. The hardness is gradually increases from base metal zone to the weld metal zone.
VI.ACKNOWLEDGEMENT
This project work was supported by Badve Engineering Pvt. Ltd, Waluj MIDC, Aurangabad and Government College of Engineering, Aurangabad.
REFERENCES
[1] D.Bahar, Md. Nawaz Sharif, K. Shravan Kumar and D. Reddy, “Optimization of MIG welding process parameters for hardness and strength of welding joint using Grey relational analysis” International Journal of Research in Advent Technology, E-ISSN: 2321-9637, May 2018.
[2] Sandip Shelar,K. R. Madavi, “Optimization of Activated MIG Welding Process by using Taguchi Technique on Fe 410 Mild Steel Weld” International Journal for Scientific Research & Development, ISSN (online): 2321-0613, August 2018.
[3] Izzatul Aini Ibrahim, Syarul Asraf Mohamat, Amalina Amir, Abdul Ghalib, “The Effect of Gas Metal Arc Welding (GMAW) processes on different welding parameters” Engineering Procedia 41, Elsevier Ltd.,1502 – 1506, 2012.
[4] Her-Yueh Huang, “Effects of activating flux on the welded joint characteristics in gas metal arc welding” Materials and Design, Elsevier Ltd., 2488–2495, 2010.
[5] P. Bharath,V.G. Sridhar, M. Senthil kumar, “Optimization of 316 Stainless Steel Weld Joint Characteristics using Taguchi Technique” Procedia Engineering 97,Elsevier Ltd., 881 – 891, 2014.
[6] Nabendu Ghosh, Pradip Kumar Pal, Goutam Nandi, “Parametric Optimization of MIG Welding on 316L Austenitic Stainless Steel by Grey-Based Taguchi Method” Procedia Technology 25,Elsevier Ltd., 1038 – 1048, 2016.
[7] Kapil B. Pipavat, Dr. Divyang Pandya, Mr. Vivek Patel, “Optimization of MIG welding Process Parameter using Taguchi Techniques” International Journal of Advance Engineering and Research Development (IJAERD), e-ISSN: 2348 – 4470, print-ISSN:2348-6406, May 2014.
[8] Tushar M Patel, Kalpesh R Patel, “ Parametric Optimization of Gas Metal Arc Welding Process Using Activated Flux for SS 304 by Taguchi Method” International Journal of Advanced Scientific and Technical Research, ISSN 2249-9954, July-August 2015.
[9] R. Rajasekar, V. Sathishkumar, R. Ayyasamy, Dr. N. Mathiazhagan, “Experimental Analysis and Optimization of Weld Characteristics and Bead Geomtery Analysis for Stainless Steel 409 by GMAW Process” International Journal of Emerging Technologies in Engineering Research (IJETER), June 2016.