Abstract— Selective Laser Sintering (SLS) is an additive manufacturing technique in which thin layers of fine powder are fused by selective sintering with a high-powered laser to create a 3D part directly based on a digital instruction file. A characteristic aspect of the process is the high cooling rate experienced by the deposited material volume, which gives rise to directional cooling and the generation of columnar microstructure. The fabrication of fine sub-millimetre features leads to the modification of heat flow patterns that in turn affects the microstructure produced. Electron Backscattered Diffraction (EBSD) mapping was performed on samples of 316 stainless steel consisting of a set of thin (sub-mm) strut structures protruding from a thick base. This sample geometry was chosen to reveal the role of the transition from a bulk base (representing a large heat sink) to a thin strut (unidirectional heat conduction) in this additive manufacturing process. EBSD data was collected from the base region, the transition region between the base and the strut, and in the strut region. This allows examining the effect of the heat flow difference between the strut region and the base region on sample microstructure. The greater temperature gradients in the strut region lead to significantly refined grain structure compared to the base region.
Index Terms—EBSD, microstructure, stainless steel alloys,
selective laser sintering
I. INTRODUCTION
ELECTIVE Laser Sintering (SLS) is an additive manufacturing (AM) process which uses direct selective application of a laser to a powder bed to produce three-dimensional parts from a digital file, often in complex shapes that would otherwise be difficult to produce through conventional methods such as forging or casting.
Due to its capability to produce complex geometries without the need for special tooling or support structures, the SLS process has gained traction in the manufacturing industry. Its versatility offers various advantages in terms of freedom of design and production flexibility, and therefore
Manuscript received March 22, 2018; revised March 30, 2018. Benjamin de Jager is with MBLEM, the University of Oxford, Department of Engineering Science, Oxford OX1 3PJ; e-mail: [email protected]
Joris Everaerts is with MBLEM,the University of Oxford, Department of Engineering Science, Oxford OX1 3PJ; e-mail:
Alexei I. Salimon is with CEE, Skoltech Center for Electrochemical Energy Storage, Skolkovo Institute of Science and Technology, Nobel St., 3, Moscow, Russia 121205, e-mail: [email protected]
Alexander M. Korsunsky is Head of MBLEM, the University of Oxford, Department of Engineering Science, Oxford OX1 3PJ; e-mail:
[email protected]; and with Skolkovo Institute of Science and Technology, Nobel St., 3, Moscow, Russia 121205.
has established applications in small batch production such as in the biomedical and aerospace industries. SLS is very similar to Selective Laser Melting (SLM). However, SLS does not involve complete melting of powder particles during the manufacturing process, so that some of the differences in the crystal structure, porosity and other properties may be inherited by the built sample from the initial state, since full phase change does not take place.
SLS in its present form remains an energy extensive process, with considerable energy inefficiency compared to traditional and more developed manufacturing processes. In addition, the layer-by-layer build up and high cooling rate of the sintered powder inherent to the AM process causes material microstructures different to that of standard wrought or cast material. Various studies have been done examining the effect of the build process on the grain growth. Röttger et al. [1] found that SLM-densified 316 austenitic steel have a fine-grained microstructure with elongated grains in the build direction, but no preferred crystallographic orientation. Zhang et al. [2] reported that growth orientation of most grains of the Ni-based superalloy IN718 manufactured by pulsed laser deposition gets inclined to <001>. In [3], de Jager et al. reported grain elongation and preferred orientation associated with the growth direction regardless of the sample build orientation in SLM manufactured IN718.
The evolution of the microstructure of SLS manufactured materials is driven by the heat flow through the material. Most metal AM involves the layer-by-layer deposition of printed material onto a previously built substrate or base plate which acts as a heat sink during cooling from the processing temperature that is induced in the elementary added volume through the delivery of heat, e.g. in the form of laser light in the case of SLS. The flow of heat into the base plate or substrate affects the microstructural and mechanical properties of the material. Mercelis et al. [4] showed that the magnitude of the resultant residual stresses is directly proportional to the thickness of the base plate, with a thicker plate resulting in lower residual stresses. It follows that the flow of heat through a sample with varying thickness will also vary, resulting in different microstructural properties as the sample dimensions change. The aim of this study was to examine this microstructural size effect by comparing the grain morphology and orientation as a function of the substrate thickness and build geometry.
On the Microstructure Size Effect in SLS-built
316L Stainless Steel Parts
Benjamin de Jager, Joris Everaerts, Alexei I. Salimon, and Alexander M. Korsunsky, Member, IAENG
II. MATERIALS AND METHODS
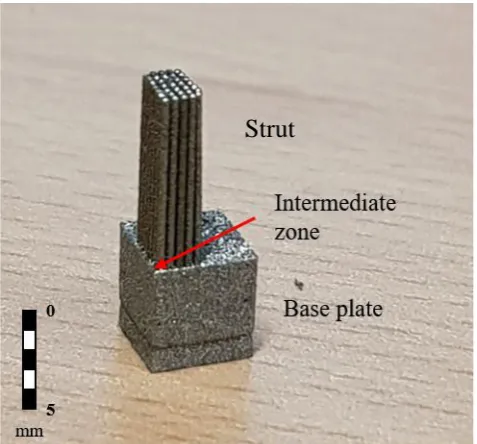
Stainless steel 316 (SS316), a marine grade molybdenum-based alloy, in powder form was used to produce by SLS a sample consisting of a “base plate” disc of depth 5mm, out of which struts of length 8mm and individual thickness of 0.2mm were grown in batches of 35 closely spaced struts. The samples were manufactured using the TruPrint 1000 Laser Metal Fusion printer (Trumpf GmbH + Co, Germany) using a fibre laser; the processing parameters were laser power 200W and spot diameter 55µm.
Sections were cut from the disc such that each section comprised a 5mm x 5mm x5mm base with 35 struts protruding, as shown in Figure 1. The sample was prepared by standard metallographic procedures, with the final polish applied using 0.04µm colloidal silica. Scanning electron microscopy (SEM) and electron backscattered diffraction (EBSD) were performed using TESCAN LYRA3 FIB-SEM fitted with Oxford Instruments NordlysNano EBSD system at the Multi-Beam Laboratory for Engineering Microscopy (MBLEM), Oxford. Beam voltage of 10kV was used for analysis.
EBSD maps were obtained from three regions of the sample; the base plate, the transition region between the base plate and the strut, and the strut itself. The dimensions of the EBSD maps were in the order of 400µm x 400µm for the strut and transition regions, and 500µm x 500µm for the base region. EBSD data were processed by HKL Channel 5 software and subsequently the MTEX toolbox [5] for MATLAB.
Fig. 1. The SLS-manufactured sample showing the thick base plate with 35 thin spines protruding from its upper face. The spines are oriented in the sample build direction.
The mechanical properties of the sample in each of the three analysed regions was studied using nanoindentation. Hardness was determined from the load-displacement data. Alemnis Nanoindenter was used to make indentations to a maximum load of 200mN, and under a constant load rate of 0.1mN/s. A Poisson ratio of 0.27 was assumed for all regions of the sample. A three-sided pyramid Berkovich
Fig. 2. EBSD maps of the analysed regions of the sample: inverse pole figure maps of (a) the strut region with grain boundaries marked in black, (b) inverse pole figure maps of the intermediate region with grain boundaries marked in black, (c) inverse pole figure maps of the base region with grain boundaries marked in black. The black region in (b) lies outside the sample.
Strut
(a)
(b)
[image:2.595.315.533.44.713.2] [image:2.595.49.288.434.656.2]indenter was used to make three indentations separated by 50µm in each region in order to obtain average values.
III. RESULTS
A. Surface Microstructure
EBSD was used to determine the grain size distribution and the crystallographic texture of an SLS-built sample, and MTEX toolbox for MATLAB was used to interpret the EBSD data. Since EBSD mapping only encompasses a comparatively small area for each face, it provides a limited sampling representation of the grain structure and orientation. In comparison, techniques such as X-ray diffraction allow sampling of larger volumes and may provide improved statistics.
Figure 2 shows the MTEX EBSD reconstructions of the three maps, coloured to represent the lattice orientation at each probe point using the basic crystallographic triangle for cubic material. Table 1 displays selected grain statistics for each map; here the mean grain diameter, aspect ratio and inclination angle for each EBSD map is displayed. Comparison of the images clearly shows qualitative evolution in the microstructure between the different areas. The base plate map shows the largest grains, with a mean diameter of 34.235µm; this is in contrast to the comparatively smaller grains found in the intermediate and strut maps, which have a mean diameter of 20.351µm and 19.782µm respectively. Additionally, the base plate grains are observed to be elongated and inclined towards the growth direction of the sample, with a mean inclination angle of just 0.58263º; this is in keeping with the findings of Guo et al. [6] who pointed out that the component of temperature gradient along the vertical direction of the molten pool border was higher than any other along the other directions, resulting in the directional growth of the grains.
TABLEI
GRAIN STATISTICS FOR ANALYSED AREAS
MEAN GRAIN DIAMETER, ASPECT RATIO AND INCLINATION ANGLE FOR ALL THREE ANALYSED AREAS OF THE SAMPLE.
Sample area d (µm) Aspect ratio (r) Inclination angle (º) Base plate 34.24 3.04 0.58 Intermediate 20.35 4.29 6.44 Strut 19.76 2.90 6.94
[image:3.595.89.509.58.305.2] [image:3.595.306.539.405.459.2]orientation towards the 001 crystal orientation, consistent with the sample growth direction.
[image:4.595.52.287.305.485.2]Further to this point, it can be trivially observed that the transition from base plate to struts will result in an alteration of the laser scanning rate. Although the exact scanning pattern that was used to produce the struts is not known, the radical decrease in surface area required to be sintered when transitioning to the strut section necessarily entails that the scanning rate will increase, assuming a constant scanning speed for the laser. Wang et al. [7] examined the effect of higher scanning rate on microstructure of steel samples in three grades manufactured through direct laser metal deposition (DLMD) and found that higher scanning rate was effective to alter the microstructure for all three grades. In the third grade, the increase in the scanning speed from 8 mm/s to 10 mm/s was sufficient to cause a drop in average grain diameter from 30 µm to 11 µm, which is a result similar to the drop from 34.2 µm to 19.8 µm observed in our study for the microstructural transition between the base and the strut.
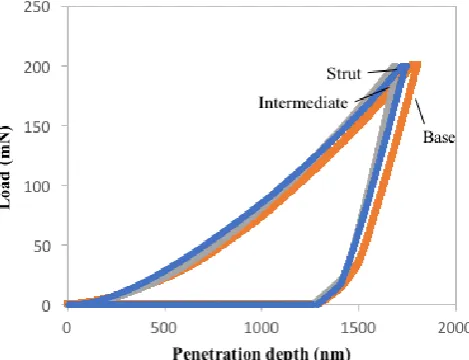
Figure 4: Load-displacement curves for the three regions of the sample, with a deformation rate of 0.1mN/s.
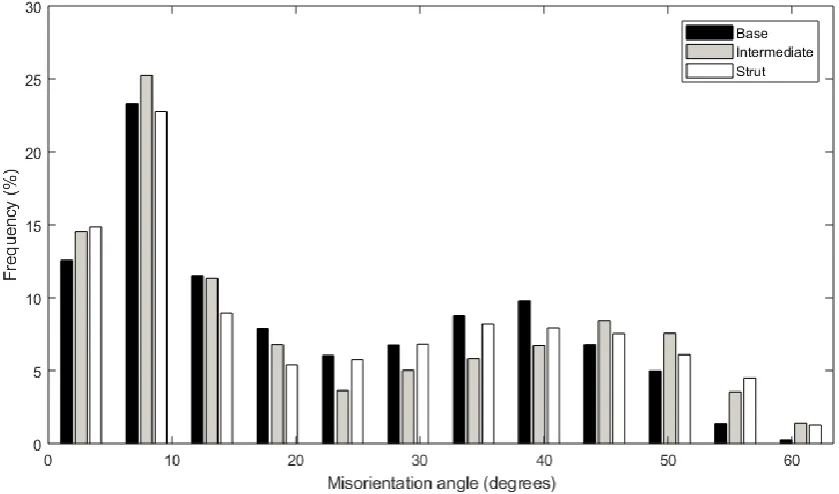
Figure 3 shows the grain dimension distribution and the associated misorientation distribution histograms. It can be observed from Figure 3 that the distribution of misorientation angles is largely the same for all three maps, indicating that the change in thickness does not radically change the level of equiaxing of the grains. The statistical results show that most grain boundaries’ misorientation angles are distributed in the range 0-10º. However, there is a continued high incidence of misorientation angles in the range 10-40º. This is likely due to the scanning rate and high energy of the laser beam, which elongate the sintered region to form high-angle grain boundaries, as demonstrated by Yadroitsev et al. [8].
B. Hardness Analysis
Based on dislocation theory, the grain boundary energy γgb can be estimated as a function of grain boundary angle θ
by the Read-Shockley equation [9]:
, (1)
where , G is the shear modulus, b is the
Burgers vector, ν is Poisson’s ratio, and A is an integral constant. The Read-Shockley equation is, however, only valid for low angle boundaries; higher angle boundaries indicate a higher energy stored in the grain due to the higher degree of misorientation [9]. Sule et al. [10] noted that grain refinement with large proportions of high-angle grain boundaries would increase the strength and toughness of a material compared to its columnar dendritic state. Based on this, a hardness analysis of the sample through nanoindentation would be expected to show an increase in hardness in the strut region due to grain refinement.
Figure 4 shows the average load-displacement curve for each of the three areas analysed. The Young’s Modulus and hardness have been calculated based on the relationships developed by Oliver and Pharr [11], with the results analysed according to the equation:
, (2) where β = 1.034 for a Berkovich indenter [12]. The average hardness values for each reason are shown in Table 2.
TABLEII
AVERAGE HARDNESS STATISTICS FOR BASE, INTERMEDIATE AND STRUT REGIONS OF THE SAMPLE
Sample area d (µm) Hardness (GPa)
Base plate 34.24 3.17
Intermediate 20.35 3.33
Strut 19.76 3.42
It can be observed that the penetration depth drops at constant load between the base and intermediate regions, corresponding to an increase in hardness from 3.17 to 3.33, respectively. From the intermediate region to the strut, however, a comparatively smaller increase in hardness is observed, with the penetration depth remaining approximately the same. It was noted above that grain refinement would be expected to result in an increase in hardness, and thus this result is consistent with the results of the surface microstructure analysis. The grain refinement observed between the base region and transition region results in an increase in hardness, whereas the lack of further refinement in the strut corresponds to a lack of further increase in material hardness between these regions.
The hardness is classically related to the grain size by the Hall-Petch equation [13]:
. (3)
Based on the paucity of data points it is difficult to determine statistically how closely the sample fits this relation. However, basic curve fitting based on the Hall-Petch relation shows that the data can be described approximately by the fit given by:
where hardness H is specified in GPa, and average grain diameter d in microns.
In the context of the modified Hall-Petch relation proposed by Ying et al. in [14], eq. (3) can be re-written as follows:
. (5)
Here denotes the ‘native’ hardness of large-grained material (AISI stainless steel 316L), and denotes the average grain size at which the hardness of polycrystalline material is doubled.
The advantage of the above formulation over the conventional Hall-Petch relation in the form of equation (3) lies in the fact that both parameters appearing in the expression ( for hardness and for grain size) have clear physical meaning, in contrast with that has uncommon dimensional units, and is of phenomenological nature.
Analysis of equation (3) leads to the following values for the ‘native’ hardness and ‘critical’ grain size, respectively:
GPa, and µm. This indicates that
significant increase in the apparent hardness of material may occur only upon significant further grain refinement to much finer sizes, whilst in the range of grain sizes observed in the present study the variation of hardness with grain size appears to be moderate, and is unlikely to have a pronounced effect on the mechanical response of the build.
It is interesting to comment, in passing, that one may be able to conceive of situations when the critical grain size may have values much closer to the observed mean grain size, in which case strong dependence of hardness on the process conditions would be expected.
IV. CONCLUSIONS
The microstructure of a SS316 sample of variant dimensions manufactured though SLS is investigated through EBSD analysis. The influence of the different temperature gradients between the strut and the “heat sink” base plate is discussed. The following specific conclusions can be summarised as follows:
(1) There was a significant decrease in grain size between the base plate region and the strut region, from 34µm to 19µm. However, there was little corresponding change in orientation or aspect ratio, and most grains remained oriented towards the 001 crystal direction.
(2) The grain size is observed to decrease in correspondence with an increase in the scanning speed; it is not yet able to be determined whether this decrease in grain size is due to the change in speed or the unidirectional heat flow resulting from the shape of the strut. Within the scope of this experiment, both are inexorably linked and thus cannot be considered to be independent variables.
Further study is planned to examine these variables in closer detail.
(3) Change in scanning speed and sample dimensions has minimal effect on the grain misorientation distribution, which for all three regions analysed retains a high incidence of comparatively large (10-40º) misorientation angles. For all three regions, the most frequent misorientation angle is of the order of <10º degrees, which is to be expected from the columnar dendritic microstructure endemic to additively manufactured samples.
(4) The size effect affects the mechanical as well as the microstructural properties; refinement in the grain caused by the change in heat flow in the sample causes an increase in hardness.
Further research on similar samples is planned; the scope of these includes x-ray diffraction (XRD) analysis and residual stress analysis. These further mechanical microscopy tests will assist in obtaining a full overview of the sample’s mechanical and microstructural properties, and aid in investigating the link between variant heat conduction and microstructural evolution.
ACKNOWLEDGMENTS
Alexander M. Korsunsky wishes to acknowledge the outstanding support for the operation of MBLEM provided by Ray Codd and Petr Buček, Tescan UK.
The authors wish to acknowledge the useful discussions with Vladimir Yu. Kalyaev ([email protected]) and Iskander S. Akhatov ([email protected]) of CDMM at Skoltech.
REFERENCES
[1] A. Röttger, K. Geenen, “Comparison of microstructure and mechanical properties of 316 L austenitic steel processed by selective laser melting with hot-isostatic pressed and cast material,” Mat. Sci. Eng. A 678 (2016) 365-376
[2] Y.C. Zhang, L. Yang, J .Dai, Z.D. Huang, T.Meng, “Grain growth of Ni-based superalloy IN718 coating fabricated by pulsed laser deposition,” Opt. Laser Technology 0 (2016) 220-226.
[3] B. de Jager, B. Zhang, X. Song, A. Korsunsky, “Texture and microstructure analysis of IN718 nickel superalloy samples additively manufactured by selective laser melting,” IMECS 2017 Vol II 734-740.
[4] P. Mercelis, J-P. Kruth, “Residual stresses in selective laser sintering and selective laser melting,” Rapid Proto. Journal Vol 12 (2006) 254-265.
[5] F. Bachmann, R. Hielscher, H. Schaeben, Texture Analysis with MTEX - Free and Open Source Software Toolbox. Solid State Phenomena, 160, 63-68 (2010).
[6] P. Guo, B. Zou, C.Z. Huang, H.B. Gao, “Study on microstructure, mechanical properties and machinability of efficiently additive manufactured AISI 316L stainless steel by high-power direct laser deposition,” J. Mat. Process. Technol. 240 (2017) 12-22.
[7] Q. Wang, S. Zhang, C.H. Zhang, “Microstructure evolution and EBSD analysis of a graded steel fabricated by laser additive manufacturing,” Vacuum 141 (2017) 68-81.
[8] I. Yadroitsev, P. Krakhmalev, I. Yadroitsava, S. Johansson, I. Smurov, “Energy input effect on morphology and microstructure of selective laser melting single track from metallic powder,” J. Mat. Process. Technol. 213 (2013) 606-613.
[9] W.T. Read, W. Shockley, “Dislocation models of crystal grain boundaries”, Phys. Rev. 78 (1950) 275-289
[11] W. Oliver, G. Pharr, “An improved technique for determining hardness and elastic modulus using load and displacement sensing indentation experiments”, J. Mater. Res. 7 (1992), 1564-1583 [12] R.B. King, “Elastic Analysis for some punch problems for a layered
medium”, Int. J. Solids Structures 23 (1987), 1657-1664
[13] N. Petch, “The Cleavage Strength of Polycrystals”, J. Iron Steel Inst. 173 (1953) 25-28