Page 437
RESULTS OF THE TEST APPROBATION "DRINKING WATER" IN TEACHING CHEMISTRY (10TH GRADE)
Antoaneta A. Angelacheva
University of Plovdiv, Faculty of Chemistry, Department of General and Inorganic Chemistry with Methods of Teaching Chemistry, Bulgaria
Abstract
This article presents author’s version of criterion-oriented test for measurement of three properties which characterize the training of students in chemistry – knowledge, skills and attitudes towards the problem to ensure the quality of drinking water. The qualities – difficulty, discriminative power and reliability of the constructed test, are determined by testing it among a sample of students in 10th grade. The results of statistical processing of empirical data give the confidence that the overall set of tasks are reliable means for diagnostics of the training of students in chemistry.
Key words: chemistry education, analysis of drinking water, criterion-oriented test, difficulty, discriminative power and reliability of the test
1. INTRODUCTION
Hydrosphere, the aquatic shell of the Earth, takes up 3/4 of its surface. But a very small part of the total mass of the hydrosphere is fitted for human use. This is so-called fresh water which is need for normal growth and development of the human being. Solving the problem of meeting the needs of people from drinking water is closely linked to ensuring its quality.
To enrich the adolescents’ knowledge of the organoleptic and physicochemical indicators for the quality of drinking water, the skills for their experimental determination and the attitudes towards the problem of water conservation in nature is developed the laboratory lesson "Analysis of drinking water" (Angelacheva, 2014). The methodological recommendations for its organization and implementation, as well as the results of the conducted experimental training for demonstration its appropriateness in teaching the school subject "Chemistry and environmental protection" (in 10th grade, specialized training), are described in the pointed article.
This paper presents the research results of the main characteristics of the developed criterion-oriented test "Drinking water", that is used for diagnostics of the students' performances in the organised experimental training with the participation of the created laboratory lesson.
2. METHODOLOGY OF THE RESEARCH
The purpose of the study is to determine the qualities of the test's tasks in the separate subtests, and the test as a whole. On the basis of the obtained results to reach a reasoned decision to use the test as a reliable diagnostic tool of the training in chemistry with an emphasis on students' knowledge, skills and attitudes towards the problem of quality of drinking water in 10th grade.
The hypothesis of the study is formulated as an expectation that if the test has good qualities, it allows to be distinguished the two examined groups of pupils (an experimental and a control) by the variable training of students in chemistry.
Page 438 3. DESCRIPTION OF THE RESEARCH
The test is designed in order to register the system of students’ knowledge, skills and attitudes towards the problem to ensure the quality of drinking water and to protect of natural waters in the educational cognitive activity in 10th grade. As the knowledge, skills and attitudes of students belong to the general
cognitive abilities of personality, suitable for monitoring and measuring is the variable training of students in chemistry, which can be diagnosed in the expression of these abilities in the process of chemistry education (Batoeva & Dragolova, 2001; Deriabo & Iasvin, 1996; Radev, 2005, 2013; Sternberg & Williams, 2014). To measure this variable the following criteria and indicators are used: (a) criterion knowledge (about the physical properties and chemical composition of drinking water) with indicators volume and deepness of knowledge; (b) criterion skills with indicators skills for application of knowledge in various cognitive situations and skills for planning and conducting safety experiments (for study physical and chemical properties of drinking water), for analysis of experimental results; (c) criterion attitudes towards the problem of the quality of drinking water with indicators awareness and intensity of attitudes (ibid.).
The selected criteria and indicators are used as basic cognitive orientations in development of the criterion test “Drinking water”. It is structured in three subtests, conditionally grouped as follows:
subtest 1 (tasks from 1 to 4) aims to diagnose the volume and the deepness of students' knowledge about physical and chemical properties of drinking water; subtest 2 (tasks from 5 to 8) aims to record the students' abilities to apply acquired knowledge in different situations, to plan and to perform chemical experiments observing technique for safe operation; subtest 3 (tasks from 9 to 12) aims to establish not only the knowledge and skills of students about the educational content included in subtests 1 and 2, but also the attitude of students towards the problem of the quality of drinking water. In the three subtests the tasks are multiple choice questions or with free response. The evaluation of the tasks with multiple choice questions is with 1 point for each correct answer and 0 points for a wrong or unspecified answer. In the tasks with free response scores are determined depending on the complexity of the task and the completeness of the response.
The constructed test is an essential tool for diagnostics of effectiveness of the developed practical lesson "Analysis of drinking water" (Angelacheva, 2014) that aims to enrich the students’ knowledge, skills and attitudes towards the problem of the quality of drinking water. The experimental training is organized in two versions – an experimental and a control. The first version is associated with application of the developed practical lesson (an experimental group EG – 80 students). The second version follows the traditional training in school subject "Chemistry and environmental protection" in 10th grade (a control group KG – 80 students). Both groups are aligned on the achievements of pupils in teaching chemistry through the preliminary test.
4. RESULTS AND DISCUSSION
Statistical processing of the data from approbation of the test materials carried out in two aspects: determination of the difficulty and the discriminative power of the test's tasks; establishment of the reliability of the subtests and the test as a whole.
The difficulty of the tasks is performed by the index of difficulty P (Bizhkov, 1996, p. 189; 1999). It presents the percentage of the tested students who correctly are solved the task. The difficulty is calculated with the formula (1) (ibid.):
P = NR
N . 100 (1), where
Page 439
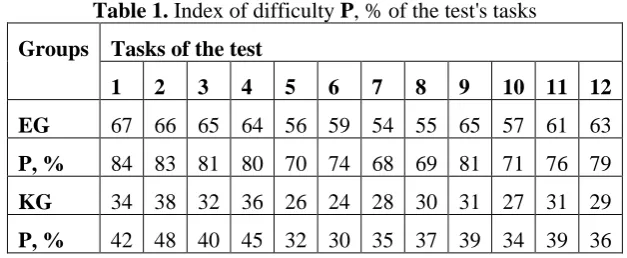
R. Berk points out the following limits for the difficulty of the tasks: between 0% and 50% for untrained pupils; between 70% and 100% for trained students (Bizhkov, 1996, p. 207). The obtained values of the index of difficulty P, % (table 1) are within acceptable limits, i.e. the test's tasks have good performance in regard to the research quality.
Table 1. Index of difficulty P, % of the test's tasks Groups Tasks of the test
1 2 3 4 5 6 7 8 9 10 11 12
EG 67 66 65 64 56 59 54 55 65 57 61 63 P, % 84 83 81 80 70 74 68 69 81 71 76 79 KG 34 38 32 36 26 24 28 30 31 27 31 29 P, % 42 48 40 45 32 30 35 37 39 34 39 36
EG – number of students in the experimental group, who correctly are solved the task; KG – number of students in the control group, who correctly are solved the task.
According to the results of test's approbation with the highest difficulty for the experimental group of students are the tasks relating to the implementation of knowledge in performing chemical experiments. Perhaps this difficulty stems from the limited number of practical experimental tasks carried out by the students in teaching chemistry in 10th grade.
On the other hand, the knowledge for organoleptic and physicochemical indicators for the quality of drinking water have positive influence on the building of students’ attitude towards the problem for the quality of drinking water.
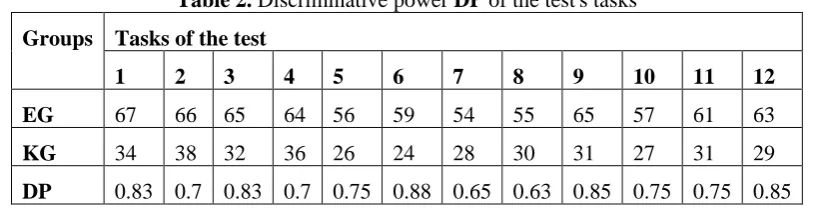
The discriminative power DP shows the possibilities of a task to distinguish the "strong" students from the "weak" students on their achievements (Stoimenova, 2000). The index takes values from –1 to + 1, as in the final version of the test must remain tasks with index DP > 0.40 (Bizhkov, 1996, p. 192). The discriminative power is calculated with the formula (2) (ibid.):
DP = RU−RL
1/2T (2), where
RU – number of students from the "strong" group, who correctly are solved the task; RL – number of students from the "weak" group, who correctly are solved the task; T – total number of students from both groups whether true or not answered.
Page 440
Table 2. Discriminative power DP of the test's tasks Groups Tasks of the test
1 2 3 4 5 6 7 8 9 10 11 12
EG 67 66 65 64 56 59 54 55 65 57 61 63
KG 34 38 32 36 26 24 28 30 31 27 31 29
DP 0.83 0.7 0.83 0.7 0.75 0.88 0.65 0.63 0.85 0.75 0.75 0.85
EG, KG – number of pupils from the experimental and the control group, who correctly are solved the task
The high values of index DP show that the test's tasks have great diagnostic power, i.e. through them can be done accurately and objectively conclusion on the level of the students' preparation.
An important requirement in criterion-referenced test is to establish the minimum limit, or so-called
standard for successfulness U, by which to judge whether the students have achieved the objectives of the test. Most frequently in the pedagogical practice, this standard is determined by the way of expert evaluation (Bizhkov, 1996, p. 269). To determine what should be the minimum number of tasks solved correctly, are given to the experts Klauer’s binomial model, which is detailed in the table applied to formalize the standards in criterial tests (Bizhkov, 1996; Klaus & Ebner, 1977). By comparing the proposed standards for successfulness of the test material evaluation, experts believe that the student must has solved at least 3 from 4 tasks in each of the subtests so that to accept that the student has achieved their cognitive objectives.
The reliability of the subtests is measured in the aspect of internal consistency between the items (the separate tasks), which are conditionally divided into two equal subgroups (the so-called “split-half reliability”). Each of these subgroups unites 2 tasks within each of subtests (ST1, ST2, ST3). Cronbach's coefficient α and Spearman-Brown's coefficient rsb are chosen as indicators of reliability and they monitor the presence/absence of congruence between the general scores of the two halves that form the subtests (Bizhkov, 1996; Klaus & Ebner, 1977; Nasledov, 2012; Sidorenko, 2007).
Cronbach's coefficient α is calculated with the formula (3) (Bizhkov, 1996, p. 220):
= 4(S12–S1S(1−2)r1(1−2))
4S12+ S (1−2) 2 − 4S
1S(1−2)r1(1−2) (3), where
r1(1-2) – correlation coefficient between the test score of the first half of the test and the difference between the test scores of the two halves;
S1, S(1-2) – standard deviation of the test score of the first half of the test and standard deviation of the difference (Х1 – Х2) between the test score of the first and second half of the test.
Calculation of the Spearman-Brown's coefficient rsb is performed with the formula (4) (Bizhkov, 1996, p. 218):
rsb = 2.r12
1+ r12 (4), where
r12 – correlation coefficient between the two halves of the test.
Page 441
Table 3. Reliability of the subtests
Evaluation coefficients ST1 ST2 ST3
Cronbach's coefficient α α = 0.58
0 < α < 1
α = 0.52 0 < α < 1
α = 0.56 0 < α < 1
Spearman-Brown's coefficient rsb rsb = 0.67
–1 < rsb < +1
rsb = 0.72
–1 < rsb < +1
rsb = 0.77
–1 < rsb < +1
Empirically obtained values of the coefficient rsb are in the range 0.6-0.8, that describes the high correlation between the tasks, and thus very good reliability of the subtests (table 3).
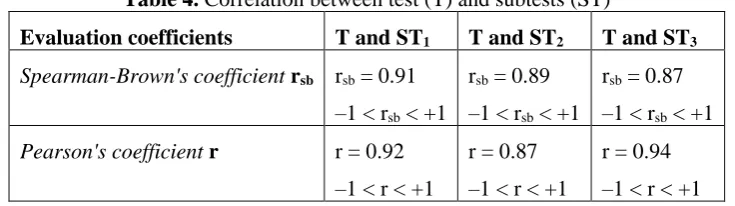
The other aspect of the statistical analysis is directed to solve the following question – what is the connection between the subtests (ST1, ST2, ST3) and the test (T) as a whole. Numerical calculation of
correlation dependencies between test's scores of T and ST1, T and ST2, T and ST3 is made by using
the Spearman-Brown's coefficient rsb and Pearson's coefficient r (Klaus & Ebner, 1977, p. 98; Nasledov, 2012, p. 70). They are used most frequently to determine the linear relationships between the test scores.
Pearson's correlation coefficient r is calculated with the formula (5) (ibid.):
r = n ∑ xi yi− ∑ xi ∑ yi
√[n ∑ xi2−(∑ x
i)2][n ∑ yi2− (∑ yi)2]
(5), where
n – number of measured pairs of numbers; xi, yi – measured values of the variables х and y.
The coefficients rsb and r (table 4) take values about 0.9 (α = 0.01, p < 0.01), which describes a strong correlation between results of the subtests and the test as a whole and therefore proves a very good reliability.
Table 4. Correlation between test (T) and subtests (ST)
Evaluation coefficients T and ST1 T and ST2 T and ST3
Spearman-Brown's coefficient rsb rsb = 0.91
–1 < rsb < +1
rsb = 0.89
–1 < rsb < +1
rsb = 0.87
–1 < rsb < +1
Pearson's coefficient r r = 0.92
–1 < r < +1
r = 0.87 –1 < r < +1
r = 0.94 –1 < r < +1
The reliability of the formed test is measured in two aspects, united in the more general concept of
Page 442
presence/absence of correlation between the answers of test's tasks, as well as the strength of this correlation (Bizhkov, 1996; Klaus & Ebner, 1977; Stoimenova, 2000). The second aspect of reliability (“split-half reliability”) is measured by the Spearman-Brown’s coefficient rsb, which is preferable for testing of linear correlation between the raw scores of test items divided into two halves (ibid.). In its two dimensions, reliability is determined after statistical analysis and processing of the testing results (table 5).
Table 5. Data of statistical evaluation of the test T Evaluation
coefficients
Cronbach's coefficient α
Spearman-Brown's coefficient rsb
Kuder-Richardson’s coefficient KR21
Test T N = 12
α = 0.82 0 < α < 1
rsb = 0.89
–1 < rsb < +1
KR21 = 0,77
0 < KR21 < 1
The empirical value of coefficient α is about 0.8 (table 5). Having in mind the relatively small number of items, this value is an indicator of good reliability. The coefficient rsb is about 0.9 (for α = 0.01, p < 0.01), which describes the strong dependence between the results of the two halves of the test and thus demonstrates very good reliability.
When the difficulty of the test tasks is approximately equal, for calculation of the reliability of the test is used the Kuder-Richardson’s coefficient KR21 (formula 6) (Bizhkov, 1996, p. 223; Stoimenova, 2000, p. 49):
KR21= K
K−1(1 −
M(K−M)
K2 ) (6), where
М – mean arithmetic value of the test score; К – number of tasks in the test;
– standard deviation of the test score.
Empirically established value of the Kuder-Richardson's coefficient KR21 is over 0.7 (table 5), which is a proof for good reliability of the test in its overall configuration.
5. CONCLUSION
Page 443 ACKNOWLEDGEMENTS
The author would like to thank the Research Fund of the Plovdiv University for its financial support (contract NI 15 HF 001).
REFERENCES
Angelacheva, A. (2014). Practical lesson "Analysis of drinking water" in teaching "Chemistry and environmental protection" (in the 10th grade). Journal of International Scientific Publications: Educational Alternatives, Volume 12, 166-176.
Batoeva, D. & Dragolova, E. (2001). Pedagogical and psychological diagnostics (in Bulgarian). Askoni, Sofia.
Bizhkov, G. (1996). Theory and methodology of didactic tests (in Bulgarian). Prosveta Publishing House, Sofia.
Bizhkov, G. (1999). Pedagogical diagnostics (in Bulgarian). Sofia University Press, Sofia.
Deriabo, S. & Iasvin, V. (1996). Ecological pedagogy and psychology (in Russian). Fenics Publishing House, Rostov na Don.
Ganchev, G. & Gergova, E. (1998). The test in chemistry (in Bulgarian). Palmyra Publishing House, Stara Zagora.
Hambleton, R. & Swaminathan, H. (1985). Item response theory: Principles and applications. Kluwer Academic Publishers, Boston.
Klaus G. & Ebner, H. (1977). Basic concepts in statistics for psychologists, sociologists and pedagogues (in Bulgarian). Nauka i izkustvo, Sofia.
Lord, F. (1980). Applications of item response theory to practical testing problems, Lawrence Erlbaum Associates, New York.
Nasledov, А. (2005). SPSS: Computer data analysis in psychology and social sciences (in Russian). Piter Publishing House, St. Petersburg.
Nasledov, А. (2012). Mathematical methods for psychological researches. Analysis and interpretation of data (in Russian). Rech Publishing House, St. Petersburg.
Radev, P. (2005). General school didactics (in Bulgarian). Plovdiv University Press, Plovdiv.
Radev, P. (2013). Encyclopedia of the Sciences education (in Bulgarian). Plovdiv University Press, Plovdiv.
Sidorenko, E. (2007). Methods for mathematical processing in psychology (in Russian). Rech Publishing House, St. Petersburg.
Sternberg, R. & Williams, W. (2014). Educational psychology (in Bulgarian). Iztok-Zapad, Sofia. Stoimenova, E. (2000). Measuring qualities of the tests (in Bulgarian). New Bulgarian University, Sofia.
Page 444 APPENDIX Test "Drinking water"
Subtest 1. Task 1. In what order are given ions, the presence of which is permissible in drinking water? Circle the letter of the correct answer.
A. Na+, K+, Ca2+, Mg2+, Cl–, SO42–, HCO3–, CO32–; B. Mg2+, Cu2+, Na+, Hg2+, Cl–, SO42–, NO3–, PO43–; C. Rb+, Cs+, Ca2+, Ba2+, SO32–, SO42–, PO43–, NO3–; D. Fe3+, K+, Ca2+, Al3+, S2–, SiO32–, HCO3–, OH–; E. H+, NH4+, Zn2+, Pb2+, Cl–, NO3–, HCO3–, CO32–.
Task 2. The carbonate (temporary) water hardness determines by the soluble hydrogen carbonates of: A. Na and K;
B. Ca and Mg; C. Na and Mg; D. Ca and Ba; E. Na and Ca.
Circle the letter of the correct answer.
Complete the sentence: The non-carbonate (permanent) hardness of water is determined by the... The use of "hard" water in the households and in the industry leads to the formation of the so-called scale, which includes insoluble carbonates. Express with chemical equations the reactions as a result of which the scale is obtained.
Task 3. Basic methods for removal of the water hardness are: A. by adding slaked lime Са(ОН)2;
B. by adding soda ash Na2CO3;
C. by adding sodium phosphate Na3PO4; D. by using ion exchange resins;
E. all of the above methods.
Page 445 Task 4. Which of the following statements is not true?
A. Spring water is very suitable for drinking. It is recommended that it is from an underground source, to be bottled on the spot and to have pH > 7.
B. The mineral water is from a mineral spring and contains various salts (chlorides, sulfides, sulfates, hydrogen carbonates, etc.) and some gases. The mineral waters are strongly or weakly mineralized; acidic, neutral or alkaline; cold, warm or hot. Some mineral waters have curative action.
C. Seawater contains various dissolved substances as the greatest amount of sodium chloride NaCl, which gives the sea water salty taste, and bitter magnesium salts. This water is not suitable for drinking.
D. With drinking water the human body gets calcium Са2+ and fluoride F– ions.
E. Drinking water may contain microorganisms, inorganic and organic substances over permissible norms.
Subtest 2. Task 5. You have samples of water from various sources. Suggest methods for treatment of:
A. a sample of the rain water from dissolved substances in it;
B. a sample of the water from the stream from mechanical impurities; C. a sample of water from a well from microorganisms.
Task 6. The mineral water contains chloride Cl–, carbonate CO32–, sulfate SO42–, sulfide S2– ions. А. Suggest methods to detect these ions in the sample of mineral water.
B. Describe the sequence of actions for analysis of the sample, the necessary vessels and reagents. C. Express processes with chemical equations.
Task 7. Using the following table, in which are presented the sedimentary reactions involving lead ions Pb2+, select a reagent for detecting them in a sample of drinking water. Substantiate your answer.
Anion C(Pb2+), mol/l Lees
S2 5.103 PbS
Cl 2,51.103 PbCl2 SO42 1,29.104 PbSO4
CO32 2,82.107 PbCO3
Page 446
Task 8. You have a sample of drinking water, in which is supposed the presence of iron ions Fe3+. Which of the following reagents may use for their detection: potassium iodide KI, potassium thiocyanate KSCN, disodium sulphide Na2S, disodium carbonate Na2CO3. Support your answer with chemistry experiment and by expressing the processes with chemical equations.
The iron ions Fe3+ can be removed from drinking water by precipitation with sodium hydroxide solution NaOH. Carry out the process experimentally and express it with a chemical equation.
Subtest 3. Task 9. Water is essential for life on Earth, as: A. it is contained in living organisms;
B. it is contained in various food products with plant and animal origin; C. water is the natural environment in which biochemical processes take place; D. water is a regulator of heat exchange of living organisms with the environment; E. all the answers.
Circle the letter of the correct answer.
Task 10. Examine the data for the average water consumption of family in Bulgaria for one month: toilet washing – 32%, bathing – 30%, laundry – 12%, other body care – 6%, washing dishes – 4%, drinking and cooking – 3%, cleaning of premises – 3%, watering gardens – 2%, car wash – 2% and others – 6%. Suggest the ways to reduce the consumption of drinking water from your family.
Task 11. Is it permissible the presence of nitrate ions NO3–and phosphate ions PO43– in drinking water? Substantiate your answer. Describe the impact of these ions on the human body.
Task 12. Toxic components of natural waters are: A. Na+, K+, Ca2+, Ag+;
B. Cu2+, Pb2+, Hg2+, Cd2+; C. Cl–, НСО3–, СО32–, SO42–; D. Н+, ОН–, Mg2+, Al3+; E. Ca2+, Fe3+, Mg2+, NH4+.