I M P R O V I N G T H E G E N E R A L I S A B I L I T Y O F
B R A I N C O M P U T E R I N T E R FA C E A P P L I C AT I O N S
V I A M A C H I N E L E A R N I N G A N D
S E A R C H - B A S E D H E U R I S T I C S
ja s o n
a d a i r
Doctor of Philosophy
Institute of Computing Science and Mathematics
University of Stirling
D E C L A R AT I O N
I hereby declare that this thesis has been composed by me, that the work and results have not been presented for any university degree prior to this, and that the ideas that I do not attribute to others are my own
Stirling, March 2018
A B S T R A C T
Brain Computer Interfaces (BCI) are a domain of hardware/software in which a user can interact with a machine without the need for motor activity, commu-nicating instead via signals generated by the nervous system. These interfaces provide life-altering benefits to users, and refinement will both allow their ap-plication to a much wider variety of disabilities, and increase their practicality. The primary method of acquiring these signals is Electroencephalography (EEG). This technique is susceptible to a variety of different sources of noise, which compounds the inherent problems in BCI training data: large dimensionality, low numbers of samples, and non-stationarity between users and recording sessions. Feature Selection andTransfer Learning have been used to overcome these problems, but they fail to account for several characteristics of BCI. This thesis extends both of these approaches by the use of Search-based algorithms.
Feature Selection techniques, known asWrappersuse ‘black box’ evaluation of feature subsets, leading to higher classification accuracies than ranking methods known as Filters. However, Wrappers are more computationally expensive, and are prone to over-fitting to training data. In this thesis, we applied Iterated Local Search (ILS)to the BCI field for the first time in literature, and demonstrated competitive results with state-of-the-art methods such as Least Absolute Shrinkage and Selection Operator and Genetic Algorithms. We then developed ILS variants with guided perturbation operators. Linkagewas used to develop a multivariate metric, Intrasolution Linkage. This takes into account pair-wise dependencies of features with the label, in the context of the solution. Intrasolution Linkage was then integrated into two ILS variants. The Intrasolution Linkage Score was discovered to have a stronger correlation with the solutions predictive accuracy on unseen data thanCross Validation Error (CVE)on the training set, the typical approach to feature subset evaluation.
Mutual Informationwas used to createMinimum Redundancy Maximum Rel-evance Iterated Local Search (MRMR-ILS). In this algorithm, the perturbation
operator was guided using an existing Mutual Information measure, and compared with current Filter and Wrapper methods. It was found to achieve generally lower CVE rates and higher predictive accuracy on unseen data than existing algorithms. It was also noted that solutions found by the MRMR-ILS provided CVE rates that had a stronger correlation with the accuracy on unseen data than solutions found by other algorithms. We suggest that this may be due to the guided perturbation leading to solutions that are richer in Mutual Information.
Feature Selection reduces computational demands and can increase the accuracy of our desired models, as evidenced in this thesis. However, limited quantities of training samples restricts these models, and greatly reduces their generalisability. For this reason, utilisation of data from a wide range of users is an ideal solution. Due to the differences in neural structures between users, creating adequate models is difficult. We adopted an existing state-of-the-art ensemble technique Ensemble Learning Generic Information (ELGI), and developed an initial optimisation phase. This involved using search to transplant instances between user subsets to increase the generalisability of each subset, before combination in the ELGI. We termed thisEvolved Ensemble Learning Generic Information (eELGI). The eELGI achieved higher accuracy than user-specific BCI models, across all eight users. Optimisation of the training dataset allowed smaller training sets to be used, offered protection against neural drift, and created models that performed similarly across participants, regardless of neural impairment.
Through the introduction and hybridisation of search based algorithms to several problems in BCI we have been able to show improvements in modelling accuracy and efficiency. Ultimately, this represents a step towards more practical BCI systems that will provide life altering benefits to users.
A C K N O W L E D G M E N T S
This journey would never have been possible without the love and support of my parents, Jean and Bill, and it is a journey I would never have dared undergo, without my partner, Melanie. I can’t express my thanks enough to my supervisors Gabriela, Sandy, and Fabio, for their never ending advice and inspiration over the past four years. I would also like to thank my friends: Paul, Sarah, Ken, Kevin and Saemy for their general encouragement every step of the way. And to Andrew for an uninterrupted stream of motivational cat GIFs over the final two months.
“Make it so.”
L I S T O F P U B L I C AT I O N S
This thesis has produced three peer-reviewed publications:
1. [1] Jason Adair, Alexander Brownlee, and Gabriela Ochoa.Evolutionary
Algorithms with Linkage Information for Feature Selection in Brain
Computer Interfaces. In Advances in Intelligent Systems and Computing,
volume 513, pages 287-307. 2017. ISBN 9783319465616. doi: 10.1007/ 978-3-319-46562-3-19. This paper serves as the foundation for Chapter5. 2. [3] Jason Adair, Alexander E. I. Brownlee, and Gabriela Ochoa.Mutual
information iterated local search: A wrapper-filter hybrid for feature
selection in brain computer interfaces. In Applications of Evolutionary
Computation, pages63-77, Cham, 2018. Springer International Publishing.
ISBN978-3-319-77538-8. This paper serves as the foundation for Chapter 6.
3. [2] Jason Adair, Alexander Brownlee, Fabio Daolio, and Gabriela Ochoa.
Evolving training sets for improved transfer learning in brain
com-puter interfaces. In Machine Learning, Optimization, and Big Data, pages
186-197. Springer International Publishing,2018. ISBN978-3-319-72926-8.
C O N T E N T S
i i n t r o d u c t i o n 1
1 i n t r o d u c t i o n 2
1.1 The Need for BCI . . . 2
1.2 The BCI Paradigm . . . 3
1.3 Problems in the Data . . . 3
1.3.1 Signal to Noise Ratio . . . 4
1.3.2 Difficulties in Collection of Training Data . . . 4
1.3.3 Non-Stationarity . . . 5
1.3.4 Curse of Dimensionality . . . 5
1.4 Possible Solutions . . . 6
1.5 Contributions of this Thesis . . . 7
1.6 Structure of this Thesis . . . 9
ii b a c k g r o u n d 11 2 c h a p t e r 2 - b a c k g r o u n d 12 2.1 Biology . . . 12
2.1.1 Neurons . . . 12
2.1.2 Signal Transmission . . . 13
2.1.3 Detectable Neural Signals . . . 14
2.2 Types of BCI Recording . . . 18
2.2.1 Invasive Methods . . . 19
2.2.2 Non-Invasive . . . 22
2.3 Non-Invasive BCI Paradigms . . . 26
2.3.1 Sensorimotor . . . 27
2.3.2 Slow Cortical Potentials (SCP) . . . 27
2.3.3 Visually Evoked Potentials (VEP) . . . 28
2.3.4 P300. . . 28
2.3.5 Summary . . . 30
Contents ix 2.4.1 Referencing . . . 30 2.4.2 Frequency Filtering . . . 31 2.4.3 Normalisation . . . 31 2.4.4 Artefact Removal . . . 31 2.5 Types of Features . . . 33
2.5.1 Time Domain Features . . . 33
2.5.2 Frequency Domain Features . . . 34
2.5.3 Time-Frequency Domain Features . . . 37
2.5.4 Feature Vector Construction . . . 38
2.5.5 Summary . . . 38
2.6 Classifiers . . . 39
2.6.1 Classifier Taxonomy . . . 39
2.6.2 Fisher’s Linear Discriminant Analysis (FLDA) . . . 40
2.6.3 Bayesian Linear Discriminant Analysis (BLDA) . . . 41
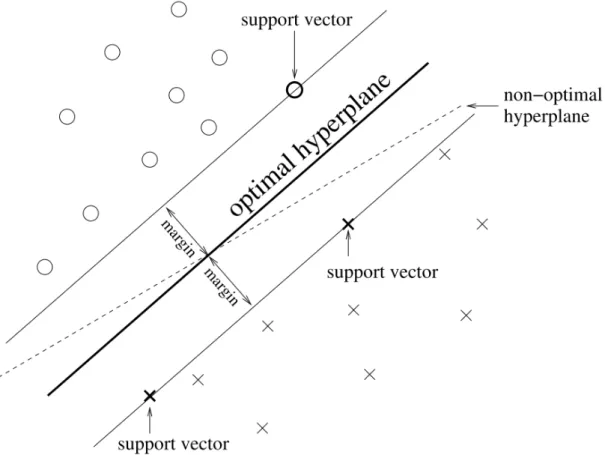
2.6.4 Support Vector Machine (SVM) . . . 42
2.6.5 k-Nearest Neighbour (KNN) . . . 43
2.6.6 Artificial Neural Networks (ANN) . . . 44
iii l i t e r at u r e 45 3 c h a p t e r 3 - l i t e r at u r e 46 3.1 Feature Selection . . . 46 3.1.1 Filters . . . 47 3.1.2 Wrappers . . . 50 3.1.3 Embedded . . . 55 3.1.4 Hybrid Approaches . . . 55
3.1.5 Feature Selection Summary . . . 57
3.2 Transfer Learning . . . 57 3.2.1 Ensembles . . . 58 3.2.2 ELGI . . . 59 3.3 Summary . . . 60 iv m e t h o d o l o g y 61 4 c h a p t e r 4 - e x p e r i m e n ta l s e t u p 62 4.1 Datasets . . . 62
Contents x
4.1.1 Dataset D1- Berlin BCI competition II Datasets III . . . . 63
4.1.2 Dataset D2- Berlin BCI competition II Datasets IV . . . . 65
4.1.3 Dataset D3- Riken - Subject A . . . 66
4.1.4 Dataset D4- P300Speller (Hoffman) . . . 68
4.1.5 Feature Extraction . . . 70
4.2 Size of Selected Feature Subset . . . 73
4.3 Fitness Function . . . 73
4.4 Tools . . . 73
v l i n k a g e 75 5 c h a p t e r 5 - l i n k a g e 76 5.1 Introduction . . . 76
5.2 Preliminary Algorithm Exploration . . . 76
5.2.1 Experimental Parameters . . . 77
5.2.2 Algorithm Performance Comparison . . . 79
5.2.3 Evidence of Feature Interaction . . . 80
5.2.4 Discussion of Selected Features . . . 81
5.3 Linkage Integration Design . . . 83
5.3.1 Linkage Map Generation . . . 84
5.3.2 Linkage in Dataset D1 . . . 85
5.3.3 Linkage Integration . . . 87
5.3.4 Results and Discussion . . . 89
5.3.5 ILS with Linkage . . . 94
5.4 Analysis . . . 95 5.5 Conclusion . . . 96 vi m u t ua l i n f o r m at i o n 98 6 c h a p t e r 6 - m u t ua l i n f o r m at i o n 99 6.1 Mutual Information . . . 99 6.1.1 Entropy . . . 100 6.1.2 Mutual Information . . . 100
6.1.3 Minimal Redundancy Maximum Relevance . . . 101
6.2 Proposed Method - MRMR-ILS . . . 102
Contents xi
6.2.2 Minimal Redundancy Maximal Relevance-Iterated Local
Search . . . 103
6.3 Methodology . . . 103
6.3.1 Classifiers . . . 104
6.3.2 Fitness Function . . . 106
6.3.3 Search Algorithm Parameters . . . 106
6.3.4 Benchmark Methods . . . 106
6.4 Results and Discussion . . . 107
6.5 Conclusion . . . 114
vii i n s ta n c e t r a n s f e r 119 7 c h a p t e r 7 - i n s ta n c e t r a n s f e r 120 7.1 Transfer Learning In BCI . . . 120
7.1.1 Ensembles . . . 121 7.2 Methodology . . . 122 7.2.1 Dataset . . . 122 7.2.2 Classifier . . . 122 7.2.3 Conditions . . . 123 7.2.4 Compared Algorithms . . . 124
7.3 Evolved ELGI Ensemble . . . 126
7.4 Results . . . 127
7.5 Discussion and Conclusion . . . 131
viii s u m m a r y a n d c o n c l u s i o n s 133 8 c h a p t e r 8 - s u m m a r y a n d c o n c l u s i o n s 134 8.1 Contributions . . . 137
8.2 General Conclusion . . . 139
8.2.1 Potential Impacts of our Contributions . . . 140
8.3 Summary . . . 140
8.4 Future Work . . . 141
ix a p p e n d i c e s 1 a a p p e n d i x 2 a.1 Feature Reference Table for Datasets D1 . . . 2
Contents xii
a.2 Feature Reference Table for Datasets D2 . . . 3 a.3 Feature Reference Table for Datasets D3 . . . 4 a.4 Participant Descriptions (Dataset D4: P300Speller (Hoffman)) . 5
L I S T O F F I G U R E S
Figure1.1 A simplified diagram of the Brain Computer Interface
paradigm . . . 3
Figure2.1 An example of a typical presynaptic (signal generating)
neuron with its synapses making contact with a postsyn-aptic (signal receiving) cell [173]. . . 13
Figure2.2 Differing areas of activation between imagined left and
right hands squeezing a ball . . . 15
Figure2.3 Diagram displaying discrete sampling of an analogue
signal preserving the waveform . . . 16
Figure2.4 Recording techniques in order of invasiveness. . . 18
Figure2.5 Photograph of a NeuroScan64-electrode EEG cap. Image
courtesy of [50] . . . 26
Figure2.6 Visual stimuli presented to the user in (a), where each
column and row are flashed randomly . . . 29
Figure2.7 Examples of different noise sources. (a) EEG signal with
no obvious noise, (b) blink, (c) eye movement (EOG), (d)50Hz interference, (e) Muscle movement (EMG), (f)
Heart beat (ECG) [16] . . . 32
Figure2.8 Review of Feature Extraction methods reported in [14] . 36
Figure2.9 Comparison between PCA and LDA . . . 40
Figure2.10 A depiction of a Support Vector Machine (SVM). . . 43
Figure3.1 Search path of the Iterated Local Search (ILS) Algorithm
[64] . . . 54
Figure4.1 A timeline of the experimental paradigm used in Berlin
BCI Competition II Dataset III. . . 63
Figure4.2 The electrode configuration for D1: Berlin BCI
List of Figures xiv
Figure4.3 The electrode configuration for D2: Berlin BCI
Competi-tion II Dataset IV . . . 65
Figure4.4 A timeline of the experimental paradigm used in the
Riken - Subject A dataset. . . 67
Figure4.5 The electrode configuration for the Riken - Subject A . . 67
Figure4.6 Images presented in the P300paradigm . . . 69
Figure4.7 The electrode configuration for Dataset D4 . . . 70
Figure5.1 Box plots comparing the error rates of solutions found
by each algorithm over30runs. . . 80
Figure5.2 Selected features according to individual predictive
ac-curacy . . . 81
Figure5.3 Most commonly selected channels in best performing
solutions found . . . 82
Figure5.4 Most commonly selected frequency bandwidths in best
performing solutions found . . . 82
Figure5.5 Most commonly selected epochs in best performing
solu-tions found . . . 83
Figure5.6 Sequence diagram displaying the incorporation of
Link-age in the Feature Selection phase . . . 84
Figure5.7 Linkage scores between all potential feature pairings . . 86
Figure5.8 Figure5.7filtered to display only benign linkage . . . . 87
Figure5.9 Figure5.7filtered to display only malign linkage . . . . 88
Figure5.10 Preliminary testing of different methods of linkage
guid-ance in Hill Climbing algorithms . . . 90
Figure5.11 Comparison of error rates obtained by Iterated Local
Search, and Iterated Local Search with guidance via pos-itive and negative linkage . . . 95
Figure6.1 Mutual Information between variablesXand Y(I(X;Y)),
seen as the over lap of the entropies of X(H(X)) andY
(H(Y)). . . 101
Figure6.2 Minimum Redundancy Maximum Relevance (mRMR)
List of Figures xv
Figure6.3 Comparison of the most selected features of the ILS and
MRMR-ILS algorithms on datasetD1- BCI Competition II dataset III . . . 112
Figure6.4 Comparison of the most selected features of the ILS and
MRMR-ILS algorithms on datasetD2- BCI Competition II dataset IV . . . 113
Figure6.5 Comparison of the most selected features of the ILS and
MRMR-ILS algorithms on datasetD3- Riken . . . 114
Figure6.6 Comparison between ILS and MRMR-ILS over each
iter-ation of the algorithms for the KNN classifier on dataset
D1- BCI Competition II dataset III . . . 115
Figure6.7 Comparison between ILS and MRMR-ILS over each
iter-ation of the algorithms for the SVM classifier on dataset
D1- BCI Competition II dataset III . . . 116
Figure6.8 Comparison between ILS and MRMR-ILS over each
iter-ation of the algorithms for the KNN classifier on dataset
D2- BCI Competition II dataset IV . . . 116
Figure6.9 Comparison between ILS and MRMR-ILS over each
iter-ation of the algorithms for the SVM classifier on dataset
D2- BCI Competition II dataset IV . . . 117
Figure6.10 Comparison between ILS and MRMR-ILS over each
iter-ation of the algorithms for the KNN classifier on dataset
D3- RIKEN Subject A . . . 117
Figure6.11 Comparison between ILS and MRMR-ILS over each
it-eration of the algorithms for the SVM classifier onD3 -RIKEN Subject A . . . 118
Figure7.1 Division of paradigm into smaller sub-problems within
each run. . . 123
Figure7.2 ELGI approach displaying two classifiers are trained for
every participant. . . 125
Figure7.3 Algorithm performance by number of stimuli
present-ations, with differing quantities of participant-specific training data available . . . 128
List of Figures xvi
Figure7.4 Round Accuracy over all testing sets displayed for each
quantity of participant-specific training data, separated for each participant. . . 129
Figure7.5 Round Accuracy over all quantities of training data for
each testing set, separated for each participant. . . 130
Figure7.6 Fit of hierarchical linear models, with random effects
for each participant, estimating (a) the overall Round Accuracy per testing set and (b) the change in Round Accuracy over training set size. . . 131
L I S T O F TA B L E S
Table2.1 Summary of frequency bands according to each
record-ing method . . . 17
Table4.1 Description of Dataset D1: Berlin BCI Competition II:
Dataset III . . . 64
Table4.2 Description of Dataset D2: Berlin BCI Competition II:
Dataset IV . . . 66
Table4.3 Description of Dataset D3: Riken - Subject A . . . 68
Table4.4 Description of Dataset D4: P300Speller (Hoffman) . . . 70
Table4.5 The number of features extracted from Datasets D1, D2,
and D3 . . . 71
Table4.6 Overview of datasets used in the following experiments 72
Table5.1 Comparison of Cross Validation Error Rates between
Greedy Linkage algorithms and Linkage-guided Hill Climbing algorithms . . . 93
Table5.2 Table comparing the correlation of solution fitness (CVE
Rate) and predictive accuracy on unseen data . . . 96
Table6.1 Results of each feature selection algorithm while using
the KNN Classifier . . . 108
Table6.2 Results of feature selection algorithm while using the
SVM Classifier with selected subset sizes (Selected f) . . 110
Table6.3 Correlations between Cross Validation Error Rates and
Accuracy of Solution during ILS and MRMR-ILS Search 115
Table A.1 Indices of Power Spectral Density features according to
the frequency, channel, and time epoch for Dataset D1:
Berlin BCI Competition III dataset. . . 2
Table A.2 Indices of Power Spectral Density features according to
the frequency, channel, and time epoch for Dataset D2:
List of Tables xviii
Table A.3 Indices of Power Spectral Density features according to
the frequency, channel, and time epoch for Dataset D3:
Riken - Subject A. . . 4
Table A.4 Table provides a description of the participants within
L I S T O F A C R O N Y M S
ACO Ant Colony Optimisation
ALS Amyotrophic Lateral Sclerosis
ANN Artificial Neural Networks
AR Autoregressive Modelling
BBO Biogeography Based Optimisation
BCI Brain Computer Interface
BLDA Bayesian Linear Discriminant Analysis
BOLD Blood Oxygenation Level Dependent
CFS Correlation-Based Feature Selection
cGA Compact Genetic Algorithm
CSD Current Source Density
CSP Common Spatial Patterns
CVE Cross Validation Error
DE Differential Evolution
DPSO Discrete Particle Swarm Optimisation
DWT Discrete Wavelet Transform
EA Evolutionary Algorithm
ECG Electrocardiography
ecGA Extended Compact Genetic Algorithm
ECoG Electrocorticography
EDA Estimation of Distribution algorithm
List of Tables xx
eELGI Evolved Ensemble Learning Generic Information
ELGI Ensemble Learning Generic Information
EMG Electromyography
EOG Electrooculography
ERD Event Related Desynchronisation
ERP Event Related Potential
ERS Event Related Synchronisation
FCBCSP Filter Bank Common Spatial Pattern
FCBF Fast Correlation Based Filter
FLDA Fisher’s Linear Discriminant Analysis
fMRI Functional Magnetic Resonance Imaging
FS Fisher Score Algorithm
GA Genetic Algorithm
GA-SVM Genetic Algorithm Support Vector Machine
GLFS Greedy Linkage Feature Selection
HC Hill Climbing
HS Harmony Search
ICA Independent Component Analysis
ILS Iterated Local Search
ILS/GA Iterated Local Search Guided Mutation
IWO Invasive Weed Optimisation
L-ILS Linkage-Iterated Local Search
LASSO Least Absolute Shrinkage and Selection Operator
LDA Linear Discriminant Analysis
List of Tables xxi
LFP Local Field Potentials
KNN K-Nearest Neighbour
MA Memetic Algorithm
MEG Magnetoencephalography
MIBIFS Mutual Information Best Individual Feature Selection
MIFS Mutual Information Feature Selection
MIRSR Mutual Information-based Rough Set Reduction
ML Mutual Linkage
MLFS Maximum Linkage Feature Selection
MLP Multilayer Perceptron
mRMR Minimum Redundancy Maximum Relevance
mRMR-ILS Minimum Redundancy Maximum Relevance Iterated Local Search
MRP Movement Related Potentials
MSE Mean Squared Error
MUA Multiple Unit Activity
NIRS Near Infrared Spectroscopy
NSGA-II Non-dominated Sorting Genetic Algorithm-II
PCA Principle Component Analysis
PILS Population Based Iterated Local Search
PSD Power Spectral Density
PSO Particle Swarm Optimisation
PSOBE Particle Swarm Optimisation Backwards Elimination
RFE Recursive Feature Elimination
SBS Sequential Backward Search
List of Tables xxii
SFFS Sequential Forward Floating Search
SFS Sequential Forward Search
SLII Standard Learning Individual Information
SNR Signal-to-Noise Ratio
SQUIDs Superconducting Quantum Interference Devices
SSVEPs Steady-State Visual Evoked Potentials
SUA Single Unit Activity
SVM Support Vector Machine
TLBO Teaching Learning Based Optimisation
TVEPs Transient Visual Evoked Potentials
VEP Visual Evoked Potential
Part I
1
I N T R O D U C T I O NIn this thesis we present our research on search techniques for improving the effectiveness of training datasets in Brain Computer Interface applications. We introduce intelligent operators that are effective in Feature Selection, and improve the performance of systems trained on a population of users (Instance Transferral). We begin by introducing BCI and the problems needing to be addressed in this challenging area, then move on to the possible solutions, before introducing the contributions of this thesis.
1.1 t h e n e e d f o r b c i
Brain Computer Interfaces (otherwise known asBrain Machine Interfaces) are a domain of hardware/software in which a user can interact with a machine without the need for motor activity [185], communicating instead via signals
generated by the nervous system. In real world applications, this interface sup-ports users in controlling artificial limbs, underpins assisted communication devices, administering psychological treatments, and finds use in recreational applications [19]. If a method of accurately measuring the structures and
be-haviours of the brain can be devised, a new horizon in science will open to us: from replacing missing limbs, to augmenting what is already there. However, this is far from a trivial task.
The brain is an exceptionally complex organ with a large degree of plasticity. This means that simple, catch-all models for predicting signals are all but impossible, and we must customise the models for each user to some degree. This customisation can be expensive in terms of computational costs, data requirements, and can also lead to over-fitting. For these reasons we turn to intelligent search methods to ensure that the model is customised as accurately and efficiently as possible using the limited data available.
1.2 t h e b c i pa r a d i g m 3
1.2 t h e b c i pa r a d i g m
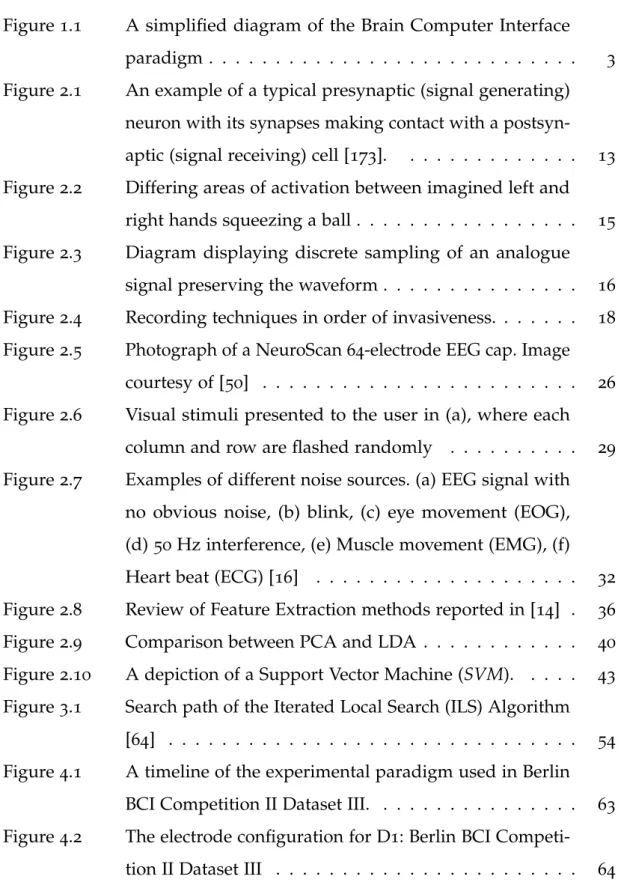
Figure1.1: A simplified diagram of the Brain Computer Interface paradigm
Brain Computer Interface (BCI)applications typically seek to acquire neurological signals and derive a discrete classification of the user’s intent. For example, allowing a user to select onscreen prompts to control a communication device. To achieve this, they rely on the architecture in Figure 1.1.
Signal Acquistion detects and records the neurological signals. Signal Pre-processing removes artefacts and generates numerical representations of the data, known as features, for creation of a predictive model.Feature Selection
selects only the most relevant features to create a model; ensuring a strong representation of the patterns that are required for the system. Classification
involves training a model, and using it to assign classes to new, unlabelled inputs.BCI Outputcan be used to control hardware or software.
1.3 p r o b l e m s i n t h e d ata
BCI relies on signals that originate from the electrical activity in a network of ~860billion interconnected neurons, of more than one thousand different types
[72]. Each of these individual neurons is connected to an average of seven
thousand others, resulting in an estimated total of one quadrillion connections. Directly sampling the electrical activity of this entire network is impossible, and even localised sampling comes at great cost.
Approaches to obtain neurological recordings can be separated into two main groupings; invasive and non-invasive. While invasive recordings can
1.3 p r o b l e m s i n t h e d ata 4 allow exceptional spatial and temporal resolutions, they involve sub-cranial surgery with potentially severe health risks and prohibitive financial costs [123]. With these problems in mind, we find that the non-invasive method, Elec-troencephalography (EEG), is the most popular method of detecting neurological signals for BCI [129]. This technique avoids difficulties associated with invasive
methods, but introduces and exasperates others including: Signal-to-Noise Ratios, lack of training data, non-stationarity, and increased dimensionality [140]. Each of these problematic areas are now summarised briefly.
1.3.1 Signal to Noise Ratio
EEG involves the placement of electrodes on the scalp surface, measuring the electrical fields of the underlying neural matter, and relaying it back to a computer for processing. This technique has become prominent over other more invasive methods due to its ease of maintenance, substantially safer lack of invasive procedures, and relative low cost [186]. However, it does present
some non-trivial problems: as the electrodes that detect the electrical fields are placed on the scalp, the signal must be powerful enough to penetrate two to three centimetres of cranium, skin and other biological material [179]. For this
level of energy to be generated, approximately one hundred million neurons over six square centimeters of neural matter must be active [156], resulting
in low spatial resolution, contamination of signals between electrodes, and natural band passing of the frequencies when travelling through the skull. The signal is further distorted by additional electrical signals being detected from eye movements (electro-oculography), muscle movements (electromyography), and environmental noise (for example, the 50 Hz band often consists of
electrical activity from nearby wall sockets [123]).
1.3.2 Difficulties in Collection of Training Data
User concentration is paramount to ensure that the training data acquired is of adequate quality to create good models. Unfortunately, BCI paradigms are often tediously repetitive tasks, resulting in the recording of large training
1.3 p r o b l e m s i n t h e d ata 5 sets requiring a substantial quantity of time. This results in user concentration deterioration, and unreliable instances being introduced into our datasets [172]. The recording sessions are also limited by the expense of the equipment,
the technician, and the user’s willingness to continue. Due to these issues, BCI recordings contain relatively small numbers of samples, making it difficult to create an adequate model.
1.3.3 Non-Stationarity
One of the key issues in BCI is that the signals are non-stationary: neural patterns not only differ between users, but are also subject to temporal drift; where patterns within data obtained from a single user change drastically over time [80].Zero Trainingsystems, trained exclusively on users from previous
sessions, are an ideal goal; however, this non-stationarity means highly accurate Zero Training systems may not be possible. Consequently, focus must be placed on minimising the user-specific training information required by maximising the effectiveness of the data available.
1.3.4 Curse of Dimensionality
In recent years, new types of recording equipment have been developed and significant increases in electrode densities have been attained. However, these further exasperate the already considerable computational load by increasing the dimensionality of the signals, and adding additional inconvenience and expense to the end user. In EEG for example, it is recommended that the sampling rate be approximately three times higher than the upper limit of the filter e.g. 70Hz requiring no less than 200 samples per second [162]. As 32-256 channel devices are commonly used, in excess of 50,000samples per
second are to be expected which inevitably proves to be very computationally expensive. Advances in another recording technique known as intercellular recording, have doubled the number of recordable neurons every seven years since the1950s [165], and suffers the additional issue of limited bandwidth.
1.4 p o s s i b l e s o l u t i o n s 6
1.4 p o s s i b l e s o l u t i o n s
Ideally, a portable BCI should be created that allows maximum degrees of control over peripherals while still maintaining a functional response time [96].
To achieve this, we must increase the Signal to Noise Ratio, while decreasing the volume of data presented to the classifier to ensure that it can respond quickly [20]. Feature Selection has been demonstrated to be an effective
solu-tion to this problem: Rejecting a substantive porsolu-tion of the data can not only lower the computation requirements, but can also increase predictive accuracy [112, 145] and potentially allows additional classes to be included, increasing
the Degrees Of Freedom for the user [52].
The high dimensional nature of BCI data is further complicated by the small number of training instances available, sometimes known as the ‘largep, small
n’ problem [34]. While Feature Selection reduces this problem, additional
instances are sometimes necessary.Transfer Learningallows knowledge to be taken from prior participants for the purpose of developing future models [80].
However, variations between different users can cause poorly fitted models, which can be overcome through Instance Transfer[180]. This optimisation of
weights and movement of data is non-trivial and exceedingly difficult due to the aforementioned issues. The resulting large and complex search spaces mean that Search-based algorithms for use in Feature Selection and Transfer Learning are a critical area of research in BCI.
In summary, Brain Computer Interfaces provide the worst-case-scenario for machine learning: high dimensionality, low numbers of training samples, low signal-to-noise ratios, non-stationary sources, and cross-contamination between vectors. We can use search based techniques to address these prob-lems.Feature Selectioninvolves obtaining near optimal feature subsets to reduce the dimensionality of the data, thus decreasing the training and prediction time costs, creating simpler models, and increasing the predictive accuracy [190].Instance Selectionallows detection of relevant, participant independent
instances to train models for new patients, reducing calibration times, financial expense, and user distress.
1.5 c o n t r i b u t i o n s o f t h i s t h e s i s 7 Specifically, we ask the following questions;
RQ1 Can existing feature selection methods be improved upon by integration of additional measures of solution subset relevance?
RQ2 Do solutions found by algorithms that include these measures better generalise to new, unseen data?
RQ3 Can datasets from prior users be better utilised to improve models for new users? Specifically, can they be used to:(i)reduce the training data required; (ii) increase predictive accuracy; (iii) mitigate difficulties in interpreting user-input with neurological damage; and(iv)mitigate the effects of temporal drift.
1.5 c o n t r i b u t i o n s o f t h i s t h e s i s
The primary focus of this thesis is to improve search techniques for Feature Selection and Instance Transfer for EEG data in Brain Computer Interface applications. The overall contribution will be the utilisation of Information Theory based metrics, Linkage information, and classifier accuracy to obtain more generalisable feature subsets, and optimisation of data subsets between users for creation of ensemble methods. This is divided into the following more specific contributions:
1. An exploration of search methodologiesfor Feature Selection on Brain
Computer Interface datasets. We have shown that Wrapper methods typically find higher quality feature subsets than Filters, giving further support to results found in literature. Iterated Local Search (ILS) was applied to the BCI field for the first time, and demonstrated to perform comparably with more computationally expensive techniques such as
Genetic Algorithms, and the state-of-the-art embedded method: LASSO;
2. Intelligent operatorswere developed to account for feature interaction
within the search space.Linkage InformationandInformation Theory based metrics were used to guide the permutation operators in ILS, with the aim of increasing the predictive accuracy of models on unseen data;
1.5 c o n t r i b u t i o n s o f t h i s t h e s i s 8
3. An investigation into effective fitness measurementsfor the
generalis-ability of optimal feature subsets. A common measure of solution quality in Wrapper approaches is Cross-validation error rates achieved from training data. However, we show that it is a poor indicator of solution improvement when the model becomes over-fitted. Metrics, such as our
Intrasolution Linkage Score, may provide better indications of a subset’s generalisability to new data. This effect may also be mitigated by includ-ing additional metrics in the search process, as demonstrated by our algorithm,Minimum Redundancy Maximum Relevance Iterated Local Search (MRMR-ILS);
4. A new method of optimising datasetsfor creating ensembles. BCI
ap-plications typically have small datasets with high dimensionality. While Feature Selection can reduce this dimensionality, limited sample numbers are still an issue when trying to create an adequate model. A state-of-the-art method known as Ensemble Learning Generic Information (ELGI)
creates an ensemble of models based on recombining the current user, with data from past users. We have developed a technique for the op-timisation of the datasets used in this process. Using a local search to perform instance transfer, we were able to increase the generalisibility of the dataset, before recombination with user-specific data. We called thisEvolved Ensemble Learning Generic Information (eELGI). We found that this technique created models that were able to achieve higher predictive accuracies even when we reduced the quantity of user-specific data avail-able. Further improvements were seen in the models resistance toneural drift: over time, a user’s neural patterns change, rendering well fitting past models ineffective. Using our technique, we find that BCI systems remain much more effective over the dataset’s two week period.
1.6 s t r u c t u r e o f t h i s t h e s i s 9
1.6 s t r u c t u r e o f t h i s t h e s i s
This thesis is structured in the following manner:
Chapter2- Backgroundgives a detailed overview ofBrain Computer Interfaces.
It first begins with the biological origin of neurological signals, and how they can bedetected for use in BCI. The methods which can be used to
elicit signalsfor identification are then discussed.Preprocessing methods are then explained, and an overview of differentclassification methodsis given.
Chapter3- Literaturediscusses publications concerning the optimisation of
BCI data.Feature Selectionis first discussed in terms ofFilter,Wrapperand
Embedded methods, after whichHybrid methodsare introduced.Transfer Learning methods are then discussed, with focus given to the use of
Ensembles in BCI.
Chapter4- Methodologygives details on theDatasets,Preprocessing, and
Fea-ture Extractionmethods used in this thesis. This is followed by parameter descriptions includingSolution Size, Fitness Functionsand Toolsused.
Chapter 5 - Linkage provides our first contribution chapter. In this, we
provide a preliminary exploration of different Wrapper methods, and discuss indications of feature interactions. Linkage-aware operators and
metricsare then developed, followed by further preliminary testing. Our first Iterated Local Search variants are introduced, in the form of a
Linkage-aware ILS. These are thenevaluatedand discussed.
Chapter 6 - Mutual Information describes a well established Information
Theory-based Filter, Minimum Redundancy Maximum Relevance (mRMR), in terms of Entropy and Mutual Information. We then describe our ILS variant Minimum Redundancy Maximum Relevance Iterated Local Search (MRMR-ILS). Following this, the methodology is detailed, and experi-mentalresultscomparing it against existingFilter andWrappermethods presented.Conclusions are then drawn.
1.6 s t r u c t u r e o f t h i s t h e s i s 10
Chapter7 - Instance Transfer begins by discussing transfer learning in BCI,
with focus on the use of Ensembles. The state-of-the-art approach En-semble Learning Generic Information (ELGI) is described. A methodology
for experimentation and a detailed description of our optimisation ap-proach, Evolved Ensemble Learning Generic Information (eELGI), is given. Experimentalresultsare then presented anddiscussed.
Chapter8- Summary and Conclusions give an overview of this thesis. The
motivation for Brain Computer Interfaces is given, followed by problems in their implementation. We then offer ourcontributions, before explicitly stating them. Ageneral conclusionis then given to demonstrate how our contributions directly address the problems in the field, followed byreal world impactsof these advancements. The thesis is then concluded in a
Part II
2
C H A P T E R 2 - B A C K G R O U N DIn order to establish the challenges facing BCI systems, we will first con-sider the Biological origins of the signals in Section 2.1, and the manner in
which they are measured (Section 2.2). Non-Invasive BCI systems rely on
paradigms to modulate these signals, which are desribed in Section2.3. Details
of Preprocessing techniques (Section2.4) and initial Dimensionality Reduction
through Feature Extraction are then given (Section2.5). Finally, a description
of Classifiers common in BCI are given (Section2.6).
2.1 b i o l o g y
Complex sequences of signals have been observed originating from a single cell in invertebrates, but it appears that behaviour in higher vertebrates is always governed by a larger number of processes [79]. At the heart of these
processes in the human brain is a network of ∼860 billion interconnected
neurons, of over one thousand different types [72]. Each neuron is connected
to an average of seven thousand others, resulting in an estimated total of one quadrillion connections [9]. While the connections are arranged in only a few
common structures, these still allow for great complexity. With so many sources of information, recording individual neurons (intracellular recordings) is an impracticality. We are therefore faced with methods which listen to populations of neurons (intercellular) by application of electrodes. The following section describes the biological source of neural signals.
2.1.1 Neurons
Firstly, it is important that we describe the structure, variety, and processes of neurons as variations in these factors introduce a great deal of complexity
2.1 b i o l o g y 13 into neural decoding. While there are two main classifications of nerve cells, the information desired to convey ‘intent’ for BCI is carried through the neurons [75]. The number of connections to and from each neuron greatly
varies between neuron types; motor neurons in the spine can have around ten thousand contacts while a neuron within the brain itself can exceed one million contacts [79].
As seen in Figure2.1, a nerve cell can be divided into4main morphological
regions; the body, dendrites, axon, and presynaptic terminals. The cell body is typically oval in shape, receiving input signals from a number of thread-like dendrites, and passing on its signal down the axon, a channel, often wrapped in a lipid sheath (myelin), that branches into terminals that end in enlarged tips known as buttons. These buttons are in close proximity with the post-synaptic (signal-receiving) cell, separated by a very small space known as the synaptic cleft.
Figure2.1: An example of a typical presynaptic (signal generating) neuron with its synapses making contact with a postsynaptic (signal receiving) cell [173].
2.1.2 Signal Transmission
The process for signal transmission in all nerve cells follows a similar proced-ure; input signal, trigger signal, conducting signal, and output signal [79], each
of which generates a detectable electrical signal known as apotential. The input signal is typically received at the dendrites, in which neurotransmitters bind to
2.1 b i o l o g y 14 surface proteins and generate an electrical charge known as a‘receptor potential’. This potential is usually faint, decaying in a matter of millimetres [79], but
should the sum of all receptor potentials supersede the threshold at the trigger zone, a larger electrical potential, known as an action potential is generated. The action potential is then carried down the axon.At the end of the axon, this signal triggers the release of neurotransmitters which bind to the dend-rites of the next (postsynaptic) cell, which generates a receptor potential [30].
Different behaviours are observed according to the different characteristics of neuron categories. Beating neurons are spontaneously active, firing even when there is no stimulation, whereas bursting neurons only fire when triggered. In beating neurons, a synaptic potential could trigger a single or a number of action potentials in a bursting cell, while beating neurons simply increase the frequency of theirs [79]. As action potentials are remarkably stereotyped, it
is not uncommon for action potentials in sensory and motor neurons to be indistinguishable. The two key features carrying information in neurons are; quantity of fires, and their timings. The number of action potentials generated is determined by a range of different factors, largely dependent on the type of neuron.
2.1.3 Detectable Neural Signals
Signals are detectable variations in physical phenomena over time. In BCI, there are two main classifications of detectable signals; hemodynamicand elec-trophysiological. Hemodynamic responses are measured by detecting changes in the properties of the blood circulating the neural matter [19]. Demand for
energy, in the form of glucose, is higher for active neurons, therefore we see an increase of blood flow within millimetres of the active region. This increase in blood flow also delivers higher levels of oxyhaemoglobin than the neurons require, resulting in a change in the ratio of oxyhaemoglobin to deoxyhaemo-globin [149]. As oxygenated blood is diamagnetic and the deoxygenated blood
is paramagnetic, this process can be measured by external equipment, like that captured by Functional Magnetic Resonance Imaging in figure 2.2.
2.1 b i o l o g y 15
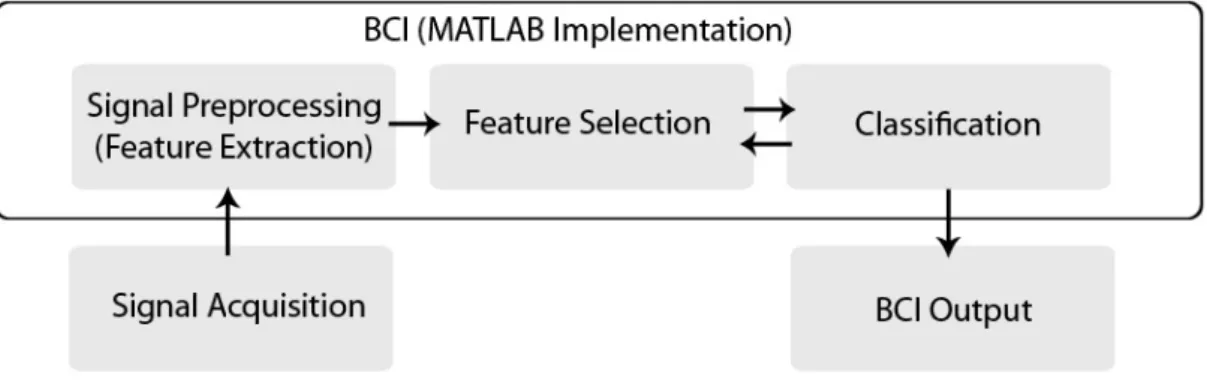
Figure2.2: Differing areas of activation between imagined left and right hands squeez-ing a ball. Captured ussqueez-ing fMRI by detectsqueez-ing decreases in the magnetic properties of blood in the regions. Image adapted using figures from [167].
Electrophysiological signals in BCI are generated by the action potentials of the firing neurons. Continuous-time signals are measurable at any point in instant time, however for use in the BCI domain, it is common to create discrete-time signals by sampling the continuous-discrete-time signal at set intervals. While this sampling reduces the resolution of the signal, adequate sampling speeds can preserve the waveform as in figure2.3. Two of the defining properties of a
signal are their amplitude (the magnitude of the signal) and their frequency [113].
2.1 b i o l o g y 16
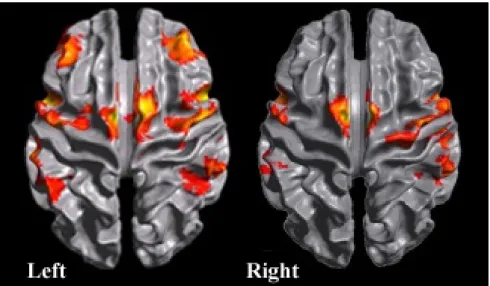
Figure2.3: Diagram displaying discrete sampling of an analogue signal preserving the waveform. The number of complete wavelengths (λ) over a given time period (t) dictates the frequency (as this is typically measured in seconds, the unit tends to be Hertz (Hz)
2.1.3.1 Frequency Bands
Analogue neural recordings rely largely on differentiation between 3 main
frequency bands that reflect the activities of groups of neurons.
l o w f r e q u e n c y b a n d s: The lowest frequency band encompasses6-13
Hz in Local Field Potentials (LFP), under 2 Hz in Electrocorticography (ECoG)
and around 67Hz in Electroencephalography (EEG)andMagnetoencephalography (MEG)recordings [179]. Changes within this range tend to be of limited use
for BCIs as it represents large populations of neurons and, due to its slow frequency, only low bit rates are possible.
m i d f r e q u e n c y b a n d s: The next band is inclusive of both the µandβ
rhythms which are both highly correlated with actual and intended movement [95]. In LFPs this band consists of16-42Hz, in ECoG it is6-30Hz and EEG and
2.1 b i o l o g y 17 of BCIs for prosthetics as they appear to desynchronize in the sensorimotor cortex when the user attempts a movement, and more interestingly, imagines a movement; suggesting that they may provide a potential method of control in prosthetic devices designed for users who lack muscle control [136]. While
it is generally agreed that these rhythms lack the detail needed to decipher the directional intentions of limb movement [123], some researchers, such as
Wolpaw [185] contend this idea and have continued to adapt EEG-based BCIs
with some success including 2D cursor control.
h i g h f r e q u e n c y b a n d s: The higher frequencies that constitute the
Gamma banding are recorded as 62-87 Hz in EEG and MEG, 34-128 Hz
in ECoG, and 63-200 Hz in LFPs [179]. When observing the motor cortex, it
has been noted that there is a close correlation between the firing of individual neurons and the gamma band during muscle contractions [51]. This would
suggest that it may provide a non-invasive source of information that is rich enough to convey directional information and is drawing increasing interest from the field. Unfortunately, this band is especially prone to noise artefacts such as electromyography (electrical signals originating in the muscles) and electrooculography (electrical signals caused by eye movements) [123].
Table 2.1: Summary of frequency bands according to each recording method
Recording Technique
LFP ECoG EEG MEG
Frequency Band (Hz)
Low 6-13 <2 67 67
Mid 16-42 6-30 10-30 10-30
High 63-200 34-128 62-87 62-87
2.1.3.2 Amplitude
Amplitude of the wave is most commonly used to observe changes in the energy of specific bandwidths, but can be used on its own for identification of neural activity. An example of this is the P300wave; when a person is attentive
2.2 t y p e s o f b c i r e c o r d i n g 18 to a specific stimulus, and something unexpected occurs, a spike in neural activity is seen approximately300 milliseconds later [118]. This is otherwise
known as the ‘oddball’ paradigm [123]. This technique is a typical example of
Peak Picking methodologies that depend on Event Related Potentials (ERPs) and is further covered in Section2.3.
2.2 t y p e s o f b c i r e c o r d i n g
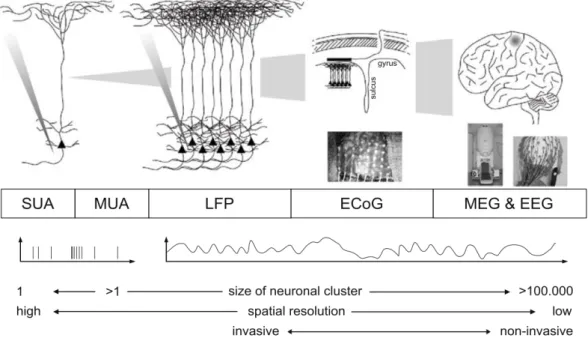
Neural data can be obtained in a number of ways, each with advantages and disadvantages. One of the most distinguishing features that sets them apart is the invasiveness of the technique. This section is structured according to this premise and will begin with highly invasive methods, and move through to non-invasive. As the techniques become less invasive, the ability to detect the activity of individual neurons is lost and instead, reliance on the activity of neuronal populations is required. Figure2.4demonstrates the level at which
each technique detects neural activity.
Figure2.4: Recording techniques in order of invasiveness. Single and Multiple Unit Activity (SUAandMUA) signals shown to detect discrete firing of indi-vidual neurons, as techniques become less invasive, they rely on regions of activity, and therefore detect analogue signals. Diagram taken from [179].
2.2 t y p e s o f b c i r e c o r d i n g 19
2.2.1 Invasive Methods
Invasive methods have the benefit of being able to measure the electrophysiolo-gical activity of the neuronal population directly, with high spatial and tem-poral resolution, but the user must undergo invasive, expensive, and poten-tially dangerous surgery [185].
2.2.1.1 Intracortical Electrodes
Intracortical recordings are known as fully invasive as they perforate the neural matter using small electrodes. This approach comes with all the risks associated with surgical intervention and brings with it the additional risk of the user’s body rejecting the foreign object, while offering a substantially richer level of information than that presented by extra-cranial approaches. One of the greatest strengths of gaining this level of detail from the neurons is the ability to match neuronal firings directly to desired movements without the need to train users with arbitrary mental associations [179]. There are3variations of
intracortical methods; intra cellular, in which individual action potentials are recorded, inter cellular, where local action potentials are recorded, and Local Field Potentials (LFP) in which all local potentials are detected.
Intracortical recordings focus on deriving the signal of a single neuron’s action potential via the insertion of an electrode, often within a small glass en-closure. Allowing an axon to grow through it creates an isolated environment due to the high resistance of the glass and provides an accurate signal with a very highSignal-to-Noise Ratio (SNR)[179]. This form of equipment means
that only a few signals can be recorded due to size and invasiveness, but it has been shown by Scott [157] that individual neurons in the sensorimotor cortex
can convey information such as position and velocity. While intracellular re-cordings demonstrate substantial potential, relying on data from such a small subset of relatively random neurons has inherent restraints.
Intercellular electrodes can be used to detect the action potentials within
100 µm of the electrode tip which can be individually identified, and this is
known as the Single Unit Activity [179]. An alternative to this is to use Multi
2.2 t y p e s o f b c i r e c o r d i n g 20 and using the averaged action potentials of the local neural population, it is possible to reduce the computational demand and also extend the viable recording distance from the tip [29]. Using this form of signal is a relatively
new development in the field but it has already yielded interesting results allowing three dimensional control of a robotic arm with a91.6% degree of
accuracy [129]. With a spatial resolution of 100µm and a temporal resolution
between 50 and 100 Hz, intercellular recordings are undoubtedly the best
candidates for a natural brain-computer interface [99].
Another extracellular recording is the local field potential (LFP). This consists of the lower frequencies (<250/300Hz) of the recorded data and is composed
of the local membrane currents, resulting in an analogue signal rather than the discrete spiking signals described previously [123]. These signals tend to be
outperformed by as little as12SU recordings, but are much more robust due
to being less reliant on spatial stability (electrode drift is a serious hindrance in SUAs). Two dimensional cursor control has been demonstrated using LFPs but of greater interest is their correlation with Gamma frequencies detected by electrocochleography (ECoG). These information rich bands are thought to be a reflection of underlying action potentials, suggesting that LFPs actually contain a significant level of actual neural firing data, hinting at a potentially robust and computationally inexpensive method of BCI control [156].
Invasive methods appear to be the most likely approach for successful, natural, and fluent BCI control but they come with serious risks. While surgery itself risks stroke, haemorrhages and anaesthesia complications, the electrodes are also subject to immune responses. After an electrode has been implanted, inflammation is to be expected. This inflammation typically subsides in a week, but chronic inflammation has been known to occur; tissue death around the implant is a severe, but uncommon occurrence [156]. Less rarely however,
nerve cells known as glia have been observed to encase the electrode, shielding it from the surrounding currents, effectively disabling it from further use [89]. This is further compounded by the observed behaviour of neural circuits
migrating away from the foreign object. This currently results in the need for periodic recalibration of the electrodes but neurotropic mediums are in development that will encourage neural growth in the effected regions [123].
2.2 t y p e s o f b c i r e c o r d i n g 21 It should be noted that, while complications are possible with this technique, over25,000individuals have received such implants with few negative results
and 80% of their original functionality after one year of operation. Indeed,
there have been some cases lasting over7years and still retaining usable levels
of performance [44].
2.2.1.2 Electrocorticography (ECoG)
Electrocorticography is known as a minimally invasive technique; while it is intracranial, it does not perforate the neural tissue itself and results in a low infection potential. It is performed by removing a portion of the skull and placing a grid of electrodes on the surface of the brain, just below the dura [75].
The recordings from this grid are very similar to that ofelectroencephalography (EEG), but are not filtered by the skull. This results in a better, wider range of frequencies (a five fold increase due to the lack of the natural low pass filter), a significantly better spatial resolution, (24 fold due to the proximity
of the sensors to the actual neural activity), and a substantially better SNR due to less noise from sources such as electromyography (EMG) [129]. As this
method is relatively new and requires surgical intervention, the majority of the data currently used results from patients with severe epilepsy [75]. Using
ECoG, brain regions that trigger seizures can be identified but while some patients have been waiting for this form of data collection, BCI researchers were allowed to investigate. This typically results in limited session times within a window of 4 to 5 days but long term use has been explored in
monkeys and suggests that, even after months of use, accuracy levels remain high and no recalibration is required. Even within such short time periods, it was demonstrated that users could gain a reasonable level on control over a BCI, controlling multi-dimensional cursors [123]. Perhaps more notably, Chao
[37] demonstrated that asynchronous control of a prosthetic limb is possible
in monkeys. This establishes that directional information can also be acquired from this method, and that it has a viable future, especially if methods of implantation can be improved to utilise smaller craniotomies.
2.2 t y p e s o f b c i r e c o r d i n g 22
2.2.2 Non-Invasive
To classify as a non-invasive method, the technique must not go beyond the epidermis of the user [42] which leads to a number of inherent advantages;
primarily, the lack of need for surgical intervention, but other advantages should not be underestimated: ease of removal, cost of equipment, ease of replacement and maintenance, and the speed with which it can be deployed.
2.2.2.1 Magnetoencephalography (MEG)
Rather than detecting the electrical fields generated by neurons, magnetoen-cephalography identifies the magnetic fields created by intracellular currents in dendrites. Due to the large number of different signals being presented to the sensors on the scalp, extensive hardware is required, and only SQUIDs (su-perconducting quantum interference devices) are capable of the task [178]. An
inherent issue with all superconductors however, is the need for temperatures close to absolute zero to function; creating a severe issue for BCI applications. The resulting setup requires liquid helium, stored within a Dewar chamber inside magnetically shielded room to protect against external sources of noise [123] creating a non-portable and a prohibitively expensive solution. However,
even with these shortcomings, MEG still stands to provide valuable insight into brain activity; although it is an extra cranial method that records relat-ively large neuronal populations, it has an excellent temporal resolution of around 1ms (comparable to intracranial electrodes), advances in multiple coil
implementations greatly increase the spatial resolution, it is less susceptible to the filtering effect of the skull than electrical fields, and is significantly better at detecting primary over secondary sources than EEG [163].
2.2.2.2 Functional Magnetic Resonance Imaging (FMRI)
Functional Magnetic Resonance Imaging (fMRI) detects the changes in the magnetic properties of haemoglobin in the blood vessels surrounding the neural tissue. When there is increased activity in an area of the brain, the demand for oxygen also increases, causing the flow of blood containing a high concentration of oxyhemoglobin (diamagnetic) to the area and causing
2.2 t y p e s o f b c i r e c o r d i n g 23 the blood to become paramagnetic after oxygen is extracted. This has been termed blood oxygenation level dependent (BOLD) imaging [149]. This method
shares the EEG’s lack of invasiveness and has the added advantage of an excellent spatial resolution over the entire brain. However, this is quickly negated by its reliance on indirect neural activity; due to this technique’s inherent need to observe the after effects, rather than the direct action, of the neurons, the temporal resolution suffers a delay of at least 1to2 seconds at
the most basic level. Eklund, Andersson, Ohlsson, Ynnerman and Knutsson [46] implemented a real-time BCI speller using fMRI and reported correct
identifications of actions within the87-90% region, but required in excess of 40seconds per letter. When this delay is combined with the need for a large
piece of nonportable equipment, fMRI is unlikely to serve as a practical BCI, but it will still prove an invaluable technique to decide where to place sensors for other interfaces.
2.2.2.3 Near Infrared Spectroscopy (NIRS)
NIRS is an optical technique that produces intense infrared light using an LED placed directly on the scalp. This light penetrates 1-3cm and reflected
light is detected by a photodiode (also placed on the scalp [124]. Like fMRI,
NIRS relies on BOLD responses and varying blood flow, but does not require a stationary patient in a shielded room. Instead, the required equipment is comparable to EEG, but without the need for gels, which carries with it the possibility of creating a personal BCI. As this is a relatively new technique, a number of unresolved issues are still quite prohibitive; it is limited to the outer cortical layer, its spatial limit is around 1 cm, low bit rate, haemodynamic
response delays, and difficulty in making a clean connection due to obstacles like hair [123].
2.2.2.4 Electroencephalography (EEG)
EEG is the prevalent method for implementation of BCIs for a number of reasons, but perhaps the most important comes in the form of high temporal resolutions and its almost riskless (non-invasive) application [129]. Added to
2.2 t y p e s o f b c i r e c o r d i n g 24 fMRI) and potential for portability [123], renders the rapid expansion of its
application in recent years unsurprising. EEG involves placing electrodes on the scalp of the user. A minimum of3electrodes (more typically in the region
of64or128) are required for this process; one ground, one reference and one
active stream. This is due to EEG not just merely measuring the potentials at each pad, but the difference between them by removing the common-mode potential [163] via comparisons with the reference signal. These electrodes are
placed in a standardised pattern known as the10-20system [74], which gives
a more consistent and predictable performance, further increasing the validity of the research field.
EEG systems also have substantial downsides. One problem is that the impedance between the scalp and the electrode must be sufficiently low to allow the detection of a wide spectrum of wavelengths, but techniques for reducing resistance often introduce further complication: ‘wet’ electrodes rely on the introduction of a gel or saline solution between the contact and the scalp. This dries out, limiting the recording time to an hour. ‘Dry’ electrodes are in development but often rely on amplifiers which are susceptible to environmental noise from sources such as nearby power lines [163]. One of the
greatest challenges facing EEG systems is their low signal to noise ratio, with background noise being inherited from electrocardiography (electrical activity of the heart,ECG), electromyography (electrical activity of the muscles,EMG), and electrooculography (electrical activity of the eye,EOG). These issues are further compounded by the low spatial resolution; the distance between the neural surface and the electrodes is naturally a minimum of 2-3 cm due to
the cranium [179] which results in the detection of an ‘area’, rather than the
ability to detect the activity of individual neurons. Due to the rate of decay of the signal power, Srinivasan [163] projected that almost6cm2of neural tissue
must be activated for a measurable signal to be detected, which indicates the activity in the region of100million neurons [156]. This number within such
an area would suggest that EEG may lack the ability to convey the fine detail needed for the interpretation of more natural cognitive processes, but instead will need to rely on Evoked Related Potentials (discussed later).
2.2 t y p e s o f b c i r e c o r d i n g 25 It should also be noted that the skull acts as a natural low pass filter, resulting in detections primarily within the 5-70 Hz range, while the actual
frequency generated lies between5Hz and 10kHz. The lower bandings pass
though the barrier relatively successfully, however the richer higher bands are severely hindered, removing potentially invaluable control information for the use of BCIs in prosthetics [123]. The actual equipment itself also
requires some refinement; set-up of the electrodes can be time consuming and cosmetically unattractive, but companies like Neurosky are currently bringing consumer grade EEG devices to market with a calibration time measured in tens of seconds. These consumer products are still immature, with significantly poorer signals than those of their lab counterparts and are currently unsuitable for complex BCI control [57].
With these issues in mind, the practicality of an EEG-based recording sys-tem has proven sufficiently attractive to make it, by some measure, the most common form of BCI in research [155], and the only form to venture into the
commercial market. While it was initially believed to be limited to simple binary controls, Wolpaw and McFarland [184] demonstrated two-dimensional
controls are possible, later to be surpassed by McFarland, Sarnacki and Wol-paw’s achievement of three-dimensional control [117]. Other successful
EEG-BCIs include control of communication devices [76, 84, 139, 187, 188] and
restoration of movement to paralysed limbs through detection of associated neural activity and direct stimulus of the limb [137]. This demonstrates that,
with refinement and further research, EEG-based recording devices have the potential to fulfil the requirements of many BCI applications, but solutions to their shortcomings must be sought.
2.2.2.5 Summary
Due to the properties of the skull, non-invasive (extracranial) BCIs will never have access to the intricate information flows within the brain, especially those contained within the higher frequencies. This limits the dexterity of any potential external effector, but ease of use, application, low cost and relative safety in comparison to invasive methods, will ensure that research will continue in the field, and potentially into field applications. While
EEG-2.3 n o n-i n va s i v e b c i pa r a d i g m s 26
Figure2.5: Photograph of a NeuroScan64-electrode EEG cap. Image courtesy of [50]
based BCIs are not ideal, they currently appear to be the most feasible and attractive method of getting a product ready for commercial deployment.
2.3 n o n-i n va s i v e b c i pa r a d i g m s
As non-invasive techniques cannot pass through the skull, the cranium behaves as a natural Low Pass filter. While this has the advantage of reducing some noise artefacts, it also introduces others, decreases spatial resolution, and removes higher frequencies that are potentially much richer in information than their lower counterparts. To compensate for these disadvantages, it is possible to observe Field potentials; the summation of potentials (e.g. axonal, synaptic, action) in a relatively small region. While this does not necessarily convey the same level of detail as monitoring the firing of individual neurons, it does present observable changes. These Event Related Potentials (ERPs) come in two forms; endogenous, internal mediation of potentials or rhythms, and exogenous, requiring an evoked response being triggered by an external stimulus [11]. The following section describes the methods which can be
used to create these observable changes, with particular focus given to the paradigms used in this thesis:sensorimotorand P300based approaches.
2.3 n o n-i n va s i v e b c i pa r a d i g m s 27
2.3.1 Sensorimotor
Sensorimotorbrain rhythm changes occupy the µ(8-12Hz) andβ(13-30 Hz)
bands discussed previously in Section 2.1.3.1. Observable changes in these
bandwidths are seen in relation to bodily movements, but do not require actual movement to occur [135]. These changes consist of two modulations;
event-related desynchronisation (ERD), decreases in amplitude, and event-related synchronisation (ERS), increases in amplitude, before and after movement. To trigger the modulations for BCI, users are asked to imagine physical move-ments, but this can be problematic as users will often visualise movement-associated imagery instead, which elicits different activation patterns. To counteract this, user training is often required [124]. Another form of
sensor-imotor BCI paradigm is Movement Related Potentials(MRP). MRPs consist of changes in the lowest bandwidths (<8Hz) beginning up to1.5seconds before
a movement. While these potentials carry directional information regarding the movements of the user, the bit rate is very low, often requiring averaged signals over repeated trials [179].
2.3.2 Slow Cortical Potentials (SCP)
SCPs are voltage shifts around the1Hz frequencies. Negative shifts represent
increased neuronal activity, while positive shifts represent a decrease, both of which last between 300 milliseconds and several seconds [56]. As with
sensorimotor potentials, Slow Cortical Potentials have been shown to be present in both able and less-able bodied individuals but SCP require user training. This training can be affected by a number of factors, such as the user’s pain levels, mental state, relationship with trainer, and even after several months of practice, can only achieve accuracy rates within the70-80% range
[123]. Endogenous methods are more elaborate than exogenous in that they
purposefully evoke neural reactions from stimuli, and simply measure the responses.
2.3 n o n-i n va s i v e b c i pa r a d i g m s 28
2.3.3 Visually Evoked Potentials (VEP)
Visual Evoked Potentials (VEPs) are triggered when a user is presented with a visual stimulus, with the magnitude of the response greatly increasing if the stimulus is brought closer to the centre of vision and additional attention is given to it [181]. VEPs come in two primary forms: transient, and
steady-state. Transient VEPS (TVEPS) tend to appear in response to visual changes in frequencies lower than 6 Hz, and can be triggered using flashing lights,
a brief appearance of a pattern or the reversal of an existing one [123]. The
measurement of this form of evoked potential is easily contaminated by EMG and EOG sources, and is rarely chosen over its counterpart, Steady-State VEPs. SSVEPs are a very common form of BCI control in the literature due to their high SNR, and classified according to the modulation of the stimuli presentation; time, frequency and order of stimulus presentation [123].
To control a SSVEP BCI, such as a speller, the user stares at the desired stimulus and its frequency modulates the frequency of the response detected, indicating the selected input. While this approach has the advantage of little or no user training, it does require a user to give complete visual focus to a stimulus (typically a screen) disqualifying its use as a natural BCI interface for controlling devices such as prosthetic limbs, and inoperable for sufferers of neuromuscular diseases that lack the ability to alter their gaze [129].
2.3.4 P300
Another common endogenous BCI control potential is the P300response. If a
user is observing a number of stimuli flashing seemingly randomly, focusing on one will trigger a secondary modulation in the field potential 300
milli-seconds later. This is known as an ‘odd-ball’ response as it appears to increase in amplitude according to how unlikely the stimulus is [123]. A problem with
this method is that the P300response is measured relatively to the responses of
the non-attended or expected stimulus meaning that a number of
![Figure 2.5: Photograph of a NeuroScan 64-electrode EEG cap. Image courtesy of [50]](https://thumb-us.123doks.com/thumbv2/123dok_us/859103.2609540/48.892.256.656.94.398/figure-photograph-neuroscan-electrode-eeg-cap-image-courtesy.webp)
![Figure 2.8: Review of Feature Extraction methods reported in [14]](https://thumb-us.123doks.com/thumbv2/123dok_us/859103.2609540/58.892.176.743.103.630/figure-review-feature-extraction-methods-reported.webp)
![Figure 4.2: The electrode configuration for D1: Berlin BCI Competition II Dataset III followed the International 10-20 System [74] and placed 3 electrodes at C3, Cz, and C4](https://thumb-us.123doks.com/thumbv2/123dok_us/859103.2609540/86.892.276.640.98.428/figure-electrode-configuration-competition-dataset-followed-international-electrodes.webp)
![Figure 4.6: Images presented in the P300 paradigm for the dataset used in [76]](https://thumb-us.123doks.com/thumbv2/123dok_us/859103.2609540/91.892.224.687.546.1008/figure-images-presented-p-paradigm-dataset-used.webp)
