2018 3rd International Conference on Information Technology and Industrial Automation (ICITIA 2018) ISBN: 978-1-60595-607-7
Optimization of Electro-Galvanizing Processes
Based on Taguchi Method
Zhanfeng Wang, Jianbo Wang, Wenbao Dai, Dushu Li
and Pengfei Wang
ABSTRACT
The thickness of the plating layer of the part is an important index to evaluate the plating quality, and the thickness of the film is affected by many factors, which leads to the uncertain relationship between these influencing factors and the thickness of the film; the electroplating operation based on experience or semi-empirical methods It is difficult to obtain optimal and stable process parameters, resulting in low product yield. In view of the above problems, this paper takes the low qualified rate of galvanized parts as the starting point, and uses the thickness of the film as the quality characteristic. Based on the analysis of the controllable factors affecting the thickness of the film based on the causal map analysis method, the minitab software platform is used to utilize the Taguchi test. The design method is used to study the influence degree of each influencing factor on the film thickness, analyze the optimal process parameters, and verify the quality of the parts under the optimized process based on the optimization results. The results show that the qualified rate of electroplated parts can be increased from 70% to 88% without
changing the process conditions and using the optimized process parameters.1
INTRODUCTION
The thickness of the plating is an important index to evaluate the quality, which is affected by many factors. Due to the complexity of working conditions, each operation of the electroplating may have an effect on the thickness. Therefore, the method of the calculation using the parameter theory such as current density and plating deposition rate often fails to obtain satisfactory results. It is difficult to obtain
1
optimal and stable process parameters based on experience or semi-empirical methods, resulting in low qualification rate and difficulty in determining the important influencing factors for subsequent timely adjustment and control.
In this paper, the Taguchi method is positive, the object is a batch of 17003 that has 1000 pieces. According to the plating depth, it is divided into 5 layers, each of which is 20 pieces and can be regarded as the same state. The thickness is required to be 8~12μm and is used as a quality control standard. The batch product rate is about 70%, the scrap rate is high, and the manufacturing cost is large.
The Taguchi method[1-3] is a scientific and effective quality engineering optimization design method by minimizing process sensitivity or product sensitivity to environmental variation and minimizing process variation. It can be divided into 7 steps [4]:step1: Select the quality characteristics, the thickness is used as the quality characteristic; step2: Determine the performance of the characteristics; step3: Analyze all controllable factors affecting the quality characteristics and determine various factors; step4: Determine the controllable factors and levels; step5: Design orthogonal test; step6: Run the test; step7: Data analysis.
FACTORS AND LEVELS
The main process flow for electroplating can be summarized as follows: hang, pretreatment, pre-plating, galvanizing, coloring, and post-treatment.
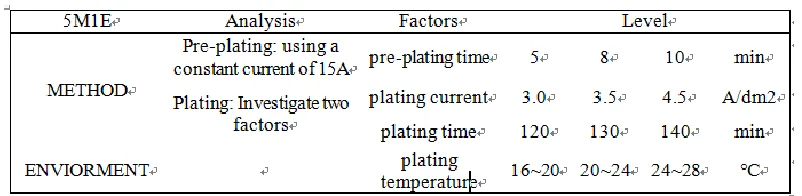
[image:2.612.99.500.555.653.2]According to the six aspects of 5M1E, the factors that may affect the thickness during the electroplating process are analyzed. Each factor is analyzed item by item to determine the controllable factors that have a greater impact on the thickness. Considering the objectivity of the test, the following operating conditions are set: First, the test process is operated by a skilled worker; second, the current is applied by a DC stabilized power supply device; and third, the composition of the plating solution is periodically analyzed, the dimensions and surface conditions are identical; the fourth is that the thickness measurement is measured by an experienced laboratory using a calibrated X-ray thickness gauge. The analysis is shown in Table I (controllable factors shown only).
OPTIMIZATION
Test Design
[image:3.612.117.444.231.396.2]According to the above analysis, the controllable factors affecting the thickness include pre-plating time, plating current, plating time and plating temperature. There are 3 levels of each controllable factor, which are 4 factors 3 levels test. For the test method, the L9 (34) orthogonal test table was selected, and the design test plan is shown in Table II.
TABLE II. TEST DESIGN SCHEME.
No. A B C D
1 5 3.0 120 16-20
2 5 3.5 130 20-24
3 5 4.5 140 24-28
4 8 3.0 130 24-28
5 8 3.5 140 16-20
6 8 4.5 120 20-24
7 10 3.0 140 20-24
8 10 3.5 120 24-28
9 10 4.5 130 16-20
A:Prepla. T, min; B:Elec. Cur., A/dm2; C:Elec-pla. T, min; D:Sol. temp., ℃
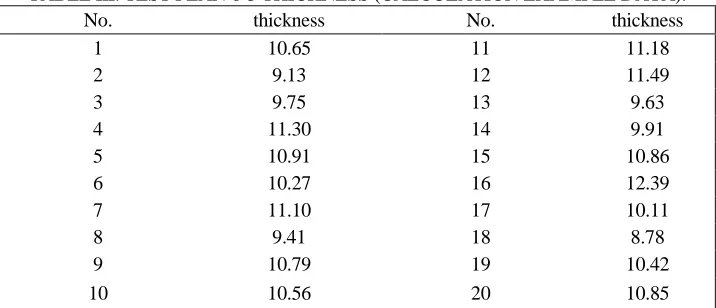
TABLE III. TEST PLAN 6-3 THICKNESS (CALCULATION EXAMPLE DATA).
No. thickness No. thickness
1 10.65 11 11.18
2 9.13 12 11.49
3 9.75 13 9.63
4 11.30 14 9.91
5 10.91 15 10.86
6 10.27 16 12.39
7 11.10 17 10.11
8 9.41 18 8.78
9 10.79 19 10.42
10 10.56 20 10.85
Data Processing
Under the test conditions, the average qualification probability of the thickness of in the range of 8~12μm is taken as the goal. The data processing is as follows [5-7]:
[image:3.612.100.458.427.581.2]Step2: Calculate the cumulative probability in the range of 8~12μm as the part qualification probability according to the fitting distribution;
Step3: Calculate the mean of the pass probability, and set it as the target value. Taking the test plan 6-(1-5) thickness data as an example, the data processing method of each step is analyzed. The calculation example data is shown in Table III.
Figure 1 is the analysis of the thickness distribution characteristics of the 6-3 parts of the test scheme. The larger the P value and the smaller the AD value, the better the goodness of the fit. Therefore, the thickness data obeys N(10.47, 0.87) normal distribution.
[image:4.612.153.443.359.553.2]According to the fitting distribution of each layer, the cumulative probability in the range of 8~12μm is calculated. The cumulative probability under the boundary conditions of 8μm and 12μm is 0.0023 and 0.9607 respectively, the subtracter is the probability of the thickness in 8~12μm. Similarly, the distribution characteristics of the thicknesses of 45 sets of each part of the 9 tests were calculated, and it was found that the thickness characteristics obey normal distribution. In order to investigate the pass rate of each test plan component, the probability average of thickness of each set of 5 layers in 8~12μm is taken as the pass rate of the thickness of the plated layer of the solution. The test data processing results are shown in Table IV.
TABLE IV. MEAN PROBABILITY OF THICKNESS OF 8~12μM.
COL. P1 P2 P3
Pro. Aver. 0.8654 0.8580 0.8073
COL. P4 P5 P6
Pro. Aver. 0.8328 0.8444 0.8610
COL. P7 P8 P9
Pro. Aver. 0.7553 0.5615 0.7777
TABLE V. S/NRESPONSE OF CONTROLLABLE FACTORS.
TABLE VI. MEAN RESPONSE OF CONTROLLABLE FACTORS. LEV
. A B C D
1 -1.4820 -1.7610 -2.5230 -1.6360
2 -1.4530 -2.6040 -1.7010 -1.6890
3 -3.2110 -1.7810 -1.9220 -2.8200
delta 1.7590 0.8430 0.8220 1.1840 Ran
k 1 3 4 2
LEV
. A B C D
1 0.8436 0.8178 0.7626 0.829 2 2 0.8461 0.7546 0.8228 0.824
8 3 0.6982 0.8153 0.8023 0.733
9 delta 0.1479 0.0632 0.0602 0.095
3
Rank 1 3 4 2
Analysis of Results
Calculate the S/N and mean response of the large-capacity probability by using the mean value of the qualification probability. The greater S/N, the better the robustness. The larger the mean, the better the effect [8-9]. The calculation results are shown in Table V and Table VI.
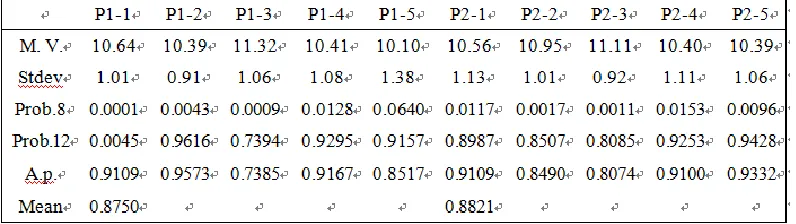
[image:5.612.118.480.531.654.2]TABLE VII. MEAN PROBABILITY OF THICKNESS UNDER OPTIMAL PARAMETERS.
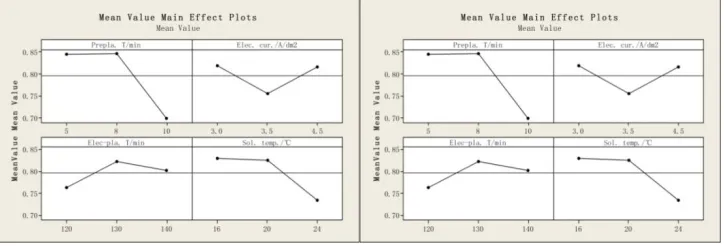
According to the factors, the importance of the S/N and the mean value are ranked, which are pre-plating time, plating temperature, plating current and plating time. In order to more intuitively analyze the influence trend of each factor on the S/N and mean value, the main effect diagrams are calculated respectively, as shown in Fig. 2 and Fig. 3. The results show that the trend of influence of S/N and mean is consistent, that is, the maximum value of the S/N is ensured while ensuring the maximization of the mean. The main effect analysis results of S/N and mean are shown in Figure 2 and Figure 3.
In summary, the pre-plating time (8min), plating current (3.0A/dm2), plating time (130min) and plating temperature (16~20°C) are the optimal parameters. Under the combination of the above process parameters, the predicted S/N is -0.4048, and the average value is 0.9281.
TEST VERIFICATION
In order to verify the quality of the optimal process parameters obtained above, the pre-plating time(8 min), the plating current(3.0 A/dm2), the plating time(130 min) and the plating temperature(16~20 °C) are set while other conditions are maintained, then, the means probability of thickness according to the previous method are calculated in Table VII.
The results show that the qualified thickness is about 88%, which is much larger than the 70% before optimization.
CONCLUSIONS
calculated too. The electroplating test showed that the pre-plating time (8 min), plating current (3.0 A/dm2), plating time (130 min) and plating temperature
(16-20℃) were maintained under normal conditions. The pass rate is approximately
88%, which is a significant improvement over the 70% before optimization.
REFERENCES
1. H.C Liao. 2004. "A Data Envelopment Analysis Method for Optimizing Multi-Response Problem with Censored Data in the Taguchi Method," Computer & Industry Engineering, 46(4):817-835.
2. M.H. Zhang, S. M. Liu, Ch. Gao, et al. 2017."Optimization on Hot Forging Process for Hub Flange Based on Taguchi Method". Forging & Stamping Technology, 42(8):17-21.
3. J.W. Yu, 2012. "Application of Taguchi Method of Bonding Technology Parameter Optimize for Packaging," Piezoelectrics & Acousto optics, 34(04):631-635.
4. H.H. Guo, C.L. Zheng, Y.J. Liu, et al. 2016. "Optimization of Electroplating Processes Based on Taguchi method," Vacuum Electronics, 2016(03):46-50.
5. Sh. N. Bing, J. Peng, Y. Xiang, et al.2010. "Study on Improving of Taguchi Method and Its Application," Electronics Process Technology, (01):20-23.
6. Y.Q. Yang, W.L. Wei, C.L. Liu, 2018. "High Corrosion Resistance of New Hot Dip Galvanizing Alloy Coating," Heat Treatment of Metals, 43(1):111-115.
7. Sh. M. Xiao, J.D. Li, W. Chen, et al.2018."Barrel Zinc Plating of Nuts for Aerospace Fasteners," Electroplating & Finishing, 37(1):5-8.
8. J.B. Yu, 2018. "Development and Application of Electrogalvanizing Technology in Industry, "Marine Electric & Electronic Technology, 38(2):35-36.