Study on Performance of Vertical Setback RC
Frames using Non-Linear (Pushover) Analysis
Malla Vasantha1, V Bhargavi2 1
PG Student Department of Civil Engineering, Visakha Technical Campus, Narava
2
Assistant Professor, Visakha Technical Campus, Narava
Abstract: Buildings are subject to different lateral loads out of which seismic loads and wind loads are predominant. The earthquake and seismic phenomenon of structures is one of the most devastating and dangerous havoc not only to human life but also to the economy of the nation life as well.
Therefore it is necessary to study the vulnerability characteristics of the structures when subjected to such a phenomenon or earthquake excitations to reduce the impact of the socioeconomic calamity. Wind loads are due to wind pressure acting on the buildings. Some of the pressure acting on exposed surfaces of structural members is directly resisted by bending of these members.
In this present work a brief discussion of how a structure behaves when subjected to lateral loads (includes seismic loads and wind loads) and its behavior under acting such loads is found. And also the behavior of the structure is studied when it is interpreted with setbacks by calculating the displacements and static pushover analysis is carried out to find its performance point.
Keywords: R.C building; irregular frame; spectral displacement; base shear; base reaction
I. INTRODUCTION
Losses inflicted on modern buildings from recent earthquakes have shown the pressing need for investigation of the seismic safety of code-compliant buildings at various performance limit states. The seismic vulnerability of a structure can be described as its susceptibility to damage by ground shaking of a given intensity. The aim of a vulnerability assessment is to obtain the probability of a given level of damage to a given building.
The aim of studying performance of buildings is to estimate and depict the damage in structures due to a specified earthquake at a specific location. Various methodologies exist for estimating the seismic vulnerability and subsequent damage in seismic areas. The methodologies are used to develop various tools such as Damage probability matrices, vulnerability functions and fragility curves, from structural damages observed during earthquakes.
A complete observed damage database would be necessary for developing such tools possible in high seismicity areas where post-earthquake surveys are available. In areas where the data is limited or incomplete, local expert opinion will be used to support observed data. Building modeling and non-linear structural analysis are other methods to stand in for the shortage of data. The present study focuses on seismic performance evaluation in various regular and setback RC buildings located in seismic zone II by carrying non-linear static analysis (pushover analysis).
II. LITERATURE REVIEW AND OBJECTIVES OF CURRENT STUDY
V Manideep conducted non-linear static analysis (pushover analysis) understand the behavior of G+9 multistoried residential building located in different seismic zones (II, III, IV, V) of India. And it was observed that, when the zone varies from II to V, base shear, displacement and time period has been increased gradually, indicating the severity of seismic activity. Haroon Rasheed Tamboli studied performance of (G+9) story reinforced cement concrete frame structure with and without masonry infill wall located in zone-3. And observed the presence of infill wall can affect the seismic behavior of frame structure to large extent, and the infill wall increases the strength and stiffness of the structure. Rahul P.Rathi considered (G+3) reinforced cement concrete buildings models located in seismic zone-3 for the analysis.
non-seismic RC frame building representative of a large inventory of buildings. A set of twenty ground motions from large magnitude earthquakes recorded at medium distances from the source is used to conduct Incremental Dynamic Analysis (IDA) for assessing its seismic capacity are considered. Results of IDA runs with the 20 ground motion records are used to assess the record-to-record randomness of response. Fragility curves defined as the probability of exceeding a damage level (yielding/collapse) at various levels of IM are then plotted for these two damage levels. Current study focuses mainly on following objectives
1) To study the performance of various regular and vertical setback RC buildings subjected to lateral loading (includes seismic and wind loads).
2) Study the effect of vertical setbacks on the stability and performance of RC buildings.
3) Perform nonlinear static analysis (push over analysis) of RC buildings using SAP2000 and find out the performance point.
III. METHODOLOGY
1) Step-1: Modelling in SAP 2000 Designing Software
2) Step-2: Application of different load cases with different load combinations
3) Step-3: Analysis of frames with soft storey at different positions
4) Step-4: Calculation of displacements and drifts for all the cases and finding the frame with maximum displacement and drift
5) Step-5: Providing the different remedial measures to that frame and again calculating drifts and displacements
6) Step-6: Comparison of the results and predicting the best suited remedial measure with least displacements and drifts
IV. MODELING CONSIDERATIONS
A. Details of the Building Considered
For the present study ‘S+10’ (stilt + 10 storeys) building located in seismic zone II and soil zone III (hard strata) is considered. Following figures shows the plan and elevation of the building
Figure 3.3 Plan area of the building considered
Figure 3.4 Elevation of the building considered
Number of bays in X- direction = 4
Number of bays in Y- direction = 4
Number of storeys Z- direction = S+10
Spacing of bays in X-direction = 4m
Spacing of bays in Y-direction = 4m
B. Details of Structural Elements Considered
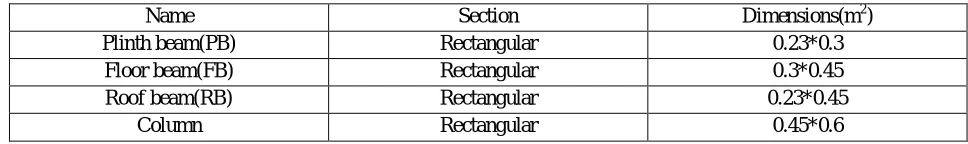
Table 3.8 Dimensions of beams and columns of the building frame
Name Section Dimensions(m2)
Plinth beam(PB) Rectangular 0.23*0.3
Floor beam(FB) Rectangular 0.3*0.45
Roof beam(RB) Rectangular 0.23*0.45
Column Rectangular 0.45*0.6
C. Dimensions of the slab and walls Considered are as Follows
Thickness of the slab = 0.185 m
Thickness of external wall = 0.23 m
Thickness of internal wall = 0.115 m
Thickness of parapet wall = 0.15 m
Height of parapet wall = 1.2 m
Loads considered
Unit weight of brick masonry = 20 kN/m3
Unit weight of reinforced cement concrete = 25 kN/m3
Live load on slab (L.Ls) = 3 kN/m2
Dead Load due to external wall (WE) = 0.23*20*(3-0.3) = 12.42 kN/m Dead Load due to internal wall (WI) = 0.115*20*(3-0.3) = 6.2 kN/m
Dead Load due to parapet wall (Wp) = 0.15*20*(1.2) = 3.6 kN/m
Dead Load due to slab (Ws) = 25*0.185 = 4.625 kN/m2
Dead load due to floor finish (WFF) = 0.75 kN/m2
Unexpected dead load (WU) = 0.75 kN/m2
Live load due to vehicle parking (L.LV) = 4 kN/m2 Now,
Live load on each beam = (L.Ls)*L/3 = 3*4/3 = 4 kN/m2 Load on internal beams due to slab dead load,
Unexpected load and floor finish = 2* (Ws+ WFF+ WU)*L/3
= 2*(4.625+0.75+0.75)*4/3
= 16.33 kN/m2 Load on external beams due to slab dead load,
Unexpected load and floor finish = (Ws+ WFF+ WU)*L/3
= (4.625+0.75+0.75)*4/3
= 8.167 kN/m2
Base floor load on plinth beam = 24*0.15 = 3.6 kN/m2
Live load on plinth beam due to vehicle parking = (L.L)v*L/3 = 4*4/3=5.33 kN/m2
D. Load Combinations Considered for Analysis
According to IS 1893(Part I) : 2002 clause 6.3.1.2 following load combinations were considered for the seismic analysis Combination 1: DL+LL
Combination 10: 1.5(DL+ EQX) Combination 11: 1.5(DL+ EQ-X) Combination 12: 1.5(DL+ EQY) Combination 13: 1.5(DL+ EQ-Y) Combination 14: 1.2(DL+ LL + WL)
E. Frames Considered for Analysis
Following frames were considered and seismic analysis was done.
1) Frame without any Setback
2) Frame with Setback at 1st bay 1st floor to Frame with Setback at 3rd bay 10th floor
V. RESULTS AND DISCUSSION
A. Pushover Analysis of a R.C. Building with Setbacks at Different Storeys
A structure is considered to be Vertical geometric irregular when the horizontal dimension of the lateral force resisting system in any storey is more than 150 percent of that in its adjacent storey.
The pushover analysis of 10-storey bare frame is performed with vertical setbacks introduced at different storeys. For rendering the variation base shear and maximum displacement, ten storey bare frames with setbacks at different storeys are considered. All these frames are of equal storey height of 3 meters and equal bay width of 4 meters. For all these pushover analysis is carried out and performance points were obtained
1) Width of top storey= 12m, Width of ground storey=16m
Figure 4.1 Building with Vertical setback 1st bay at 4thstorey
2) Width of top storey= 8m, Width of ground storey=16m
Figure 4.2 Building with Vertical setback at 2nd bay 4th storey
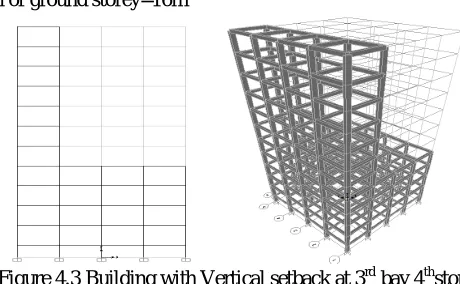
3) Width of top storey= 4m, Width of ground storey=16m
Figure 4.3 Building with Vertical setback at 3rd bay 4thstorey
16/4=4>1.5 Hence, as per IS 1893, Part 1 the structures are vertically geometric irregular structure
A table was presented below showing base reaction, base shear and maximum displacement values for all setback frames.
Table 4.1(a) Base reaction, Base Shear for vlunerable setback frames
S.No Model No. Load Combination Base Reaction (kN) Base Shear
(kN)
1 Bare frame (without
any setback)
1.2(LL+DL+WL) 67553.09 2343.58
2 Setback at 1st bay 4th floor
1.2(LL+DL+WL) 52542.70 2371.63
3 Setback at 2nd bay 4th floor
1.2(LL+DL+WL) 43662.91 2357.40
4 Setback at 3rd bay 4th floor
1.2(LL+DL+WL) 35546.78 2308.12
Table 4.1(b) Maximum Displacement for all setback frames
S.No Model No. Push Load Type Maximum Displacement (m)
1 Bare frame (without any setback) PUSHX (Push Load In +Ve X Direction) 0.546
2 Setback at 1st bay 4th floor PUSHX 0.582
3 Setback at 1st bay 5th floor PUSHX 0.575
4 Setback at 2nd bay 4th floor PUSHX 0.671
5 Setback at 3rd bay 4th floor PUSHX 0.876
B. Pushover analysis for Vulnerable Frames
The following frames are having higher displacements and base shears compared to other frame
1) Frame with Setback at 1st bay 4th floor
2) Frame with Setback at 2nd bay 4th floor
3) Frame with Setback at 3rd bay 4th floor
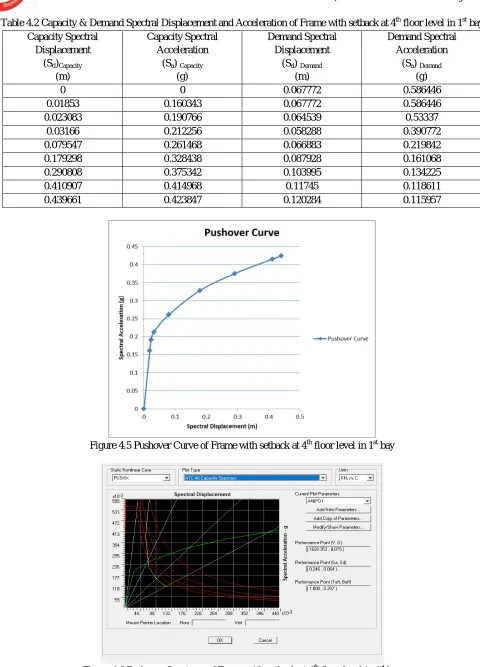
[image:5.612.186.416.83.225.2]Table 4.2 Capacity & Demand Spectral Displacement and Acceleration of Frame with setback at 4th floor level in 1st bay Capacity Spectral
Displacement (Sd)Capacity
(m)
Capacity Spectral Acceleration
(Sa) Capacity (g)
Demand Spectral Displacement
(Sd) Demand (m)
Demand Spectral Acceleration
(Sa) Demand (g)
0 0 0.067772 0.586446
0.01853 0.160343 0.067772 0.586446
0.023083 0.190766 0.064539 0.53337
0.03166 0.212256 0.058288 0.390772
0.079547 0.261468 0.066883 0.219842
0.179298 0.328438 0.087928 0.161068
0.290808 0.375342 0.103995 0.134225
0.410907 0.414968 0.11745 0.118611
[image:6.612.64.544.60.727.2]0.439661 0.423847 0.120284 0.115957
Figure 4.5 Pushover Curve of Frame with setback at 4th floor level in 1st bay
[image:6.612.163.450.522.718.2]The performance point of frame with setback at 4th floor level in 1st bay i.e., spectral displacement and spectral acceleration are 0.064m and 0.246g respectively. The maximum spectral displacement (capacity) frame with setback at 4th floor level in 1st bay is 0.44m.
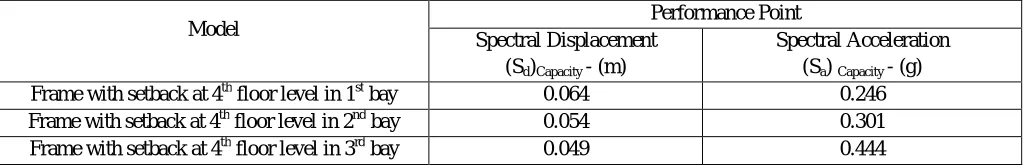
Table 4.4 Performance Points of Frames with setback at 4th floor level in 1st bay, 2nd bay and 3rd bay respectively
Model Performance Point
Spectral Displacement (Sd)Capacity - (m)
Spectral Acceleration (Sa) Capacity - (g)
Frame with setback at 4th floor level in 1st bay 0.064 0.246
Frame with setback at 4th floor level in 2nd bay 0.054 0.301
Frame with setback at 4th floor level in 3rd bay 0.049 0.444
VI. CONCLUSIONS
Seismic vulnerability assessment for regular RC buildings and vertically geometric irregular buildings studied for various setback frames. Demand spectra have been obtained based on the inputs from IS1893 (part 1):2002 code for corresponding soil conditions in high seismic intensity area. From the analysis carried out the following conclusions can be drawn
A. It is observed that when setbacks were introduced at middle storey damage (in terms of maximum displacement) in RC buildings is found to be high when the damage (in terms of maximum displacement) compared with RC buildings with setbacks at other storeys.
B. It can be concluded from the results that base reaction increases as the dead load increases.
C. Maximum base shear is observed in the frames with setbacks at 4th floor level in 1st bay and it is 2371.63 kN
D. Maximum base reaction is observed in the frames with setbacks at 10th floor level in 1st bay and it is 58121.30 kN
E. The maximum displacement in the frames with setbacks at 4th floor level in 1st bay, 2nd bay and 3rd bay are 0.582m, 0.671m, 0.876m respectively.
F. The maximum displacement in the frames with setbacks at 4th floor level in 1st bay, 2nd bay and 3rd bay are 6.59%, 22.8% and 60.44% higher than that of a frame without any setbacks respectively.
G. The maximum displacement in the frames with setbacks at 4th floor level in 1st bay, 2nd bay and 3rd bay are 4.62%, 12.07% and 24.25% higher than the average displacement respectively.
REFERENCES
[1] Applied Technology Council, (1996). “Recommended methodology for seismic evaluation and etrofitting of buildings.” ReportNo.ATC-40, Redwood City, California.
[2] Bureau of Indian Standards. (2000). “Plain and Reinforced Concrete –Code of Practice IS456:2000.,”New Delhi. [3] Bureau of Indian Standards. (2002). “Criteria for Earthquake Resistant Design of Structures IS1893(Part.I):2002”, New Delhi.
[4] Bureau of Indian Standards. (1987). “Code of practice for design loads (other than earthquake) for buildings and structures IS875(Part.3):1987”, New Delhi. [5] Chopra A.K., (2007). “Dynamics of Structures-Theory and Application to Earthquake Engineering”,Prentice Hall, New Jersey.
[6] Chopra, A.K. and Goel, R.K. (2002). “A modal pushover analysis procedure to estimate seismic demands for buildings,” Earthquake Engineering and Structural Dynamics,31,561-582.
[7] Haroon Rasheed Tamboli and Umesh.N.Karadi “Seismic Analysis of RC Frame Structure with and without Masonry Infill” Indian Journal Of Natural Sciences, Vol.3 / Issue 14/ October2012.
[8] V. Mani Deep and P. Polu Raju.,(2017) “Pushover Analysis Of Rc Building: Comparative Study On Seismic Zones Of India” [9] M. AltugErberik., (2008). “Fragility-based assessment of typical mid-rise and low-rise buidings in turkey”, Vol 30, 1360-1374.
[10] Mohammad HJinya, V.R.Patel “Analysis Of Frame With And Without Masonry Infill Wall With Different Stiffness With Outer Central Opening” International Journal Of Research In Engineering and Technology.
[11] Rahul P. Rathi, Dr.P.S.Pajgade “Study Of Masonry Infilled R.C.Frame With &Without Opening” International Journal Of Scientific & Engineering Research Volume 3, Issue 6,June-2012.
[12] Mehmet Metin Kose “Parameters affecting the fundamental period of RC buildings with infill walls” Engineering Structures 31 (2009), 93-102.
[13] Sharany Haque, Khan Mahmud Amanat, "Seismic zoneVulnerability of Columns of RC Framed Buildings with Soft Ground Floor" International Journal of Mathematical Models And Methods In Applied Sciences, Issue 3, Volume 2,2008, pp 364-371.
[14] Diptesh Das and C.V.R.Murty “Brick masonry infills in seismic design of RC framed buildings” Part 1- Costimplifications, The Indian Concrete Journal (2004).