2019 International Conference on Information Technology, Electrical and Electronic Engineering (ITEEE 2019) ISBN: 978-1-60595-606-0
Multi-indicators Multi-objective Evolutionary Algorithm with Q-Learning
for Real-world Network Optimization
Tung Truong THANH, Rui WANG
*,
Jia-hua LI and Lian-bo MA
College of Software, Northeastern University, Shenyang, China
*Corresponding author
Keywords: Multi-indicators, Multi-objective evolutionary algorithm, Q-learning.
Abstract. Aiming at the deployment optimization of complex Internet of Things (IoT) systems, we propose a new multi-objective optimization algorithm using multiple indicators with reinforcement learning, called MIEA-RL. In MIEA-RL, a set of evaluation indicators are employed to guide the evolution of population, while a Q-learning method is designed to manage these indicators in an efficient way during the search. To be specific, each candidate indicator is determined by the performance improvement of the population selected by the current indicator. Moreover, the search biases of different indicators can be adaptively balanced according to a Q-learning table. Accordingly, the convergence and diversity can be maintained effectively while the algorithm complexity is not increased. Finally, the MIEA-RL is applied to resolve the real-world IoT optimization instances in the experiment. Results show the proposed algorithm is effective and efficient to handle with these problems.
Introduction
With the rapid development of Internet of Things (IoT) in recent years, radio frequency identification (RFID) networks have become more and more prevalent in many practical applications [1-9]. In fact, this technology exhibits a powerful performance to detect and identify a large number of tags in the workspace with a full coverage via optimally deploying a certain number of readers. For this technology, the key issue is how to determine the optimal parameter configuration of these readers in order to obtain the expected performance. Generally, this problem is referred to as the RFID networks planning (RNP) problem [10]. However, due to the complexity of large-scale RFID network, RNP is still very challenging to be tackled because that: 1) the large number of readers and tags in real-world RFID systems leads to a high-dimensional optimization problem, which essentially increases the computation complexity, and 2) there are different optimization objectives to be tackled together properly, which usually conflict each other. It has been turned out that that the RNP problem is an NP-hard problem involving multi-objectives, mixed control variables and constrains [8, 10].
problems. In this paper, we develop an efficient multi-objective algorithm for the complex RNP optimization.
In multi-objective optimizations, a final solution set is usually evaluated according to a variety of indicators. Different indicators can access different aspects of the obtained solutions, e.g., the diversity and convergence. This motivates us to use multiple indicators-in an efficient way to cope with the complex multi-objective optimization problems. [18-22]. Note that, a single indicator often misguides the search toward a certain subregion of Pareto solutions and then the search is stagnated. This means that, the algorithm based on a single indicator usually tends to obtain a set of local-optimal solutions rather than the global-optimal solutions. Some indicators favor the convergence more than the diversity, e.g., the binary additive ɛ-indicator [19], and the additive approximation Sαindicator [23]. Some other indicators, e.g., the crowding distance [24], and the shift-based density estimation indicator [25], prefer the diverse solutions. There are some special indicators, e.g., maximin fitness [26] and the penalty-based boundary intersection [27], which are able to obtain the optimal solution better under some special Pareto optimal surface [28-35]. In principle, there is a greater probability for different biases of multiple indicators to complement each other. Therefore, it is unwise to use a single indicator rather than multiple indicators for the environmental selection.
Based on the above analysis, we propose a novel multi-indicator based evolutionary algorithm with reinforcement learning (MIEA-RL) for the RFID network optimization, which can achieve a better performance on the multi-objective RNP model. The main idea is to carry out an improved environmental selection using multiple indicators that are complementary with each other. In order to reduce the bias of the selected indicator, we use the Q-learning method to dynamically select an optimal indicator in the environment selection. By the above mechanisms, MIEA-RL can obtain a set of representative Pareto optimal solutions with a good convergence and an uniform distribution.
The remainder of this paper is organized as follows. Section II presents the multi-objective RNP problem. In Section III, the details of the MIEA-RL are presented and then give corresponding experimental studies. Section IV illustrates instantiation of MIEA-RL on a RNP and analysis of experimental results. Finally, Section V concludes this paper and indicates some future directions.
Multi-objective RNP Model
In real-world RFID network planning, many factors such as economic efficiency, tag coverage and load balance need to be considered. Based on the above factors, the multi-objective RNP model can be presented as below [1,2].
Tag coverage (f1): To achieve optimum tag coverage, the received power PRt of any tag t from reader r should exceed its threshold PT to ensure a communication connection from reader to tag. Besides, the backscatter signal PBt received by reader r should also surpass the threshold Pr of the reader r to establish the available tag-to-reader communication. Accordingly, the function of tag coverage is formulated as
1
( ) max
1, ,
( ) 0,
t T t R
t TS
C t f
NT
if r RS PR P PB P
C t
otherelse
(1) where TS is the set of tags located in the workspace, NT is the number of the tags and RS is the set of readers deployed.
Economic Efficiency (f2): Based on the consideration of multi-path propagation loss, channel
2 min dis(L , BL )r r r RS
f
(2) where dis() is the distance function, Lr and BLr are respectively the position of reader r and its best served reader namely the corresponding tag center. K-means clustering algorithm is adopted to find the tag cluster in this paper.
Load Balance (f3): Reader evenly distributed networks generally have better performance than unevenly configured networks, especially in the large-scale RFID deployment scenario. For minimizing the variance of load conditions, the objective function is formulated as
max 3 min
r r RS r
D f
D
(3) where Dr is the number of tags that is assigned to reader r and Drmax is the maximum number of tags that is interrogated by the reader r per unit of time.
Objective Constraint: In addition to optimize the above three objective functions, the model should also guarantee the full coverage of tags. In other words, each tag located in working region can be covered by at least one reader. This constraint is formulated as:
. . PR , ,
1
t T r R
t r r RS
s t P PB P t TS r RS D t TS
(4) where Drt is a binary value, which denotes the number of available readers. If the reader cover the tag t, that is Drt =1, otherwise Drt =0. Therefore, this objective constraint not only keeps the network efficient, but also ensures that the reader fully covers the tags.
Algorithm.1Main Loop of MIEA-RL Input: population size N
Output: approximation set A
1. Initiate the population P0 randomly
2. Evaluate all individuals in P
3. Set the offspring population Q0=Ø ,t=0
4. Initiate the Q-table Tindicators=0
5. Select an initial indicator Icurrent at random
6. while t< MaxGen do 7. Qt=Mating_selection (Pt)
8. Qt=Variation(Qt)
9. /* Environmental selection based Q-learning */ 10. [Pt+1, Tindicators , Icurrent]=QPES(Pt,Qt, Tindicators , Icurrent)
11. t=t+1 12.end while
13.A = Non-dominated-sort(Pt+1)
14.Return A
Multi-objective Evolutionary Algorithm with Reinforcement Learning
Overview
initial populations. Random parent individuals are selected to generate offspring in each generation. The offspring population is aggregated with the parent population after fitness evaluation. And then, Q-learning selects an optimal indicator to evaluate each individual. During the environmental selection, N good individuals are selected as new parents based on selected indicator. When the optimization is termination, the nondominated solutions in the final population are used as the final output.
Indicators
Generally, the proposed framework can accommodate any reasonable indicators. However, We expect these indicators to compensate each other for better performance,intuitively they should have different biases. Hence, the indicators Iɛ+ [19], IMaximin [26] and ISDE [25] are chosen for MIEA-RL.
These indicators are chosen mainly for the following reasons: 1) these indicators have been proved to be effective in terms of convergence or diversity in many related works [19-21] and 2) since there is no need to set appropriate reference set/point, they are very computationally efficient.
Suppose that there are two solutions x and y, the quality indicator Iε+is formulated as
(x, y) min { (x) -i i(y) {1,..., }} I f f for i m
(5) where m is the number of objectives. According to the formula, it can be deduced that Iε+ shows the minimum shift weight of each dimension of the objectives. Then it is used to compose indicator I1for comparing solutions as
(y,x)/ 0.05 1
\{x}
( )= I
y P
I x e
(6) where P is the population that includes x and y. Distinctly, I1(x) can be directly employed as the dominance relation.
The quality indicator Imaximin proposed by Balling [22] is defined as:
max min(x) max , (min ( ))
x y i y x y P i i i
I f f
(7) Some interesting properties are found from eq. (7): 1) the dominant individual is the one whose maximum indicator is greater than zero, and 2) Individuals whose maximum indicator is less than zero are non-dominant individuals.In addition, for non-dominant individuals, clustering leads to the increase of indicator.The corresponding I2 for comparing solutions are defined as
2
(x)
max
,y ND(min (
))
x y
y x i i i
I
f
f
(8) where ND is the non-dominated individuals. By constraining y to be a non-dominant individual,the indicator of a non-dominated individual is controlled only by non-dominated individuals.
The indicator ISDEand the corresponding I3 for selecting better individual are defined as
2
( , ) ( ( ), ( ))
(y) (x) if (x) (x) ( ( ), ( ))
0 otherwise
SDE i i
i i i i
i i
I x y di f x f y
f f f f
di f x f y
(9)
3( ) miny P{ SDE( , )}
I x I x y
Intuitively, ISDE reflects the distribution information of individuals. In addition, it is obvious that
individuals with poorly-converged will also get a high density value. Thus, I3 reflects both the
distribution and convergence information of individuals.
Q-learning ProcedureBased Environmental Selection
Based on the above indicator, the environmental selection need to select N individuals from 2N individuals. Intuitively, the proposed environmental selection can be divided into two steps. The first step is to select the optimal N individuals according to the indicators of 2N individuals, namely the environment selection. And then the Q-table is updated based on the performance variation of population. Detailed procedure is given in Algorithm 2.
Algorithm.2. QLES(environmental selection based Q-learning)
Input: Population Pt, Offspring Qt, Q-table Tindicators , Indicator in the current state Icurrent
Output: Next population Pt+1, Updated Q-table Tindicators , Updated indicator in the current state Icurrent
1. Select the best action indicator Iact for the current state indicator Icurrent according to Q-table
2. Calculate fitness values Inew of individuals in Pt
3. Based on indicator Inew , better N individuals make up new population Pt+1
4. Get a reward r = HV(Pt+1) - HV(Pt)
5. Update the data item (Icurrent , Iact) in the Q-table Tindicators
6. Update the current state Icurrent = Iact
In the environmental selection process, the proposed mechanism is similar to the classical selection process. That is, all the individuals are sorted by their fitness values and then the better N ones are selected.
In order to select appropriate indicator at each iteration, the Q-learning is adopt in the environmental selection. Specifically, Q-learning selects an optimal indicator according to the current iteration states. First of all, The selection indicator operating space is abstracted as a 3ⅹ3 matrix namely Q-table, as showed in Table 1. Then, the indicator that is used to evaluate the individuals in each iteration is selected according to the Q-table. For example, suppose the current population is assessed based on indicator I3, the optimal indicator that can achieve best performance in next iteration is performed as I1 based on potential reward-maximization. Finally, the population gets a feedback based on the performance variation of population. In this paper, the hypervolume indicator (HV) is used to measure this performance variation. Then the corresponding reward function as following:
1
(P )t (P )t
rHV HV
(11) where Pt+1 is the population after environmental selection and Pt is the population before environmental selection.
The corresponding data item in the Q-table is updated as
1
, , [ , ]
, max ( , ) - ,
( ) 1 (0.9* )
max
state act state act state act
state act I state state act
Q I I Q I I Q I I
Q I I r Q I I Q I I
iter t
Cycle
( ) ( ) ( )
( ) ( )
Table 1. A specific example of the Q-table. next action
current state I1 I2 I3
I1 -0.2 -0.5 0
I2 0 0.9 0.5
I3 0.5 0 -0.3
Computational Complexity Analysis
Supposed an RNP problem with three objective functions and a population size of N, the time complexity of T generation of MIEA-RL is as follows: O(N) is used to generate a new population. Next, the time complexity of evaluating the fitness of the population and merging population need
O(mN) and O(N) respectively. And finally, Q-learning procedure based environmental selection consumes O(mN2), in which the environment selection and update Q table consume O(mN2) and O(N2) respectively.In short, the computational complexity of MIEA-RL is O(TmN2). Compared with other popular algorithms[15,19,25,36-40], this performance is very competitive.
RNP Simulation Experiment Setup
As is known to all, the task of RFID network planning is to deploy RFID readers in the working area to satisfy network requirements. A simulation experiment containing 100 clustered distributed tags and 10 RFID readers that Comply with EPC Class1 Gen 2 standards is implemented in the 30 m ⅹ 30 m working space, where the following three decision variables are chosen in this work: the x-axis coordinate value of the RFID reader, the y-axis coordinate value of the RFID reader and the read range of the RFID reader. The related parameters in the simulation RFID network are set as in [15]. The solution's representation makes up of these variables. On that basis, each solution that represents a RFID network structure consists of a 30-dimensional vector in which 20 dimensions indicate the coordinates of the readers in the 2-dimensional working area, and the other 10 dimensions denote the interrogation range of each reader.
The proposed algorithm is applied to solve this RNP instance with multi-objective model. In order to verify the performance of the proposed algorithm, the state-of-the-art multi-objective evolutionary algorithms NSGAII[24], NSGAIII[45] and MOEAD[27] are considered. The population size of MIEA-RL and NSGAII is set to 100. The population size of NSGAIII and MOEAD is set to 91 and the number of weight vectors is the same. The crossover and mutation probabilities are fixed at 0.9 and 1/n, respectively, where n is the number of decision variables. The distribution indexes of SBX and polynomial mutation operators are both set to 20. To obtain statistically reliable results, the number of fitness evaluation is set to 100,000 and the independent run times are set to 30.
Computation Results and Analysis
0 0.1
0.2 0.3
0.4 0.5 0 1
2 3
x 10-3 0
0.1 0.2 0.3 0.4 0.5
economic efficiency tag coverage
lo
ad
b
al
an
ce
NSGAII MIEA-RL NSGAIII MOEA/D
[image:6.595.180.417.631.772.2]X-coodinate
Y
-c
o
o
d
in
a
te
0 5 10 15 20 25 30 0
5 10 15 20 25 30
[image:7.595.185.400.77.245.2]-30 -20 -10 0 10 20 30 40
Figure 2. Reader distribution and radiated power contour obtained by MIEA-RL.
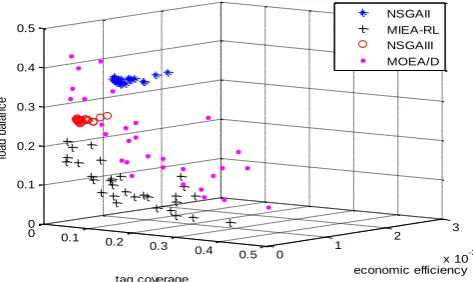
Three competing objectives in section II are optimized simultaneously by the above four algorithms. According to the RNP instance, all obtained Pareto fronts by the different algorithms are shown in Fig.1. It clearly illustrates the relationships among all presented objective functions. According to the simulation data, without degrading the other related optimized objectives, it is impossible that each MORNP objective is further improved. Obviously, the tradeoffs given by MIEA-RL generally dominate the tradeoffs given by the other three algorithms. Furthermore, Table 2 shows the all compromise Pareto-optimal solutions in the three-dimensional Pareto front by MIEA-RL. Due to the limited layout, the Pareto-optimal solutions of other algorithms are not given.
[image:7.595.50.548.520.674.2]A sample from Pareto-optimal solutions is selected to further analyze the algorithm performance in Fig.2. A contour represents the same radiated power. It is shown in Fig. 2 that the power peaks in the working area are the positions where the readers are deployed. and, the signal strength decreases with distance from the reader. Observing Fig.2, we can draw conclusions: 1) MIEA-RL tries to generate an optimal reader network layout with high tag coverage rate; 2) a satisfactory economic efficiency by increasing the best-server areas is maintained by MIEA-RL; 3) according to the capacity of readers, the algorithm uses a load balancing strategy to configure the network so that each reader in the network has an optimal number of tags.
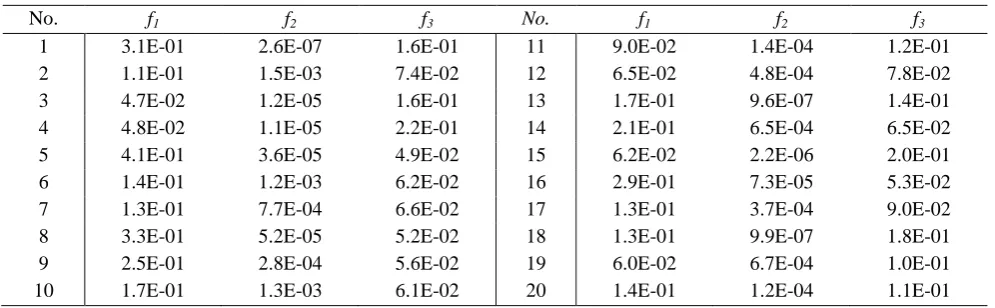
Table 2. Pareto optimal solutions for RFID network planning by MIEA-RL.
No. f1 f2 f3 No. f1 f2 f3
1 3.1E-01 2.6E-07 1.6E-01 11 9.0E-02 1.4E-04 1.2E-01
2 1.1E-01 1.5E-03 7.4E-02 12 6.5E-02 4.8E-04 7.8E-02
3 4.7E-02 1.2E-05 1.6E-01 13 1.7E-01 9.6E-07 1.4E-01
4 4.8E-02 1.1E-05 2.2E-01 14 2.1E-01 6.5E-04 6.5E-02
5 4.1E-01 3.6E-05 4.9E-02 15 6.2E-02 2.2E-06 2.0E-01
6 1.4E-01 1.2E-03 6.2E-02 16 2.9E-01 7.3E-05 5.3E-02
7 1.3E-01 7.7E-04 6.6E-02 17 1.3E-01 3.7E-04 9.0E-02
8 3.3E-01 5.2E-05 5.2E-02 18 1.3E-01 9.9E-07 1.8E-01
9 2.5E-01 2.8E-04 5.6E-02 19 6.0E-02 6.7E-04 1.0E-01
10 1.7E-01 1.3E-03 6.1E-02 20 1.4E-01 1.2E-04 1.1E-01
Summary
algorithm does not increase the computation complexity and it retains a good balance between performance and efficiency.
Since our new RNP model takes advantage of multi-objective algorithms to find all the Pareto optimal solutions and to accomplish the optimal planning solutions by simultaneously optimizing three conflicting objectives, this work is more novel than previous approaches to RFID network planning. To verify its validity, MIEA-RL is employed to solve a RFID network planning problem and gave the better performance. For future research, it is interesting to investigate the performance of MIEA-RL on the larger-scale RNP environments and the application of parallel or distributed techniques to improve MIEA-RL.
Acknowledgement
This work is supported by the National Natural Science Foundation of China under Grant No. 61773103 and 61503373; and Fundamental Research Funds for the Central Universities No. N161705001.
References
[1]Ding K, Jiang P, Su S. RFID-enabled social manufacturing system for inter-enterprise monitoring and dispatching of integrated production and transportation tasks[J]. Robotics and Computer-Integrated Manufacturing.
[2]Ma L, Wang X, Huang M, et al. Two-Level Master-Slave RFID Networks Planning via Hybrid
Multiobjective Artificial Bee Colony Optimizer[J]. IEEE Transactions on Systems Man & Cybernetics Systems, 2017, PP(99):1-20.
[3]Schapranow, Matthieu P, Müller, et al. Security Aspects in Vulnerable RFID-Aided Supply Chains[C]// European Workshop on Rfid Systems & Technologies. VDE, 2009.
[4]Schapranow M P, Faehnrich C, Zeier A, et al. Simulation of RFID-aided Supply Chains: Case
Study of the Pharmaceutical Supply Chain[C]// Third International Conference on Computational Intelligence. IEEE, 2011.
[5]Yuan J, Wang X, Dong L, et al. ISILON—An intelligent system for indoor localization and navigation based on RFID and ultrasonic techniques[C]//Intelligent Control & Automation. IEEE, 2010.
[6]Xiao F, Wang Z, Ye N, et al. One More Tag Enables Fine-Grained RFID Localization and Tracking[J]. IEEE/ACM Transactions on Networking, 2018, PP(99):1-14.
[7]Wu H, Wu X, Tian G. Indoor robot localization based on single RFID tag[J]. Artificial Life & Robotics, 2018:1-7.
[8]Yorozu T, Hirano M, Oka K, et al. Electron Spectroscopy Studies on Magneto-Optical Media and Plastic Substrate Interface[J]. IEEE Translation Journal on Magnetics in Japan, 1987, 2(8):740-741.
[9]Ma L, Chen H, Hu K, et al. Hierarchical Artificial Bee Colony Algorithm for RFID Network Planning Optimization[J]. The Scientific World Journal,2014,(2014-1-23), 2014, 2014(1):941532.
[10]Szczurkowski M, Jankowski H, Worek C, et al. RFID reader design for identification of industrial metallic objects[C]//Spie. 2006.
[12]Gong X, Plets D, Tanghe E, et al. An efficient genetic algorithm for large-scale transmit power control of dense and robust wireless networks in harsh industrial environments[J]. Applied Soft Computing, 2018, 65(C):243-259.
[13]Ma L B, Wang X W, Huang M, et al. A novel evolutionary root system growth algorithm for
solving multi-objective optimization problems[J]. Applied Soft Computing, 2017, 57:379-398.
[14]Bacanin N, Tuba M, Strumberger I. RFID Network Planning by ABC Algorithm Hybridized with Heuristic for Initial Number and Locations of Readers[C]// Uksim-amss International Conference on Modelling & Simulation. IEEE, 2016.
[15]Ma L, Hu K, Zhu Y, et al. Cooperative artificial bee colony algorithm for multi-objective RFID network planning[J]. Journal of Network & Computer Applications, 2014, 42:143-162.
[16]Ma L, Zhu Y, Zhang D, et al. A hybrid approach to artificial bee colony algorithm[J]. Neural Computing and Applications, 2016, 27(2):387-409.
[17]Y. Liu, L. Ma, G. Yang, A Survey of Artificial Bee Colony Algorithm,2017 IEEE 7th Annual
International Conference on CYBER Technology in Automation, Control, and Intelligent Systems (CYBER), 2017 :1510-1515
[18]Bader J, Zitzler E. HypE: An Algorithm for Fast Hypervolume-Based Many-Objective
Optimization[J]. Evolutionary Computation, 2011, 19(1):45-76.
[19]Zitzler E, Simon Künzli. Indicator-based selection in multiobjective search[J]. Lecture Notes in Computer Science, 2004, 3242:832-842.
[20]Ma L, Li X, Gao T, et al. Indicator-Based Multi-objective Bacterial Foraging Algorithm with Adaptive Searching Mechanism[C]//Bio-inspired Computing-theories & Applications. Springer, Singapore, 2016.
[21]Chen S, Wang R, Ma L, et al. A Novel Many-Objective Bacterial Foraging Optimizer Based on
Multi-engine Cooperation Framework[C]//International Conference on Swarm Intelligence. Springer, Cham, 2018.
[22]Wang R, Chen S, Ma L, et al. Multi-indicator Bacterial Foraging Algorithm with Kriging Model for Many-Objective Optimization[C]//International Conference on Swarm Intelligence. Springer, Cham, 2018.
[23]Bringmann K, Friedrich T, Neumann F, et al. Approximation-guided evolutionary
multi-objective optimization[C]// International Joint Conference on Artificial Intelligence. AAAI Press, 2011.
[24]Deb, Kalyanmoy, Pratap, Amrit, Agarwal, Sameer, et al. A fast and elitist multiobjective genetic algorithm: NSGA-II[J]. IEEE Transactions on Evolutionary Computation, 2002, 6(2):182-197.
[25]Li M, Yang S, Liu X. Shift-based density estimation for Pareto-based algorithms in many-objective optimization[J]. IEEE Transactions on Evolutionary Computation, 2014, 18(3):348-365.
[26]Menchaca-Mendez A, Coello Coello C A. MD-MOEA: A new MOEA based on the maximin
fitness function and Euclidean distances between solutions[C]// Evolutionary Computation. IEEE, 2014.
[27]Zhang Q, Li H. MOEA/D: A Multiobjective Evolutionary Algorithm Based on
[28]Menchacamendez A, Coello Coello C A. MH-MOEA: A new multi-objective evolutionary algorithm based on the maximin fitness function and the hypervolume indicator.[C]// International Conference on Parallel Problem Solving from Nature. Springer International Publishing, 2014.
[29]Ma L, Hu K, Zhu Y, et al. A hybrid artificial bee colony optimizer by combining with life-cycle, Powell’s search and crossover[J]. Applied Mathematics & Computation, 2015, 252:133-154.
[30]Ma L B, Zhu Y L, Liu Y, et al. A novel bionic algorithm inspired by plant root foraging behaviors[J]. Applied Soft Computing, 2015, 37(C):95-113.
[31]Ali S, Wilcock R, Wilson P, et al. Yield Model Characterization For Analog Integrated Circuit Using Pareto-Optimal Surface[C]//IEEE International Conference on Electronics. IEEE, 2008.
[32]Ma L, Chen H, Li X, et al. Root system growth biomimicry for global optimization models and emergent behaviors[J]. Soft Computing, 2016, 21(24):1-18.
[33]Chen H, Ma L, He M, et al. Artificial Bee Colony Optimizer Based on Bee Life-Cycle for Stationary and Dynamic Optimization[J]. IEEE Transactions on Systems Man & Cybernetics Systems, 2017, 47(2):327-346.
[34]Ma L, Wang X, Yu R, et al. Biomimicry of plant root growth using bioinspired foraging model for data clustering[J]. Neural Computing & Applications, 2018, 29(3):819-836.
[35]Bhat N, Barrans S, Kumar A S. Performance analysis of Pareto optimal bearings subject to surface error variations[J]. Tribology International, 2010, 43(11):2240-2249.
[36]Ma L, Wang X, Shen H, Huang M. A Novel Artificial Bee Colony Optimizer with Dynamic Population Size for Multi-level Threshold Image Segmentation, International Journal of Bio-Inspired Computation, 2016.cations, 2016:1-18.
[37]Yuan Y, Ong Y S, Gupta A, et al. Objective Reduction in Many-Objective Optimization: Evolutionary Multiobjective Approaches and Comprehensive Analysis[J]. IEEE Transactions on Evolutionary Computation, 2018, 22(2):189-210.
[38]Ma L, Zhu Y, Hu K. A Novel Plant Root Foraging Algorithm for Image Segmentation Problems,
Mathematical Problems in Engineering, Volume 2014, Article ID 471209, 16 pages.
[39]Liu C, Zhao Q, Yan B, et al. Adaptive Sorting-based Evolutionary Algorithm for
Many-Objective Optimization[J]. IEEE Transactions on Evolutionary Computation, 2018, PP(99):1-1.
[40]Ma L, Hu K, Zhu Y, Niu B, Chen H. Discrete and Continuous Optimization Based on Hierarchical Artificial Bee Colony Optimizer, Journal of applied mathematics,Vol.2014,Article ID 402616,2014.
[41]Chugh T, Jin Y, Miettinen K, et al. A Surrogate-Assisted Reference Vector Guided Evolutionary Algorithm for Computationally Expensive Many-Objective Optimization[J]. IEEE Transactions on Evolutionary Computation, 2018, 22(1):129-142.
[42]Ma L, Hu K, Zhu Y, Chen H. Computational evolution of social behavior in bacterial colony
optimization model. Journal of pure and applied microbiology, 2013, 7: 487-493.
[43]Jiang H, Dong W, Ma L,Bacterial Foraging Algorithm Based on Reinforcement Learning for Continuous Optimizations,International Symposium on Intelligence Computation and Applications, 2017, 41-52.
[44]Jain H, Deb K. An Evolutionary Many-Objective Optimization Algorithm Using