e-ISSN: 2278-7461, p-ISSN: 2319-6491
Volume 7, Issue 3 [March 2018] PP: 01-11
Predictive Models to Evaluate Plug Flow Infiltration of Nitrobacter
Transport in Saline Environment
Udeh, N.U
1, Eluozo, S.N
2 1Department of Civil and Environmental Engineering University of Port Harcourt
2Subaka Nigeria Limited, Port Harcourt, Rivers State of Nigeria
Corresponding Author: Udeh, N.U
Abstract: The depositions of Nitrobacter have been the subject of concern in soil and water environment. Regeneration of Nitrobacter contributes in the deterioration of the water quality in coastal environment. The study was assessed to monitor the rate of Nitrobacter transport to phreatic zones in a saline environment. The investigation showed that the ground water aquiferous zone develop heterogeneous setting which deposits shallow and deep Phreatic beds. The study expressed was predominantly influenced by saline and other mineral deposits in the formation, but with slight influences from alluvium depositions. This implies that the formation characteristic has more effect on the rate of Nitrobacter concentration in some stratum. Fluctuations in various locations were observed through the effect from the structural setting of the formation and exponential phase of transport were observed to be predominant. The system developed governing equations that were derived to generate the expressed model that predicted the behaviour of Nitrobacter in the formation. The models were simulated to produce theoretical values which were compared with other measured values. Both parameters developed favourable fits validating the model. The measured concentration of the Nitrobacter increased to the optimum value of 7.96E-02 (mg/l) within 100days and 0.073E-03 (mg/l) at 30m depth
Keywords: Evaluate, Nitrobacter, Plug flow phase, Saline environment and transport
--- ---Date of Submission 22-03-2018 ---Date of acceptance: 05-04-2018 --- ---
I.
INTRODUCTIONThe effectiveness of microbes to be converted as absorbed soil carbon into microbial biomass has been called the microbial growth efficiency (Y), carbon-use efficiency, or substrate-use effectiveness. This physiological features of the microbial biomass powerfully pressure overall soil unrefined carbon (SOC). Moreso, the mineral budgets such as carbon sequestration are found in the soil environment [1], [2], [3]. Since nutrient ratios in microbial biomass differ over comparatively narrow ranges, Y also contributes to regulation of nitrogen and other nutrients. Mineralization and immobilization in soils express measurements of microbial growth efficiency in soil span surprisingly over a wide range, from 0.14 to 0.77 [4], [5], [6]. Despite the high variability of this integrative trait and its importance in influencing organic matter turnover including nutrient availability, we have limited understanding of how environmental variables influence growth efficiency [3], [5]. The size and structure of the soil microbial population plays a role in the primary making of plant carbon (C) portion, rhizosphere activity, and litter substrate superiority [7], [8], [9], [10] and it is also controlled through complex communications with plants [11], [12] [13]. Changes in atmospheric CO2 concentration and nitrogen (N) deposition rates alter both the quality and quantity of plant carbon and underground plant litter inputs to soil [2], [8], [13]. This in turn can affect underground microbial society arrangement and function [4], [14], [15] considering that the mechanisms controlling underground carbon processes is useful in predicting future changes in soil carbon stores in response to climate and land-use change [16]. Altering root and coarse woody debris (CWD) inputs to soil is one method to examine the feedbacks between plants, microbes, and soil organic matter (SOM) dynamics [15], [10], [17], [18].
II.
MATERIALS AND METHODSColumn experiments were performed using soil samples from several borehole locations. The soil samples were collected at intervals of 3m. A Nitrobacter solute was introduced at the top of the column and effluents from the lower end of the column were collected and analyzed for Nitrobacter. These effluents were collected at different days. This experiment were performed to compare with the theoretical values for model validation
1.1 Governing Equations
Z
c
U
Z
c
D
t
c
K
2 2 (1) Where;C = Enterococci concentration [ML-3]
= Saline concentration [ML-3] K = Permeability [LT-1] U = Velocity [LT-1] T = Time [T] Z = Depth [L]
Let
C
T
,
Z
1 1
11
Z
DTZ
U
TZ
KT
(2)Z
Z
U
Z
Z
D
T
T
K
1 1 11
(3) 2 11
T
T
K
(4)2 1
Z
Z
D
(5) 2 1
Z
Z
U
(6)
21
Z
Z
U
D
(7) 2
dt
dc
K
(8) 2 2 2
dt
dc
K
(9) 2
dZ
dc
D
(10) 2
dZ
dc
U
(11)dZ
K
Z
d
2 2
(12)dZ
K
d
2
2(13) 1 2
C
Z
K
dZ
(14)
Z
dZ
C
dZ
K
dZ
1 2
(15) 2 1 2 22
C
C
Z
K
Z
(16)2 1 2 2
2
2
C
C
Z
K
(18)
0
2
1 22 2
2
Z
C
C
K
(19)
Therefore, the auxiliary equation is shown in Equation 20:
0
2
2 22
2
C
M
C
M
K
(20)
Applying quadratic expression, we have
a
ac
b
b
M
2
4
2 12
(21)
K C K C C M 2 2 2 2 1 2 2 4 (22) K K C C C M 2 2 2 2 1 1 2 2 (23) K K C C C M 2 2 2 2 1 2 2 2 (24)
Assuming this discriminate is complex, therefore equation (23) and (24) can be written as:
T
Z
F
Cos
M
t
F
Sin
M
Z
C
,
1
1
2
2 (25)But if
v
d
t
andZ
v
t
The expressed model can be written as:
F
Sin
M
V
t
v
d
M
Cos
F
Z
T
C
,
1
1
2
2
(26)III.
RESULTSThe results of Nitrobacter concentrations at different depth and time are presented in Tables 1 to 8.
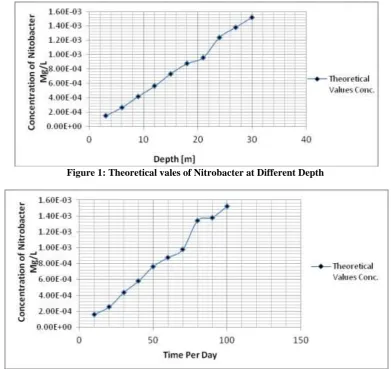
Table 1: Theoretical vales of Nitrobacter at Different Depth
Depth [m] Theoretical Values Conc. [Mg/L]
3 1.52E-04
6 2.65E-04
9 4.18E-04
12 5.61E-04
15 7.34E-04
18 8.76E-04
21 9.59E-04
24 1.24E-03
27 1.38E-03
30 1.52E-03
Table 2: Theoretical vales of Nitrobacter at Different Time
Time per day Theoretical Values Conc. [Mg/L]
10 1.62E-04
20 2.55E-04
30 4.38E-04
40 5.81E-04
50 7.64E-04
60 8.76E-04
70 9.79E-04
2 1 2 2 2
C
C
Z
K
80 1.34E-03
90 1.38E-03
100 1.52E-03
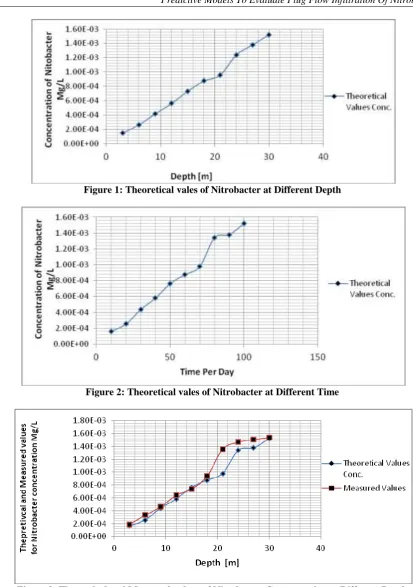
Table 3: Theoretical and Measured values of Nitrobacter Concentration at Different depth
Depth [m]
Theoretical Values Conc.
[Mg/L] Measured Values[Mg/L]
3 1.62E-04 1.89E-04
6 2.55E-04 3.32E-04
9 4.38E-04 4.62E-04
12 5.81E-04 6.42E-04
15 7.64E-04 7.41E-04
18 8.76E-04 9.42E-04
21 9.79E-04 1.36E-03
24 1.34E-03 1.47E-03
27 1.38E-03 1.51E-03
30 1.52E-03 1.54E-03
Table 4: Theoretical and Measured values of Nitrobacter Concentration at Different Time
Time per day Theoretical Values Conc. [Mg/L] Measured Values[Mg/L] 10 Theoretical Values Conc. 1.32E-04
20 1.62E-04 2.42E-04
30 2.55E-04 3.52E-04
40 4.38E-04 4.62E-04
50 5.81E-04 5.32E-04
60 7.64E-04 6.37E-04
70 8.76E-04 7.35E-04
80 9.79E-04 8.18E-04
90 1.34E-03 9.27E-04
100 1.38E-03 1.22E-03
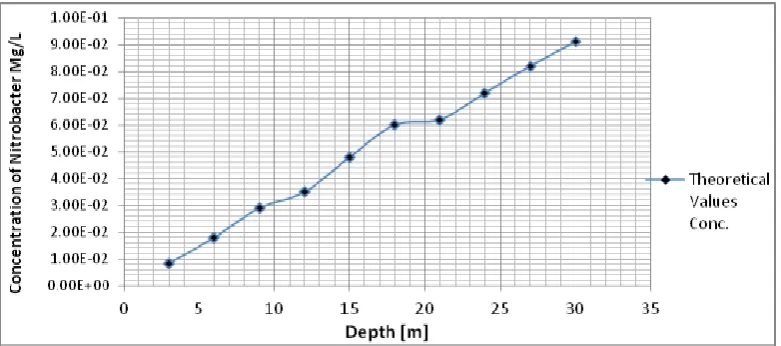
Table 5: Theoretical vales of Nitrobacter at Different Depth
Depth [m] Theoretical Values Conc. [Mg/L]
3 8.39E-03
6 0.018
9 0.029
12 0.035
15 0.048
18 0.06
21 0.062
24 0.072
27 0.082
30 0.091
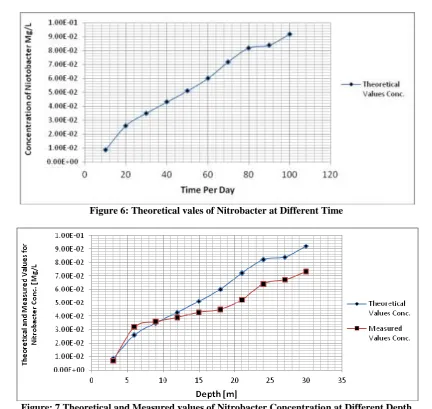
Table 6: Theoretical vales of Nitrobacter at Different Time
Time per day Theoretical Values Conc. [Mg/L]
10 8.59E-03
20 0.026
30 0.035
40 0.043
50 0.051
60 0.06
70 0.072
80 0.082
90 0.084
100 0.092
Table 7: Theoretical and Measured values of Nitrobacter Concentration at Different depth
Depth [m]
Theoretical Values Conc.
[Mg/L] Measured Values Conc. [Mg/L]
3 8.59E-03 6.73E-03
6 0.026 0.032
9 0.035 0.036
12 0.043 0.039
15 0.051 0.043
18 0.06 0.045
24 0.082 0.064
27 0.084 0.067
30 0.092 0.073
Table 8: Theoretical and Measured values of Nitrobacter Concentration at Different Time
Time per day
Theoretical Values Conc. [Mg/L]
Measured Values Conc. [Mg/L]
10 8.34E-03 7.93E-03
20 0.026 1.86E-02
30 0.029 2.45E-02
40 0.037 3.22E-02
50 0.047 3.88E-02
60 0.055 5.45E-02
70 0.064 5.74E-02
80 0.073 6.73E-02
90 0.088 7.46E-02
100 0.097 7.96E-02
The graphical representation of Nitrobacter concentration at different depth and time are shown in Figures 1 to 8.
Figure 1: Theoretical vales of Nitrobacter at Different Depth
Figure 3: Theoretical and Measured values of Nitrobacter Concentration at Different Depth
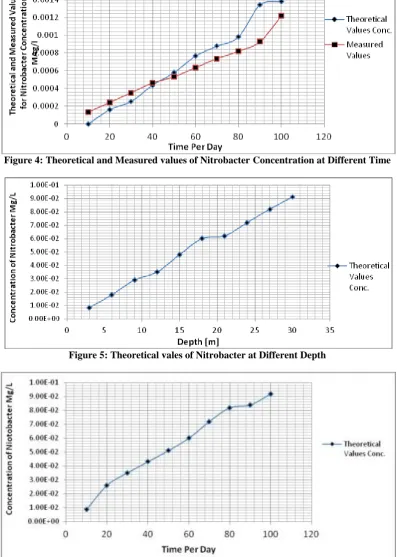
Figure 4: Theoretical and Measured values of Nitrobacter Concentration at Different Time
Figure 6: Theoretical vales of Nitrobacter at Different Time
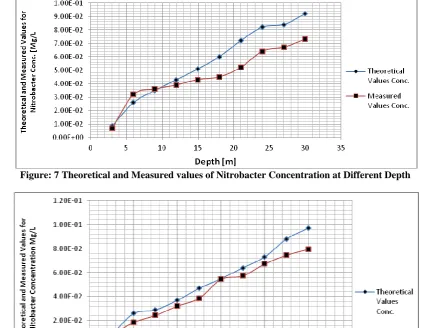
Figure: 7 Theoretical and Measured values of Nitrobacter Concentration at Different Depth
Figure: 8 Theoretical and Measured values of Nitrobacter Concentration at Different Time
Figure 1: Theoretical vales of Nitrobacter at Different Depth
Figure 2: Theoretical vales of Nitrobacter at Different Time
Figure 4: Theoretical and Measured values of Nitrobacter Concentration at Different Time
Figure 5: Theoretical vales of Nitrobacter at Different Depth
Figure: 7 Theoretical and Measured values of Nitrobacter Concentration at Different Depth
Figure: 8 Theoretical and Measured values of Nitrobacter Concentration at Different Time
IV.
DISCUSSIONSV.
CONCLUSIONNitrobacter were found in the study area and their depositions were evaluated to monitor it migration process on such predominant saline environments. The application was through mathematical modeling techniques and the system of this transport at the study area was developed by generating derived governing equation. The derived equation generated model that was simulated to determined the behaviour of Nitrobacter in saline coastal location. The transport of Nitrobacter has been express from the developed model through the simulation values and the results were compared with other measured values. Both parameters developed a favuorable fits validating the developed model. The study in this location was able to express insignificant effect of saline deposition on the migration of the Nitrobacter at coastal environments. However, the study was able to assess the rate of transport and other influences that pressured the behaviour of Nitrobacter in the study location. The result showed that the behaviour of Nitrobacter depends on the deposition of the structural setting of the formation and permeability influences its rate of transport at this study area. These conditions were observed to pressure the concentration process of Nitrobacter in coastal environments. Thus, the study has developed a base line study that will be applied in monitoring and evaluation of Nitrobacter deposition including its behaviour in costal environments. There is no doubt that the processes were imperative to confirm it rates of concentration because of the health implication this pollutant has cause to the human settlers in the study area. Experts will ensure that these conceptual techniques will be applied proactively to eradicate ground water pollution in the study environment.
REFERENCES
[1]. Patrick, M; Herron, J; Stark, M; Carson, H; Hooker, T. Z; Cardon, G. Microbial growth efficiencies across a soil moisture gradient assessed using 13C-acetic acid vapor and 15N-mmonia. Soil Biology & Biochemistry, 2009, 41 pp. 1262–1269.
[2]. Justin, B; Brant, E; Sulzman, W; David, D. Myrold microbial community utilization of added carbon substrates in response to long-term carbon input manipulation. Soil Biology & Biochemistry, 2006, 38 pp. 2219–2232.
[3]. Six, J; Frey, S.D; Thiet, R.K; Batten, K.M. Bacterial and fungal contributions to C-sequestration in agro ecosystems. Soil Sci. Society of America Journal, 2006, 70 pp. 555–569.
[4]. Schimel, D.S. Calculation of microbial growth efficiency from 15N immobilization. Biogeochemistry, 1988, 6 pp. 239–243. [5]. Thiet, R.K; Frey, S.D; Six, J. Do growth yield efficiencies differ between soil microbial communities inferring in fungal bacterial
ratios? Reality check and methodological issues. Soil Biology & Biochemistry, 2006, 38 pp. 837– 844.
[6]. Hart, S.C; Stark, J.M; Davidson, E.A; Firestone, M.K. Nitrogen mineralization, immobilization, and nitrification. In: Weaver, R.W., Angle, S., Bottomley, P., Bezdicek, D., Smith, S., Tabatabai, A.,Wollum, A. (Eds.), Methods of soil analysis. Part 2. Microbiological and biochemical properties. Soil Science Society of America, Madison, WI, 1994, pp. 985–1018.
[7]. Frey, S.D; Gupta, V.V.S.R; Elliott, E.T; Paustian, K. Protozoan grazing affects estimates of carbon utilization efficiency of the soil microbial community. Soil Biology & Biochemistry, 2001, 33 pp. 1759–1768.
[8]. Aber, J.D; Magill, A; Boone, R; Melillo, J.M; Steudler, P; Bowden, R. Plant and soil responses to chronic nitrogen additions at the Harvard Forest, Massachusetts. Ecological Applications, 1993, 3 pp. 156–166.
[9]. Myers, R.T; Zak, D.R; White, D.C; Peacock, A. Landscape-level patterns of microbial community composition and substrate use in upland forest ecosystems. Soil Sci. Society of America Journal 2001, 65 pp. 359–367.
[10]. Fisk, M.C; Fahey, T.J. Microbial biomass and nitrogen cycling responses to fertilization and litter removal in young northern hardwood forests. Biogeochemistry, 2001, 53 pp. 201–223.
[11]. Smith, J.L; Paul, E.A. The Significance of soil microbial biomass estimations. In: Bollag, J., Stotzky, G. (Eds), Soil Biochemistry. Mercel Dekker, New York, edn. 1990, 357–393.
[12]. Zak, D.R; Pregitzer, K.S; Curtis, P.S; Holmes, W.E. Atmospheric CO2, composition and function of soil microbial communities.
ecological applications, 2000, 10 pp. 47–59.
[13]. Butler, J.L; Bottomley, P.J; Griffith, S.M; Myrold, D.D. Distribution and turnover of recently fixed photosynthate in ryegrass rhizospheres. Soil Biology & Biochemistry, 2004, 36 pp. 371–382.
[14]. Canadell, J.G; Pitelka, L.F; Ingram, J.S.I. The effects of elevated CO2 on plant-soil carbon belowground: A summary and synthesis.
Plant and Soil, 1996, 187 pp. 391–400.
[15]. Frey, S.D; Knorr, M; Parrent, J.L; Simpson, R.T. Chronic nitrogen enrichment affects the structure and function of the soil microbial community in temperate hardwood and pine forests. Forest Ecology and Management, 2004, 196 pp. 159–171.
[16]. Waldrop, M; Firestone, M.K. Microbial community utilization of recalcitrant and simple carbon compounds: Impact of Oak-Woodland Plant Communities. Oecologia, 2004, 138 pp. 275–284.
[17]. Pendall, E; Bridgham, S; Hanson, P.J; Hungate, B.A; Kicklighter, D.W; Johnson, D.W; Law, B.E; Luo, Y.Q; Megonigal, J.P; Olsrun, M; Ryan, M.G; Wan, S.Q. Below-ground process responses to elevated CO2 and temperature: A discussion of observations,
measurement methods, and models. New Phytologist, 2004, 162 pp. 311–322.
[18]. Sulzman, E.W; Brant, J.B; Bowden, R.D; Lajtha, K. Contribution of aboveground Litter, belowground Litter, and rhizosphere respiration to total soil CO2 efflux in an old growth coniferous forest. Biogeochemistry, 2005, 73 pp. 231–256.
[19]. Nadelhoffer, K.J; Boone, R.D; Bowden, R.D; Canary, J.D; Kaye, J; Micks, P; Ricca, A; Aitkenhead, J.A; Lajtha, K; McDowell, W.H. The DIRT Experiment: Litter and Root Influences on Forest Soil Organic Matter Stocks and Function. In: Foster, D., Aber, J. (Eds.), Forests in Time: The Environmental Consequences of 1000 Years of Change in New England, edn. 2004, Yale University Press, New Haven, pp 300–315.
[20]. Eluozo, S.N. Mathematical model to monitor the deposition of carbon on influence of E.coli transport in soil water environment in Port Harcourt, Rivers State of Nigeria. Inter. J. of Waste Management and Tech. 2013, 1 pp. 31 – 48.
![Table 1: Theoretical vales of Nitrobacter at Different Depth Depth [m] Theoretical Values Conc](https://thumb-us.123doks.com/thumbv2/123dok_us/1366728.1646261/3.595.67.548.24.794/table-theoretical-nitrobacter-different-depth-depth-theoretical-values.webp)
![Table 5: Theoretical vales of Nitrobacter at Different DepthDepth [m] Theoretical Values Conc](https://thumb-us.123doks.com/thumbv2/123dok_us/1366728.1646261/4.595.76.516.149.776/table-theoretical-vales-nitrobacter-different-depthdepth-theoretical-values.webp)