The Use of a Genetic Algorithm for Simultaneous Mapping of Multiple
Interacting Quantitative Trait Loci
O
¨ rjan Carlborg,* Leif Andersson* and Brian Kinghorn
†*Department of Animal Breeding and Genetics, Swedish University of Agricultural Sciences, Uppsala Biomedical Center, S-751 24 Uppsala,
Sweden and†Department of Animal Science, University of New England, Armidale, New South Wales 2351, Australia Manuscript received February 23, 2000
Accepted for publication April 28, 2000
ABSTRACT
Here we describe a general method for improving computational efficiency in simultaneous mapping of multiple interacting quantitative trait loci (QTL). The method uses a genetic algorithm to search for QTL in the genome instead of an exhaustive enumerative (“step-by-step”) search. It can be used together with any method of QTL mapping based on a genomic search, since it only provides a more efficient way to search the genome for QTL. The computational demand decreases by a factor ofⵑ130 when using genetic algorithm-based mapping instead of an exhaustive enumerative search for two QTL in a genome size of 2000 cM using a resolution of 1 cM. The advantage of using a genetic algorithm increases further for larger genomes, higher resolutions, and searches for more QTL. We show that a genetic algorithm-based search has efficiency higher than or equal to a search method conditioned on previously identified QTL for all epistatic models tested and that this efficiency is comparable to that of an exhaustive search for multiple QTL. The genetic algorithm is thus a powerful and computationally tractable alternative to the exhaustive enumerative search for simultaneous mapping of multiple interacting QTL. The use of genetic algorithms for simultaneous mapping of more than two QTL and for determining empirical significance thresholds using permutation tests is also discussed.
R
APID development in molecular genetics has led mapping. Recently, Kao et al. (1999) described amethod for simultaneous mapping of multiple inter-to the development of dense genetic maps, which
acting QTL. Due to computational constraints, the are a powerful tool for studying the molecular basis
search is restricted to regions where there are prior for quantitative genetic variation. Several methods for
indications of QTL. The method is therefore, as imple-mapping quantitative trait loci have been proposed in
mented today, only a quasi-simultaneous QTL mapping the literature. These can be classified into four major
method. groups: least-squares-based methods (e.g., Haley and
In a simultaneous genome-wide search for multiple
Knott1992;MartinezandCurnow1992),
maximum-QTL, methods based on enumerative search methods likelihood-based methods (e.g.,LanderandBotstein
(e.g., stepwise searches at fixed centimorgan intervals 1989), nonparametric methods (e.g., Kruglyak and
throughout the genome) rapidly become
computation-Lander1995), or Bayesian methods (e.g.,Thomasand
ally intractable as the number of QTL in the model
Cortessis1992;HoescheleandVanRanden1993a,b).
increases. Searching for one QTL requires n
evalua-Haley and Knott (1992) and Jansen (1992) have
tions, where n is the number of positions evaluated; indicated how a simultaneous search for multiple
inter-a seinter-arch for multiple QTL requires n!/(k!(n ⫺ k)!)
acting quantitative trait loci (QTL) can be performed
evaluations, where k is the number of fitted QTL. A by a stepwise search of the genome. These methods have
more efficient strategy to search the genome is needed not been used in practice for genome-wide searches for
to decrease the computational demand. Since the sur-QTL due to the high computational demand.Jansen
face of the QTL mapping test statistic contains many (1992, 1993), Jansen and Stam (1994), and Zeng
local maxima, the method must be robust (i.e., not get (1993a,b) have developed methods for mapping
multi-stuck on local extremes). It should at the same time be ple noninteracting QTL. These methods repeatedly
computationally feasible. In this study, we have investi-search the genome for QTL in one dimension. The QTL
gated the properties of a genetic algorithm as a tool identified in previous searches are used as cofactors
for a simultaneous genome-wide search for two interact-in successive searches to improve the power of QTL
ing QTL.
Genetic algorithms are search algorithms, based on the mechanisms of genetics and natural selection, whose
Corresponding author: O¨ . Carlborg, Department of Animal Breeding basic principles were first designed by John Holland and Genetics, Swedish University of Agricultural Sciences, Uppsala
(Holland1975). The central theme during their
con-Biomedical Ctr., Box 597, S-751 24 Uppsala, Sweden.
E-mail: [email protected] tinuing development has been robustness (Goldberg
2004 O¨ . Carlborg, L. Andersson and B. Kinghorn
Figure1.—Outline for the implementation of a genetic algorithm for simultaneous mapping of two interacting QTL.
1989), which make them interesting as a tool for QTL by randomly generating a population, each member of which constitutes a vector of coded parameter values. mapping. We have used a genetic algorithm library
named PGAPack (Levine 1996). This library can be The parameter values in the vectors are linked together called from both C and FORTRAN programs and is like genes in a linkage group. Each vector is named a freely available from http://www-fp.mcs.anl.gov/CCST/ ga-chromosome and each cell in the vector is named a research/reports_pre1998/comp_bio/stalk/pgapack. ga-gene. We have used ga-chromosomes containing four html and works on several computer platforms. ga-genes with real values between 0 and 1. The ga-genes For simplicity, we have investigated the search proper- are coded representatives for the chromosomal posi-ties of a genetic algorithm using a weighted least-squares tions of the two QTL we are fitting (two ga-genes are method to search for two interacting QTL in a cross used to represent the chromosome numbers and two between inbred lines. However, the method is applica- are used to represent the respective locations on these ble for any QTL mapping method, including methods chromosomes).
for outbred crosses and general pedigrees, and for After initiation, the population member that consti-searches in any number of dimensions, that is for any tutes the best solution is sought. This is done by selection number of (interacting) QTL. of good individual ga-chromosomes on the basis of their evaluation values from an objective function (in our case the QTL mapping method). During the evaluation
METHOD
process, the real values of the genes on each ga-chromosome are translated to putative QTL locations.
The principle of a genetic algorithm:The
implemen-The statistical support for QTL at the locations given tation of a genetic algorithm for QTL mapping is
ga-chromo-some becomes associated with an evaluation value, increase robustness, the ga settings were changed to maintain variation in the ga-population until termina-named as its fitness. Ga-chromosomes can then be
se-lected and used further in the algorithm on the basis tion. The mutation frequency was increased from 0.001 to 0.4 (0.4 was chosen, but any value from 0.2 to 0.5 of their fitness. The standard selection operator in PGA
Pack is tournament selection, which operates like a ten- works well) to introduce more new variation and a muta-tion-operator that chooses new ga-gene values in the nis tournament, where the fitnesses of the
ga-chromo-somes are compared in pairs (matches) in several con- whole parameter range was chosen to maximize the new variation generated by mutation. The ga was also set to secutive rounds. The winners of each match (the most
fit ga-chromosomes) advance to the next round. The not allow creation of new ga-chromosomes, that are duplicates of already existing ga-chromosomes. With tournament continues until the desired number of
ga-chromosomes are left. This scheme gives more variance these settings, the ga was reasonably robust, but conver-gence at local extremes was sometimes observed when in solutions as less fit ga-chromosomes can become
se-lected, while the most fit solution is always selected. the data contained several extremes of similar magni-tude. The PGAPack manual indicated that practitioners The selected ga-chromosomes are used to generate
new ga-chromosomes for the next generation by a pro- often prefer to have recombination and mutation as exclusive operators. This means that if recombination cess resembling genetic recombination. The
ga-chromo-somes are paired and the linkage between ga-genes is has occurred during generation of a new ga-chromo-some, mutation is not to occur, and if no recombination broken at one or several places along the
ga-chromo-some. New ga-chromosomes are generated by combin- has occurred, mutation is to be performed with a certain probability for each ga-gene. Implementation of this ing stretches of ga-genes (parameter values) from the
old ga-chromosomes. The standard recombination op- procedure led to a slightly better performance. Splitting of the population into several smaller ga-erator in PGAPack is two-point crossover, which is
de-fined as the process where the linkage is broken at populations has been suggested as a means to increase robustness without excessive increase in computational two locations on the ga-chromosome before exchanging
stretches of ga-genes. The standard probability of a demand. During optimization, each ga-population is in turn allowed to converge at an extreme that is not crossover event occurring during generation of a new
ga-gene is 0.85. A small amount of new variation is also identified by any previous populations. The detected extremes are then compared to identify the global ex-introduced by mutation of the ga-genes, i.e., the value
of the ga-gene is changed from its present value either treme. The use of multiple populations is implemented by repetitive calls of PGAPack in a DO-loop structure. using a mathematical function or assigning it to a new
random value from the range of parameter values. The Three populations of size 50, 10 populations of size 20, and 20 populations of size 10 were compared and the standard mutation frequency, defined as the probability
of applying the mutation operator on a ga-gene, is 0.001. best results were for 10 populations of size 20. With these settings, the ga-based search gave good performance in Propagation of the algorithm through sufficient
genera-tions is expected to lead to convergence to the optimal all our examined populations. In most cases, the ga found the global extreme in⬍5 populations, but occa-solution according to the objective function.
The implementation of the genetic algorithm: The sionally all 10 populations were needed. A decrease in the number of populations should therefore be avoided genetic algorithm was used to find the location in the
genome with the strongest support for a QTL effect and unless the major limitation is computational perfor-mance.
high robustness was our major objective when
imple-menting the ga. The computational performance was Genetic algorithms are good at finding regions where the extremes are located but can have difficulty finding compared to other search methods when robust ga
set-tings had been found. The robustness of the method the precise location. One way to overcome this is to perform a local exhaustive search in the vicinity (⫾5 was controlled by evaluating the ability of the ga to
repeatedly find the global extremes in the simulated cM) of the extreme found by each ga-population. We noted a significant improvement in the location esti-data set with 18 QTL described below and real esti-data
from a wild boar⫻ Large White intercross consisting mates after implementing this.
The objective function used was the residual sum of of 191 individuals (Anderssonet al. 1994).
The ga was parameterized with the chromosome num- squared errors from a weighted least-squares approach to QTL mapping. The method is the extension of the ber and the chromosomal location as separate
parame-ters to obtain maximal blending of parameparame-ters during method of Jansen(1992) to the two-loci linear model
G⫽m⫹A1⫹ A2 ⫹D1⫹ D2⫹AA12⫹ AD12⫹AD21⫹
the search. A real-valued genetic algorithm was chosen
due to simple translation of ga-gene values to QTL loca- DD22as indicated by the author. The parameters of the
model are explained below. Markers have not been used tions. The real-valued ga using the standard settings in
PGAPack (Levine1996) had problems with premature as cofactors and successive iterations in the EM algo-rithm have been removed to increase the computational convergence when mapping in populations where
modi-2006 O¨ . Carlborg, L. Andersson and B. Kinghorn
fications needed for the single QTL mapping procedure 9–12, and 0.1 for QTL 13–16. These effects correspond to the genetic variances 0.08, 0.045, 0.020, and 0.005, described byJansenandStam(1994) when
implement-ing the two-QTL model included duplication of each respectively. The QTL effects for the models with 8 and 4 additive QTL were similar, but with 2 or 1 QTL in individual nine times (instead of three times, i.e., once
for every possible two-QTL genotype) and the use of each of the four QTL effect classes. The genetic variance explained by the pair of interacting QTL is given in an expanded design matrix (X ). The design matrix for
the two-locus linear model has been described byJana Table 2. The narrow-sense heritability was set to 0.5. The simulated effects of the QTL were chosen such that (1971). The weight for each observation was taken to
be the product of the conditional probabilities of the mapping of the QTL using an exhaustive enumerative search would detect the pair of interacting QTL in single-QTL genotypes given the markers (Haley and
Knott1992) at each of the two fitted QTL. The esti- ⬎80% of the simulated populations.
To evaluate the sensitivity of the search methods to mates of the model parameters can be found as
differences in detection power of the statistical mapping
ˆ ⫽(XTWX)⫺1XTWY
methods, lower QTL effects were simulated for the re-cessive epistatic model by using three different
heritabil-2 ⫽(1/N )(Y⫺Xˆ)T
W(Y⫺Xˆ),
ities, 0.5, 0.1, and 0.01. The different heritabilities were where Y is the complete data vector, X is the design obtained by increasing the residual variance relative to matrix for the complete data, W is the diagonal matrix the QTL effects. The detection powers for these herita-of weights,is the vector of the regression parameters, bilities were 80, 70, and 50%, using the exhaustive
enu-2is the normal variance, and N is the number of
individ-merative search.
uals (JansenandStam1994). Each simulated population was analyzed using two The residual sums of squared errors can then be calcu- different methods. Method 1 was simultaneous mapping lated as of two interacting QTL using a genetic algorithm. Method 2 was mapping of two interacting QTL by first SSE⫽(Y ⫺Xˆ)T
W(Y⫺Xˆ).
performing a one-dimensional search, using the method described by Haleyand Knott (1992), to identify the The method described above can easily be extended
to take account of background QTL in the analysis. Two most significant single QTL and then subsequently search-ing for a second QTL showsearch-ing epistatic interactions with extra ga-genes are added to the genetic algorithm and
two extra columns are added to the X matrix for each the previously detected QTL. This latter procedure is from here on called a conditional QTL search. The background QTL. The extra ga-genes represent the
chromosomal location for the QTL and the columns in second search is in one dimension and uses the two-QTL epistatic model, where the location of the first the design matrix are to contain the QTL indicator
variables a and d (HaleyandKnott1992) for a QTL QTL is fixed at the location of the most significant single QTL. Both methods used the previously described at the location given by the ga-genes. The rest of the
evaluation procedure is the same as before. We have weighted least-squares method. Detection of the epi-static QTL was declared upon identification of two QTL evaluated the increase in computational demand for a
simultaneous search for more than two QTL using this on the chromosomes where the simulated major QTL were located, i.e., no significance thresholds have been method, but have not investigated any other properties.
Simulations:To evaluate the robustness of the genetic used at this stage. The comparison between the ga-based and the conditional search is not fair, since the condi-algorithm and to show the advantages of mapping
multi-ple QTL simultaneously, data were simulated for five tional search is model dependent in the sense that it relies on the contribution of epistasis to additive and genetic models (described below) with 100 replicates
of 520 F2 individuals from a cross between two inbred dominance variances for detection of the first QTL.
Thus, it does not guarantee giving the right answer lines. The simulated genome consisted of 20
chromo-somes, each 100 cM in length, carrying fully informative when searching for two QTL, while the ga does. This comparison has been included anyway to show how the marker loci at the ends and at 10-cM intervals.
Cross-overs were generated using Haldane’s mapping func- more theoretically correct genetic algorithm compares to the conditional search that is frequently used in prac-tion without interference (Haldane1919).
Four different combinations of interacting and addi- tice.
Epistatic model:The epistatic model used in the re-tive QTL were evaluated. All contained two epistatically
interacting QTL and a varying number of fully additive gression was the two-locus linear model G⫽m⫹A1⫹ A2⫹ D1 ⫹ D2 ⫹AA12⫹ AD12⫹ AD21⫹DD22, where A1
QTL, which were all fixed in the parental lines and
simulated at random locations in the genome. Only one is the additive effect at locus 1, A2is the additive effect
at locus 2, D1 is the dominance effect at locus 1, D2 is
QTL was allowed on each chromosome. The number
of additive QTL were in turn 16, 8, 4, and 0. The additive the dominance effect at locus 2, AA12is the interaction
between A1 and A2, AD12is the interaction between A1
effects for the combination with 16 fully additive QTL
TABLE 1
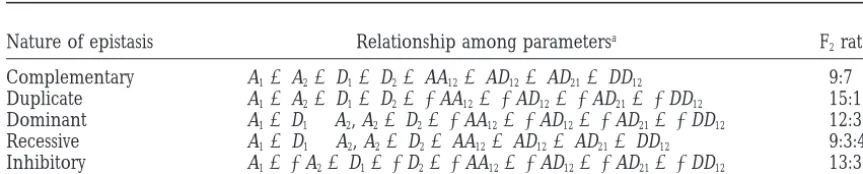
The relationships among the eight genetic parameters producing digenic segregation ratios in the F2 generation characteristic of classical epistasis (from Jana 1971)
Nature of epistasis Relationship among parametersa F
2ratio
Complementary A1⫽A2⫽D1⫽D2⫽AA12⫽AD12⫽AD21⫽DD12 9:7
Duplicate A1⫽A2⫽D1⫽D2⫽ ⫺AA12⫽ ⫺AD12⫽ ⫺AD21⫽ ⫺DD12 15:1
Dominant A1⫽D1⬆A2, A2⫽D2⫽ ⫺AA12⫽ ⫺AD12⫽ ⫺AD21⫽ ⫺DD12 12:3:1
Recessive A1⫽D1⬆A2, A2⫽D2⫽AA12⫽AD12⫽AD21⫽DD12 9:3:4
Inhibitory A1⫽ ⫺A2⫽D1⫽ ⫺D2⫽ ⫺AA12⫽ ⫺AD12⫽ ⫺AD21⫽ ⫺DD12 13:3
aA
1is the additive effect at locus 1; A2is the additive effect at locus 2; D1is the dominance effect at locus 1; D2 is the dominance effect at locus 2; AA12is the interaction between A1and A2; AD12is the interaction between A1and D2; AD21is the interaction between A2and D1; and DD12is the interaction between D1and D2.
DD12is the interaction between D1and D2(Jana1971). dominant epistasis and is the special case when the two
genes have equal-sized effects with opposite signs. The The epistatic interactions used for the simulation study
were the classical models of epistasis: complementary, expected segregation ratio is here 13:3. The relation-ships among the genetic parameters for these five ge-dominant, duplicate, recessive, and inhibitory epistasis
(Jana1971). Complementary epistasis is observed when netic models are given in Table 1. The translation of the genetic parameters to the genotypic effects of the a defect in either of two genes gives the same mutant
phenotype, giving an expected Mendelian segregation two interacting QTL are given in Figure 2. The geno-typic effects and genogeno-typic variances for the two inter-ratio of 9:7 (Table 1). In this case, functional copies of
both genes must be present to produce the dominant acting QTL for the five epistatic models are given in Table 2.
phenotype. Duplicate epistasis is observed when a defect
in two genes gives a mutant phenotype and the expected Computational efficiency: The computational effi-ciency was compared by calculating the number of statis-segregation ratio is 15:1. In this case, a functional copy
of only one of the two genes must be present to produce tical evaluations performed during QTL mapping. Three search methods were compared: an exhaustive the dominant phenotype. Dominant, recessive, and
in-hibitory epistasis occurs when one gene blocks the phe- enumerative search, a genetic algorithm-based search, and a conditional search. Comparisons were made for notypic expression of a second gene. For dominant
epis-tasis, the dominant allele at the first locus is also mapping two, three, and four QTL in a genome size of 2000 cM using 1-cM resolution.
dominant over the alleles at the second locus. The phe-notypic effects of the second locus are therefore ex-pressed only when the individual is recessive
homozy-RESULTS
gote at the first locus. This gives an expected segregation
ratio of 12:3:1. Recessive epistasis occurs when the reces- The simulation study was performed on data where 18, 10, 6, and 2 QTL together explained all genetic sive homozygote at one locus is dominant over the
al-leles at the other locus. The phenotypic effects for the variation. Depending on the genetic model simulated, the amount of additive and nonadditive genetic varia-second locus are therefore expressed only when the
individual is dominant homozygous or heterozygous at tion explained by the two major QTL varies. We have not used any significance levels at this stage, but instead the first locus. The expected segregation ratio is in this
case 9:3:4. Inhibitory epistasis works in the same way as defined the power of the exhaustive search-based
2008 O¨ . Carlborg, L. Andersson and B. Kinghorn
TABLE 2
The genetic effects of the simulated QTL for the five epistatic models used in the simulation study
QTL genotype effect
Nature of epistasis QQQQ QQQq QQqq QqQQ QqQq Qqqq qqQQ qqQq qqqq Vga
Complementary 1.2 1.2 ⫺0.4 1.2 1.2 ⫺0.4 ⫺0.4 ⫺0.4 ⫺0.4 0.63
Duplicate 0.6 0.6 0.6 0.6 0.6 0.6 0.6 0.6 ⫺1.8 0.34
Dominant 0.4 0.4 0.4 0.4 0.4 0.4 ⫺1.4 ⫺1.4 0.6 0.50
Recessive ⫺0.6 ⫺0.6 1.4 ⫺0.6 ⫺0.6 1.4 ⫺0.4 ⫺0.4 ⫺0.4 0.58
Inhibitory 0.5 0.5 0.5 0.5 0.5 0.5 ⫺1.5 ⫺1.5 0.5 0.61
aV
gis the genetic variance explained by the two epistatic QTL.
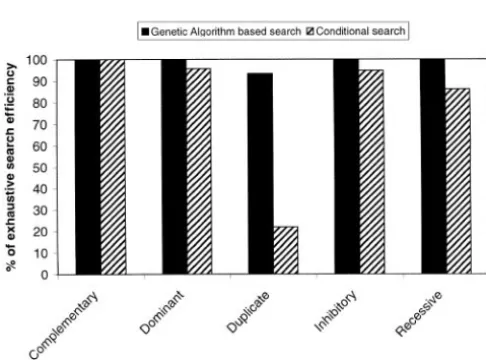
method as the percentage of the cases where the lowest The difference in relative efficiency for the search meth-ods was very large for the duplicate epistatic model, residual sum of squares is at the simulated positions
that explain the highest amount of genetic variance. where the conditional search had a relative efficiency of only 21%, while the genetic algorithm-based search We have chosen to describe the efficiency of the QTL
mapping method as its relative efficiency of detection had a relative efficiency of 93%. The relative efficiency of the genetic algorithm-based and the conditional QTL as compared to the method using the exhaustive
enu-merative search, which is the limit of the power of the search methods remained constant when the power of the statistical QTL mapping method was decreased from statistical QTL mapping method. The results from the
simulation study with 18 QTL (Figure 3) showed that 80 to 50% by lowering the heritability from 0.5 to 0.01. Decreasing the number of background QTL from 16 the genetic algorithm-based search had higher relative
efficiency to detect the simulated pair of epistatically to 8 and from 8 to 4 only affected the relative efficiencies of the search methods marginally. In the simulation interacting QTL than the conditional search for all
epi-static models tested, except the complementary, where where two interacting QTL explained all genetic varia-tion, both methods had a relative efficiency of 100%. the methods were both fully efficient. The genetic
algo-rithm had a relative efficiency of 100% for all epistatic The genetic algorithm increases the computational demand by a factor of 3–5 when compared to the condi-models but the duplicate. The conditional search had
between 86 and 96% relative efficiency for the domi- tional search (Table 3). The improvement in computa-tional efficiency of the ga, as compared to the exhaustive nant, recessive, and inhibitory epistatic models and
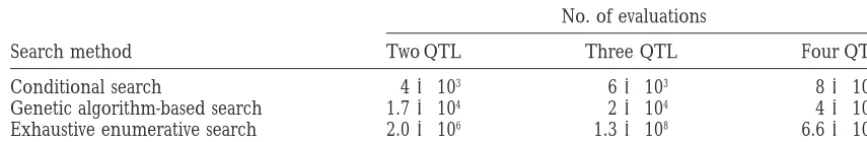
100% relative efficiency for the complementary model. enumerative search, was by a factor 133 for two QTL. An expansion of the search to additional dimensions by also searching for background QTL simultaneously leads to further computational advantages for the ga-based search. Improvements are in the order of 65,000 for three QTL and 1.7⫻107for four simultaneous QTL.
DISCUSSION
This study has shown that the genetic algorithm has large potential for improving the computational effi-ciency for simultaneous mapping of multiple interacting QTL. It can be used together with any QTL mapping method based on a multidimensional search in the ge-nome. Implementation is simplified by the use of exist-ing software libraries and the results from our simula-tion study show that the method is robust in finding the pair of QTL in the genome with the highest statistical support. The computational advantage of using a ge-netic algorithm increases with the complexity of the
Figure3.—Efficiency of genetic algorithm and conditional
QTL searches for two QTL with simulated complementary, QTL mapping method and the number of QTL simulta-dominant, duplicate, recessive, and inhibitory epistatic inter- neously searched for. The greatest potential benefit of actions. The efficiency is measured as the relative efficiency
using this method is therefore when using
multidimen-of QTL mapping using the search algorithm compared to the
sional searches based on computationally demanding
efficiency of the exhaustive enumerative search. The results
TABLE 3
Number of statistical evaluations when searching for two, three, or four QTL using a conditioned search for additional interacting QTL, or a simultaneous search for two or more interacting QTL using a genetic algorithm, or an exhaustive enumerative search with a stepsize of 1 cM
No. of evaluations
Search method Two QTL Three QTL Four QTL
Conditional search 4⫻103 6⫻103 8⫻103
Genetic algorithm-based search 1.7⫻104 2⫻104 4⫻104
Exhaustive enumerative search 2.0⫻106 1.3⫻108 6.6⫻1011
In our simulation study, the efficiency, defined as the multaneous search. The statistical support for the addi-relative efficiency to that of an exhaustive enumerative tional QTL can then be evaluated for the QTL positions search, of the genetic algorithm-based search was 100% indicated by the ga. The genetic algorithm-based search for all epistatic models but the duplicate, where it was can then be used repetitively for successive searches for 93%. The genetic algorithm had thus, regardless of the additional QTL in higher dimensions.
model of epistatic interaction, almost as high relative One major issue when using multiple QTL models efficiency as the exhaustive search, using only a fraction in practice is to draw statistical inferences about the of the CPU time. The conditional QTL search had rea- support for additional QTL. Randomization testing sonable relative efficiency (86–100%) for all genetic (ChurchillandDoerge1994) is an intuitively attrac-models but the duplicate, where it was only 21%. There tive way to derive appropriate threshold values for de-was no indication that the relative efficiencies of the claring significant QTL effects. This method is, however, genetic algorithm or the conditional QTL searches were computationally demanding and has until now not been reduced at lower QTL effects or varied number of back- feasible to use for QTL mapping methods with high ground QTL. The conditional search was thus more computational demands. The use of a genetic algorithm sensitive to the type of epistatic interaction and the size as described here would make randomization testing of the QTL effects than the genetic algorithm. There feasible for more complex mapping methods and multi-was also a tendency toward a generally lower relative ple QTL models and thus make these methods more efficiency for the conditional search method for the useful for analysis of real data. The computational im-other epistatic interaction models. The conclusion from provement in randomization testing will be consider-the simulation study is thus that consider-the genetic algorithm is able when using the genetic algorithm-based search. a good alternative to the exhaustive enumerative search The genetic algorithm is a general tool to search large and that it has potential to be of great use in practice, parameter spaces and could be of use in many other where the time for analysis is limited. It should be noted areas in QTL mapping. In this study, we have used a that the detection power of the genetic algorithm was genetic algorithm in the search for two interacting QTL achieved using a general genetic algorithm software in a cross between inbred lines, but the method can package for ease of implementation. A custom-written also be used for analyses of crosses between outbred genetic algorithm optimized for the problem will most lines and in searches for more than two QTL. For analy-likely achieve higher power of detection in a more
com-ses of outbred lines, the genetic algorithm could also putationally efficient way.
be used when testing for QTL segregation within the The simultaneous mapping methods used for this
founder lines. This would be implemented by using a study were based on least squares. We do not expect
genetic algorithm to group the haplotypes from the that the use of a maximum-likelihood method instead
founders in allelic groups and in this way obtaining of least-squares regression would alter our conclusions
the most likely allelic constitution for the founders and as the two methods generally give very similar results
other individuals in the pedigree. This results in greater (Haley and Knott 1992; Martinez and Curnow
detection power because of more extreme probabilities 1992). The least-squares method was used because of
of identity by descent of chromosomal regions between its speed of computation.
phenotyped individuals and each founder. The method proposed here to detect interacting QTL
We thank Julius van der Werf and Susan Mezaros for many useful
would in practice be used as a complement to existing
discussions about genetic algorithms and statistical methods for QTL
QTL mapping methods. The genome should first be
mapping and Lena Andersson-Eklund for valuable comments on the
searched in one dimension to identify QTL with high manuscript. This work was supported by the National Graduate School individual effects, after which a search would be per- in Scientific Computing, the Food21 project (MISTRA), the Swedish formed to identify additional QTL, both interacting and Medical Research Council (MFR), and a travel grant from the Swedish
University of Agricultural Sciences.
si-2010 O¨ . Carlborg, L. Andersson and B. Kinghorn
Jansen, R. C.,1992 A general mixture model for mapping
quantita-LITERATURE CITED
tive trait loci by using molecular markers. Theor. Appl. Genet. 85:252–260.
Andersson, L., C. S. Haley, H. Ellegren, S. A. Knott, M.
Johans-sonet al., 1994 Genetic mapping of quantitative trait loci for Jansen, R. C.,1993 Interval mapping of multiple quantitative trait loci. Genetics 135: 205–211.
growth and fatness in pigs. Science 263: 1771–1774.
Churchill, G. A.,andR. W. Doerge,1994 Empirical threshold Jansen, R. C.,andP. Stam,1994 High resolution of quantitative traits into multiple loci via interval mapping. Genetics 136: 1447– values for quantitative trait mapping. Genetics 138: 963–971.
Crow, J. F.,andM. Kimura,1970 An Introduction to Population Genet- 1455.
Kao, C-H., Z-B. ZengandR. D. Teasdale,1999 Multiple interval
ics Theory. Harper and Row, New York.
Goldberg, D. E.,1989 Genetic Algorithms in Search, Optimization and mapping for quantitative trait loci. Genetics 152: 1203–1216.
Kruglyak, L.,andE. S. Lander,1995 A nonparametric approach
Machine Learning. Addison and Wesley, Reading, MA.
Haldane, J. B. S.,1919 The combination of linkage values and the for mapping quantitative trait loci. Genetics 139: 1421–1428.
Lander, E. S.,andD. Botstein,1989 Mapping mendelian factors calculation of distances between loci of linked factors. J. Genet.
8:299–309. underlying quantitative traits using RFLP linkage maps. Genetics 121:185–199.
Haley, C. S.,andS. A. Knott,1992 A simple regression method
for mapping quantitative trait loci in line crosses using flanking Levine, D.,1996 Users Guide to the PGAPack Parallel Genetic Algorithm Library. Argonne National Laboratory, Mathematics and
Com-markers. Heredity 69: 315–324.
Hoeschele, I.,andP. VanRanden,1993a Bayesian analysis of link- puter Science Division, Argonne, IL.
Martinez, O.,andR. N. Curnow,1992 Estimating the locations age between genetic markers and quantitative trait loci. I. Prior
knowledge. Theor. Appl. Genet. 85: 953–960. and sizes of effects of quantitative trait loci using flanking mark-ers. Theor. Appl. Genet. 85: 480–488.
Hoeschele, I.,andP. VanRanden,1993b Bayesian analysis of
link-age between genetic markers and quantitative trait loci. II. Com- Thomas, D.,andV. Cortessis,1992 A Gibbs sampling approach to linkage analysis. Hum. Hered. 42: 63–76.
bining prior knowledge with experimental evidence. Theor. Appl.
Genet. 85: 946–952. Zeng, Z-B.,1993a Theoretical basis for separation of multiple linked gene effects in mapping quantitative trait loci. Proc. Natl. Acad.
Holland, J.,1975 Adaption in Natural and Artificial Systems. The
Uni-Sci. USA 90: 10972–10976. versity of Michigan Press, Ann Arbor, MI.
Zeng, Z-B.,1993b Precision mapping of quantitative trait loci.
Ge-Jana, S.,1971 Simulation of quantitative characters from
qualita-netics 136: 1456–1468. tively acting genes. I. Nonallelic gene interactions involving two