Page 211
IMPLEMENTING AN OWN SURVEY BY AN INDIVIDUAL RESEARCHER OR BY A SMALL TEAM
Doroteya T. Shtereva-Tzouni, E. Naseva
Medical University – Sofia, Faculty of Public Health, Department of Health Economics, 1527 Sofia, Bulgaria
Abstract
The presentation of results obtained by researchers’ own surveys always assigns more value to the scientific work. This paper aims to assist at least all interested young scientists in designing their own survey by systematizing and presenting in a structured, clear format the process of its implementation. It also aims to support the creation of skills and building up habits for elaboration of author’s scientific projects. This paper emphasizes on the challenges and requirements to the conduction of own surveys by an individual researchers or a small team.
Key words: own survey, data, representative sample
Depending on the aim and tasks of the scientific work, the data in the surveys can be primary and secondary:
Primary data are those that have been collected independently by the researcher or the team through the particular survey;
Secondary data are those, obtained by other researchers/teams on other occasions, available for use. For example, such are the official data of the National Statistical Institute (NSI), National Center of Public Health and Analyses (NCPHA). Bulgarian National Bank (BNB), Eurostat, etc. The advantages of using secondary data are that their collection is less expensive and quicker, requires less efforts, besides that there are phenomena that cannot be observed directly and their analysis is possible only using secondary data (e.g. birth rate, mortality rate, gross domestic product (GDP), etc.).
An individual researcher has two comparatively resource-consuming ways to collect data for own survey: using secondary data or realization of the so-called questionnaire study, that consists in fact of conduction of a comprehensive study with several particular phases: description (planning and organization) of the survey, measurements (field phase), statistical processing (description and analysis) of the data, discussion (interpretation and compilation) of the results. The last two phases most often progress simultaneously.
Page 212
1. FIRST PHASE – DESCRIPTION (PLANNING AND ORGANIZATION) OF THE SURVEY This phase covers the elaboration of a detailed description of the survey methodology. This includes the definition of:
Topic – it must be associated with the subject of the survey and reflect the particular issue;
Subject — those aspects, properties and features of the subject focusing the researcher’s attention, that most precisely reflect the studied phenomenon;
Aims – reflecting briefly and clearly what the researcher wishes to achieve through this particular survey. Data collection cannot be an aim, it is an instrument for achievement of the aim. The aim, though, could be the clarification of various public problems;
Formulation of the tasks – concrete identification of the aim and topic of the survey through setting accurate parameters;
Object and methodology of the sample:
– The object of the surveyed phenomenon is that field of social reality that will be investigated by the researcher. Usually it is a group of people but sometimes it is possible that the surveyed object are hospitals, country regions or even states;
– The general aggregate (aka population) is the human community in which margins the object will be investigated and which possesses the features to be surveyed. The extent of covering the general aggregate determines the type of the study – comprehensive (covering all studied objects in the general aggregate) or sample (covering part of the units of the population). The so called representative samples are of interest as the conclusions and evidence based on such samples are valid for the whole aggregate;
– Observation units – each particular case (individual), carrier of the surveyed empirical information or his/her entourage. Respondent is every person and/or his/her entourage included in the sample and subjected to the survey.
Time and territorial range of the survey – they define the time and space covered by the survey, e.g. the survey was conducted in the period September - December 2015 on the territory of Sofia city/two pharmacies in Sofia/two schools in the capital/3 kindergartens in Silistra region etc.;
Working hypotheses – they are formulated before the onset of the survey and the collected evidence is used to test (confirm/reject) them;
Registration methods – selected among the following methods:
– questionnaire (collecting information through respondent’s filling in a questionnaire sheet); – interview (collecting information through filling in a questionnaire – the interviewer asks
questions and writes the answers in the questionnaire sheet;
– monitoring (collecting information through completing a monitoring sheet by the researcher); – group discussion/focus group (collecting information through implementing a scenario for
group discussion);
– experiment.
The most frequently implemented registration methods are questionnaire/interview but the elaboration of the instruments for registration with the other methods is similar. The development of questionnaire/interview requires the formulation of scores for measurement.
Page 213
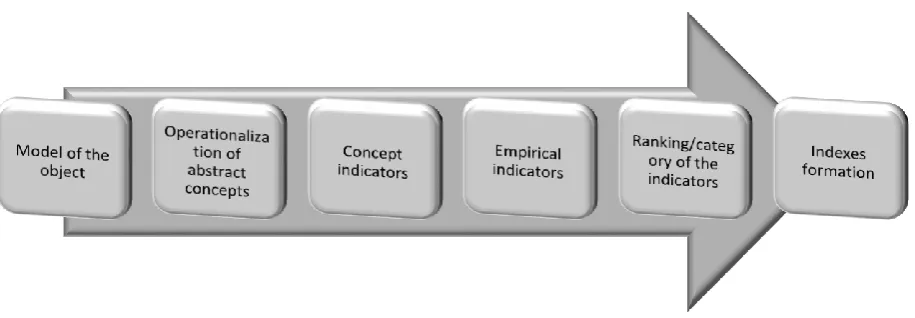
The development of scores for measurement passes through several stages (Fig. 1):
Creating a description (model) of the object;
Defining and operationalizing the key abstract concepts;
Developing concept indicators and, on that basis – empirical indicators (the lowest level of the concept). All indicators must be formulated as concepts, looking not so complex, hard to understand or ambiguous;
Defining empirical indicators rankings;
Forming indexes.
Fig. 1. Development of scores for measurement
For example, if the hypotheses of the survey suppose that the patents’ social status is associated with their health knowledge, then it should be included in the questionnaire card. The term “social status” is quite abstract and it cannot be included in a questionnaire. It would be absurd to ask the question “Please, mark your social status” – everyone (including the investigator himself) has a different view of this term as it is multilayer and covers numerous various elements. If the term is operationalized down to the concept indicator “income status”, it will seem much more understandable, although it is not fully unambiguous. That is why the relevant empirical indicators would be “personal net monthly income for the last month in BGN”. The same abstract concept “social status” can be operationalized to concept indicators such as employment, family status, educational status, real estate ownership, vehicle ownership etc., that will also be defined unambiguously as empirical indicators. Of course, not all hypotheses in a given survey contain so many abstract terms. Most of them are associated with more understandable indicators in everyday wording, that do not need to be operationalized (e.g. sex, age, family status, number of children in the family, etc.).
The formation of categories (ranks) of the indicators implicates listing of the varieties of the replies. For example, the family status can cover the varieties: single, married, divorcee, widower/widow, cohabitation; employment could include full-time employment, part-time employment, student, pensioner, unemployed, etc. The variables, measured numerically need not be described by ranks. The indexes, associated with further computer processing of the results – each version f the reply must be numerically coded although those numbers do not carry quantitative meaning.
The variables (also known as features) are the types of information we collect for the object of the survey. They reflect its different sides, aspects, qualities. Depending on the way of their measurement they are quantitative and category variables. Each question in a questionnaire or interview presents one variable (more than one variable in some cases – in the case of the so called multiple questions).
Page 214
children in the family, age, etc. The common between them is that they are expressed by numbers and their values can be measured or counted.
The category variables (also called qualitative, attributive) reflect qualitative differences between the studied objects. Those are sex, education, presence of a particular disease (for example, presence or absence of diabetes), skin (hair, eyes) color, blood group, race. They cannot be measured because they reflect qualities. The versions of the qualitative variables are certain categories (sometimes quite abstract) and cannot be presented by numbers.
The availability of quantitative data enables the implementation of more powerful statistical analyses, that is why it is always better to combine numerical signs. This is not always possible as for example, sex is a category item. There are variables that can be both quantitative and category, their type depending on the researcher compiling the questionnaire. Age, for example it is possible to collect data for the number of years of age, but the respondents could just be asked about the age group they belong with (child, adult or < 18, 19-35, 36-50, 50 and more, etc..). Blood glucose levels can be entered as values in mmol/l or it could be just noted whether they are normal, decreased or elevated. Smoking could be marked as smoker or non-smoker, but the daily smoked number of cigarettes could also be reported. In all cases the rule is to collect data with quantitative variables because the conversion of the variable into a category one can always be made in the course of the analysis but, if only category information is available the quantitative information cannot be found after the data collection is over. Thus it is relevant to record the age in years, smoking as number of cigarettes smoked daily, blood sugar – in the respective units, etc.
The scales must comply with three main requirements:
Validity – measuring only what the researcher needs without mixing it with other features;
Stability – to provide similar results at repeated measurement;
Sensitivity – to report the smallest possible differences.
The development of the questionnaire/interview card goes through several stages. One cannot start with simple writing down questions, it is necessary before it to define the aim and tasks and formulate hypotheses. In the opposite case the questionnaire/interview will be just curiosity.
Each aim provides at least two tasks; hypotheses are formulated for each task associated with provisional characteristics of the studied object. The hypotheses logically outline the questions (Fig.2).
Fig. 2. Elaboration of a questionnaire Aim
Task 1
Hypothesis
Question Question Question
Hypothesis
Question Question
Task 2
Hypothesis
Question Question
Hypothesis
Question Question
Hypothesis
Page 215
In some cases, instead of elaborating a new questionnaire card it is possible to use questionnaires, previously compiled by other teams, for example for quality of life (EQ-5D, SF12, etc.), completing them with the necessary passport section associated with the aim of the study, and requesting the translations into the relevant language as set by relevant regulations. Sometimes this procedure includes authors’ rights fees.
The questions can be of different type, depending on their:
Format: open, closed, semi-closed. The open questions do not contain pre-formulated answers and the respondents have the possibility to enter freely their opinion;
Number of possible answers: single and multiple;
Function: control and filtering. The control ones are used to check whether the respondents have answered correctly to important basic questions. This, though, must not be done by asking the same question again because the respondents might be offended, thus roundabout ways should be used. For example, the question “How often do you go to the cinema” could be followed by “When were you last to the cinema”. Filtering questions aim to differentiate the investigated individuals into groups, in order to ask them additional questions – for example, if contraceptive methods, applied by students, are studied, there will be different questions for men and for women;
Content: passport and basic. The basic questions are associated directly with the aim and tasks of the survey while the passport ones serve for classification purposes – sex, age, education, etc.
The first phase of the survey is obligatorily finalized by a test (pilot) study – testing the proper work of the tools and correcting timely any possible errors and omissions.
2. SECOND PHASE – MEASUREMENT (FIELD PHASE)
This is usually the most time-consuming phase of a survey. In order to obtain sensible evidence, it is important to complete the pre-set sample. This sample should be representative in order to transpose the conclusions and standpoints of the survey on the overall general aggregate.
The representative sample (aka occasional, stochastic, etc.) is achieved when two conditions are satisfied at the same time:
– Sufficiently large number of units (special formulae are used to calculate it);
– Those unite should be randomly and not intentionally chosen. This means that each unit has been given an equal chance to be selected, to enter the sample.
The most frequently asked question is about this “large” number – how many would be sufficient, will 100 be enough or would 150, 200, 500 or even 1000 be needed? The answer is that it depends on the number of the general aggregate and desired accuracy of the results. This means that the representative sample does not repeat the general aggregate perfectly but there is also a slight discrepancy – an error. This error is referred to as stochastic error and its value is pre-set by the researcher, that is, it is previously known. For example, if a survey of pre-election polls is concerned, an error of 5% would be too high as it would not capture adequately the votes for the small parties that would be arranged around the election threshold. An error of 5% would be satisfactory if it is necessary to establish the number of blue balls among 10000 balls of three different colors.
In all cases, in order to recruit a representative sample of good quality, the researcher must have information on the general aggregate: number of objects (individuals), their distribution by an important feature, territorial distribution, etc.
Page 216
look for another information for distribution of important features. The sample size is calculated most easily through calculators, available in the Internet (for each further survey the researcher will need only to modify the number of people in the general aggregate). In fact, the investigated objects are not structured in this way and the practice requires the use of more complex representative samples, such as regional, nested, etc.
A single researcher is not always capable to recruit a representative sample. Then, the researcher should resort to non-representative samples, the most popular of which are the quota, typological and “snowball” sample types. There are no requirements to the size of those samples but it should better be close to that calculated for a simple random sample for the same general aggregate. As a rule, the telephone interview and internet inquiry are made on the basis of non-representative samples because not everybody has an available phone or Internet.
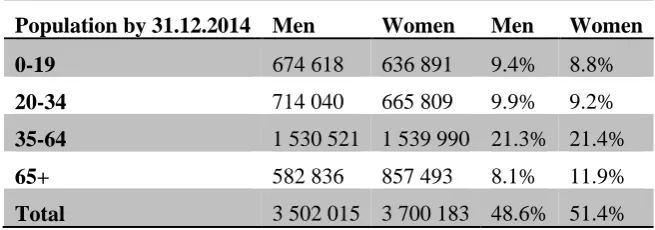
The quota sample, just like representative samples, requires preliminary information about the object of survey but only on certain important features, called quoting features. Usually features related to the studied indicators are selected as quoting, for example sex and age. In order to recruit a sample, the researcher will need the distributions in the general aggregate simultaneously for sex and age for example, as shown in Table 1:
Table 1. Distribution of the population by the main quoting features Population by 31.12.2014 Men Women Men Women
0-19 674 618 636 891 9.4% 8.8%
20-34 714 040 665 809 9.9% 9.2%
35-64 1 530 521 1 539 990 21.3% 21.4%
65+ 582 836 857 493 8.1% 11.9%
Total 3 502 015 3 700 183 48.6% 51.4%
This means that in the quota sample 9.4% must be men, aged 0 - 19, 8.8% women of the same age, etc. and, as a whole 48.6% of the overall sample must be men and 51.4% – women. The quota sample provides representability, but only referring to the quota features. Considering a defined sample size of 500 individuals, the number of respondents for each category is easily calculated: for example, men up to 19 years of age must be 9.4 *500/100 = 47 persons.
The typological sample includes particular categories of units, complying with certain criteria. For example, those are types of hospitals, different pharmacies according to the type of activity they practice; types of patients or types of hospital staff. The criteria are identified on expert assessment basis and in compliance with the aims of the survey. Usually an equal number of the different types is included in the sample, or their number is proportional to their real distribution.
Page 217
3. THIRD STAGE – STATISTICAL PROCESSING (DESCRIPTION AND ANALYSIS) OF THE DATA
The contemporary statistical analyses of data are realized by computers. Generally speaking, each software package that is able to process aggregate information, can calculate various generalizing characteristics or supports to a certain extent the process of collecting and processing data intended for statistical analysis, can be referred to as statistical. Not only products that are mainly designed to process data but also text-, image-, audio-, video-processing program packages have such capacities. More precisely, a software product can be called statistical if it has possibilities for calculation of most major generalizing characteristics of the central trend, variation, distribution pattern, analysis of empirical distributions and their comparison with theoretical ones, testing statistical hypotheses, etc.
The first software product for statistical processing of data was elaborated in 1968 and since then the modern software industry has created numerous packages for data analysis. According to their functional designation the program products are classified in several main groups: packages for creation, organization and editing of data arrays (dBase, Access, Excel, Lotus, etc.); programs for graphic images (Adobe Illustrator, DeltaGraph, etc.); standard program packages for statistical analysis of data, that are more a language for programming, rather having user-oriented interface (Soritec, R, SAS, Stata, etc.); integrated standard program packages (EPI Info, SPSS, Statistica, etc.).
Besides software products for pure statistical processing of data there are additional applications supporting the process of data collection, such as programs adapted for tablets or other portable equipment where the interviewers enter the data in real time, as well as programs specially designed for electronic identification of data that export the information from scanned questionnaire sheets in different formats. The various online applications for data collection in the form of questions in an inquiry can also be attributed to “statistical” software. A known platform offering free services is Surveymonkey, Wufoo is similar to it, and the Google forms turn out to be very convenient for the same purpose – it supports interface in Bulgarian too and exports the entered data attaching date and hour of entering to a table that can be converted to Excel.
The presence of so many software types and individual programs of each type logically provokes the question: which of them should be used? The answer to this question is biased and depends on:
– Character of the investigated issue, object and scope of the survey;
– Necessary level of the analysis – descriptive or analytical, necessity to employ more complex statistical methods and to what extent;
– Available allocated funds to purchase software (if not available, there are free versions or version for short-time use – the so called trial versions);
– Time that the researcher can spare to explore new program products; – Level of researcher’s knowledge of statistics, etc.
The chosen software product, on one side, must be powerful enough to perform the necessary calculations and to present the investigated processes graphically. On the other hand, very complex products are difficult for use in elementary tasks. In case of fairly uncomplicated surveys with a small number of variables and relatively small number of covered cases the most appropriate decision is to use electronic tables like those of Excel. When complicated calculations and comprehensive tests are necessary, with many variables and evidence, programming, etc. it is advisable to implement specific statistical products, such as SPSS. In case the researcher has poor knowledge on statistics, it is recommendable to use online modules for data collection if the survey type and the predefined sample match the requirements of the online processing methods.
Page 218
The computer data processing requires even category variables to be assigned numerical values, called codes (the already known indexes – final phase of the operationalization of abstract terms). The best advice is to enter them yet on the primary documents for data collection (questionnaire, interview sheet, etc.) and in case this is impossible – to list them on a separate sheet, obligatorily using the same coding for all data, included in the given survey.
In order to obtain valid results, it is necessary to store individual data in file format and not compiled in tables. Individual data are in fact the primary data from the primary documents, entered into the computer.
After the data are entered they must be checked for errors. Errors can occur both at filling in the primary documents and in the process of entering the data into the computer.
This stage of the survey is the phase of performing the envisaged statistical analyses and the data are presented in table and graphic form.
4. FOURTH STAGE – DISCUSSION (INTERPRETATION AND GENERALIZATION) OF THE RESULTS
During this stage the results are subjected to comprehensive discussion and interpretation from the viewpoint of the aims and tasks, emphasizing on all more important facts established in the course of the survey. The significance and proof power of the results are of special importance as well as their representability and to the various aspects of the survey validity.
The end of this stage (that is also the end of the study) is the time to formulate the suppositions and conclusions. New hypotheses can be defined, associated with the issues demanding further surveys, recommendations are elaborated addressing the responsible institutions, etc.
REFERENCES
1. Arseniev, A 2012, Lectures of medical sociology, Propeler, Sofia.
2. Dimitrov, I 2007, Fundamentals of the scientific research in the field of medicine. Methods and methodology, IK VAP, Plovdiv. Master program Regulations and standards in medicine, electronic textbook (CD-ROM) 2012, New Bulgarian University, Sofia.
3. Gatev, K 1993, Statistical methods and models, part two, University Publisher Stopanstvo, Sofia.
4. Getov (ed.), Basic pharmacoepidemiology, EcoPrint, Sofia.
5. Manov, A 1995. Statistics with a computer, University Publisher Stopanstvo, Sofia.
6. Methodology of the scientific research 2013, Ts Vodenicharov (ed), EcoPrint, Sofia.
7. Naseva, E 2013, ‘Methods of planning and conducting of pharmacoepidemiological study’, In IN
8. Naseva, E, Vaseva, V, Kundurjiev, T & Stoycheva M 2013, ‘Preparation of biomedical data for statistical processing and analysis’, Military medicine, no. 3-4, pp. 84-87.
9. Naseva, E, Popov, N, Vaseva, V, Kundurdzhiev, T & Stoycheva, M 2014, ‘How to choose proper statistical software’, Health Economics and Management, vol. 14. No. 3(53), pp. 36-39.
10. Ranchov, G 2008, Biomathematics and biostatistics, EcoPrint, Sofia.
11. Rothman, JR & Greenland, S 1998, Practical issues in the design and conduct of studies, 2nd edn,
Lippincott-Raven Publishers, USA.
Page 219
13. Shipkovenska, E 2011, ‘Methodology of the scientific and research work’, Health policy and management, no. 1, pp. 47-60.
14. Tzacheva, N, Lyubomirova, K, Yancheva-Stoicheva, M, Kundurzhiev, T & Naseva, E 2015, Occupational Medicine and Public Health, Part Three Statistics in occupational medicine, N Tzacheva (ed), MU-Sofia, Sofia.