Page 90
TEST OF DEPTH OF KNOWLEDGE FOR THE MATHEMATICAL CONCEPTS AND PRINCIPLES FOR CHILDREN
Georgi Petkov
New Bulgarian University, 21 Montevideo str., Sofia, 1618, Bulgaria
Abstract
Traditionally, students' mathematics skills are measured by standard tasks, which can be solved with algorithms intensively studied in class. The problem is that many of the children are able to memorize these algorithms and to solve the tasks, but they are unable to understand the deep causality behind these algorithms and to generalize from learning.
We created a test to study the deep mental representations of the studied mathematical material for children from 4th grade. We tried to estimate the depth of their internal mental representation using an indirect measure, namely the extent to which they use deep relational structures for unusual tasks.
Data for the reliability and validity of the test are presented. Comparative data are presented for different regions of the country; as well for children, which follow different educational systems. A validation of the test was presented through parallel data for the mathematical achievements of children, as well as their overall success in school.
Key words: testing, mathematical skills, mental representation, relational structure
1. THEORETICAL ASSUMPTIONS ABOUT RELATIONAL THINKING
Many researchers consider that our ability to deal with deep structures of relations is the basic core of human cognition (Hofstadter, 2001, Kokinov & French, 2003, Day & Gentner, 2007, Petkov et al., 2011, Halford et al., 2010). We may think about objects and their properties, but also about relations among them, as well about relations among relations. Pen et al. (2008), Penn & Povinelli (2012) argue that there is a fundamental, quantitative difference between Homo sapience and the other biological spices and that this difference is exactly in the human’s capabilities to manipulate very complex structures of relations. Gentner (2003) asks the questions “what makes us so smart?“ and finds the answer again in relational understanding and in the symbolic manipulations – a necessary part of the relational thinking.
Analogies are the most brilliant manifestation of relational thinking. Analogy means mapping between the relational structures of two domains, no matter of the concrete objects and their properties (Gentner & Smith, 2013, 2012, Gentner, 1983). Hofstadter (2001) generalizes the great importance of analogy making for all cognitive processes. According to him, analogy-making is a manifestation of the most characteristic feature of our thinking – haw the incoming information continuously maps to the memorized one, and during this mapping both they change until they fit consistently. According to Hofstadter, this is the basic way of how all cognitive processes operate.
Analogy making between remote domains is at the core of creativity (Dunbar, 1997; Hofstater et al., 1995, Markman & Wood, 2009). Kokinov (2004) shows brilliant examples of analogies in science and art that bring us huge aesthetic delight. People remember and repeat the good analogies; use them for convincing other people, as well themselves. Nersessian (1988) demonstrates how analogy-making is a fundamental instrument of the scientists for generation of novel ideas. Analogy making is assumed as one of the most important criterion for intelligence (Gentner, 2010); it is a necessary condition for learning of logical statements (Halford, 1993), for understanding of causal relationships (Walker & Gopnik, 2014), and even for understanding of the naïve physics (Pauen & Wilkening, 1997).
Page 91
2. UNDERSTANDING THE STRUCTURE OF THE PEOPLE’S INTERNAL
REPRESENTATIONS
However, in order to use fully this huge resource – relational thinking – it is necessary our memory to contain the relevant relational knowledge from the respective field, and to allow quick and effective access to it. Numerous studies have shown that the expertise and depth of knowledge in a given area are characterized by the fact that the internal mental representations consist of a deep causal and goals-oriented relational structure and ignoring the surface details.
From the other side, children’s' mathematics skills are traditionally measured by standard tasks, which can be solved with algorithms intensively studied in class. The problem with this method is that many of the children are able to memorize the basic algorithms and to solve different types of tasks, but they are unable to understand the deep causality behind these algorithms. Therefore, although these children demonstrate good performance on the exams, they cannot generalize from learning and cannot use their knowledge in novel tasks and problems.
One may ask whether we can check the children’s internal mental representation of the respective algorithms, instead of measuring directly the ability of children to apply them to concrete typical tasks. Trying to measure the internal relational knowledge gives us a possible direction of research on this issue.
During constructing such a test, we are motivated to access and measure the mental representations of the mathematical principles and concepts of the children. More concretely, we measure whether these mental representations are based on a deep relational structure or are grounded on mostly superficial characteristics of the studied material. Many investigations are convergent to the conclusion that expertize and depth of knowledge in a certain domain are characterized by the fact that the mental representations are based on deep causal and goal-oriented relational structure, as well on ignorance of the superficial details (Chi et al., 1981, Gentner & Ratermann, 1991, Hay et al., 2013, Jee & Wiley, 2007, Lowe, 1993, Jee et al., 2014, Goldwater & Gentner, 2015, Rottman et al., 2012). The experts in biology (Kindfield, 1992), in physics (Chi et al., 1981), in neurophysiology (Hay et al., 2013), in geology (Jee et al., 2014) paint much more schematic diagrams than the novels. However, the schematic diagrams of the experts include less superficial details but stress better on the respective cause-consequence relations. Lowe (1993) demonstrates that the experts also group together the items that are closer in respect to the causal structure, whereas the novels do according to a visual or special closeness.
3. CONSTRUCTING TEST FOR MEASURING THE DEPTH OF KNOWLEDGE
Page 92
representation. In this way, instead of measuring the children’s ability to apply directly the methods learned in class, we measure the depth of the mental representation of the studied material. Our indirect measure of the depth of knowledge is the extent to which deep relational structures participate in the mental representation of the mathematical concepts and principles.
3.1. Essence and structure of the test
In this test, children should group tasks, not to solve tasks. In this way, the depth of their mental representations is measured, not their ability to apply directly the trained in class methods for solving typical tasks. The indirect measure, extracted of the way they group tasks, is the degree, in which deep relational structures participate in their mental representations.
The test was designed for investigation of large groups of children. Thus, for easier and more effective processing of the results, the items are closed questions and participants are forced to choose one among three proposed options. Each of the items contains four mathematical tasks, or expressions, or figures. The task of the children was to group the four elements onto two groups of pairs (look at Figure 1 for an example). The three possible ways of grouping are presented to them as options for response.
Figure 1. Example of a test item (not included in the test). The task of the participants is to choose how to group the four mathematical expressions onto two pairs and to circle one of the possible
responses (1, 2, or 3) that visualize the three possible ways of grouping.
If a child circles the response option (1), this would mean that she had grouped the expressions ‘2. (3+3) and (8-6).6’ together, as well the expressions ‘2+ (3+3) and (8-6) +6’. This is a grouping on the basis of relational structure of the tasks. This answer would add one point to the total score of the child to test. The choice of the second option (2) would mean that the respective child has grouped based on the superficial similarities between the concrete numbers. The third option would indicate probably a random choice. Options (2) and (3) do not add points to the total score of the respective child.
3.2 Procedure of testing
Page 93
each of the items by circling one of the possible items. Making corrections during the testing is allowed but children should point out clearly their final choice. Circling two or more of the possible answers is assumed as a wrong answer and is estimated with zero points for the respective item. The total result for each of the children is calculated as a simple sum of all items. The minimal possible result is zero; the maximal one – 20, the chance level is 6-7.
3.3. Participants
325 children 4th grade were tested during the last month of their education in 4th grade (during the month of May). 49.2% of them was girls, 50.8% boys. Testing was performed in 16 schools in 14 populated places, including eight villages, four small towns, and two large towns (including the capital Sofia). There were two groups of students – educated by the JumpMap system (Mighton, 2003) and those following the standard program by the Ministry of education.
Together with the test of depth of knowledge, the children performed also a standard test for mathematical skills, divided on six domain parts. Four of these parts corresponded to the domains covered by the test (see table 1), the other two were about their mathematical dictionary. Data for the overall grade from school, the grade of mathematics, and the total number of absences from school were collected for every child.
Only 257 of the children completed both tests.
3.4. Stimuli
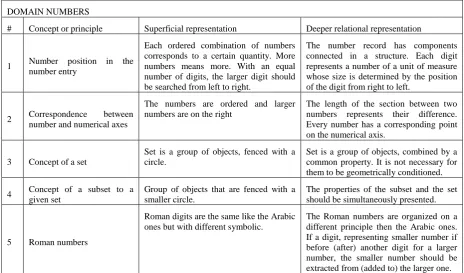
The 20 items cover the curriculum for the 4th year of education. The concepts and the principles that are tested are pointed in Table 1. For each of the 20 items, together with concept being tested, as well clarification of the eventual superficial and relational representations that somebody may have, are presented in Table 1.
Table 1. Concepts and principles for the curriculum for 4th grade, together with clarification for eventual superficial and relational internal mental representation of the respective concept or principle. DOMAIN NUMBERS
# Concept or principle Superficial representation Deeper relational representation
1 Number position in the number entry
Each ordered combination of numbers corresponds to a certain quantity. More numbers means more. With an equal number of digits, the larger digit should be searched from left to right.
The number record has components connected in a structure. Each digit represents a number of a unit of measure whose size is determined by the position of the digit from right to left.
2 Correspondence between number and numerical axes
The numbers are ordered and larger numbers are on the right
The length of the section between two numbers represents their difference. Every number has a corresponding point on the numerical axis.
3 Concept of a set
Set is a group of objects, fenced with a circle.
Set is a group of objects, combined by a common property. It is not necessary for them to be geometrically conditioned.
4 Concept of a subset to a given set
Group of objects that are fenced with a smaller circle.
The properties of the subset and the set should be simultaneously presented.
5 Roman numbers
Roman digits are the same like the Arabic ones but with different symbolic.
Page 94 DOMAIN OPERATIONS WITH NUMBERS
6 Using brackets
Do the operations in brackets first, then multiplication, then addition and subtraction.
Brackets have a purpose – they change the sequence of the operations
7 Arithmetic series and expressions
Series are increasing of similar elements Series are increasing with equal speed.
8 Addition and brackets Addition is like the other operation – should start from brackets
Addition is additive – the brackets do not matter.
9 Subtraction and brackets Subtraction is just like addition. Subtraction is not independent from the brackets.
10 Half and Quarter
Half – the whole is divided to 2;
Quarter – the whole is divided to 4.
Half and Quarter are specific parts of the whole.
DOMAIN GEOMETRY
11 Perimeter Larger figure means larger perimeter. The perimeter can be find by unfolding the figures
12 Area Area is calculated by multiplying the horizontal and the vertical sides
The area is equal to the number of 1x1 squares that fill the figure.
13 Square and rectangle
Both are associated with a prototypical spatial orientation.
Squares and rectangles are defined by their sides and angles and are independent on their orientation.
14 Types of triangles The types of triangles are associate with prototypical orientations in space.
Only the largest angle is important.
15 Angles in a circle Larger angle corresponds to larger area. Larger angle corresponds to larger proportion of the area.
DOMAIN RELATIONSHIP OF THE MATHEMATICS AND THE REAL WORLD
16 Text tasks with numerical expressions.
Memorizing the superficial order of the sentences.
Finding the type of expression for solving the task.
17 Units of measurement. Learning by heart – dividing to ten. Understanding the idea of a scale.
18 Squared measurement units. Analogically to the linear units – multiply by ten.
Multiplying by 10x10.
19 Solving a task with a mathematical model.
Every task from a concrete domain has its algorithm for solving it.
The domain does not matter. The algorithm is a sequence of abstract logical operations.
20 Measuring units for a currency
Superficial mapping of the order of the sentences.
Finding the type of expression for solving the task.
3.5 Results
Descriptive statistics, reliability, and the internal structure of the test
Page 95
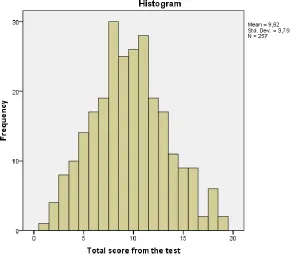
Figure 2. Distribution of the total scores from the test.
Each of the children had solved at least one item; nobody has solved all of them. The most difficult items happen to be item 18 with proportionally 0.23 right answers, the easiest one – item 14 with 0.82 right answers. Figure 3 represents the distribution of the proportion of right answers among the items.
Page 96
The Alpha of Cronbach is 0.719. This result point to relatively good internal consistency. Putting all these results together, we may conclude that the test is balanced enough – the answers are almost normally distributed, there are not any extremely difficult or easy questions; the population is well covered by the test; the internal consistency is good enough.
Performing factor analysis with non-fixed number of factors by a principle-component method, seven factors with eigenvalues larger than 1 were extracted. They explained totally 54.313% of the variance. After a Varimax rotation, we find out that the first factor is related mainly with the items 11-15 (domain Geometry) but also the first four (domain Numbers); the second one – with items 17-20 (domain Relationships of mathematics to the real world); the next factors were related mainly to specific items from different domains that could not be interpreted. Thus, we repeated the factor analysis, this time with fixed four number of factors, as initially the test was designed. The total variance explained was 37.656% but the first factor only explained 17.029% of it. The eigenvalue for the first factor was 3.406.
Thus, we may conclude that the test do not reflect the separation onto four domains that follow the curriculum and that was initially used for designing the test. Instead, it seems that the test is much more uni-dimensional and measures latent characteristic that is common for all types of mathematical tasks.
Validity of the test
We tested the construct validity of the test by calculating the correlational coefficients between the total test result and various other measures. It was moderately positively correlated with the total score from the standard mathematical test (r=0.564, p<0.001), as well with all its parts (r=0.503, p<0.001 for the part Numbers; r=0.572, p<0.001 for the part Algebra; r=0.523, p<0.001 for the part Geometry; and r=0.463, p<0.001 for the part Text tasks).
The test results were not correlated with the two parts about mathematical dictionary from the standard test (respectively, r=0.097, p=0.122 and r=0.013, p=0.835), nor with the number of absences from school (r=0.072, p=0.296).
Surprisingly, there were very small significant correlations between the test result and the grade in mathematics (r=0.281, p<0.001) of the children. This is an additional evidence that maybe the standard tests measure how well the students could apply concrete algorithms to concrete tasks but not how deep their knowledge is.
Finally, we tested some predictions about the test results of different groups of children:
The type of populated place significantly influences the results from the test: F(10, 229)=9.191, p<0.001, with much higher results in Sofia than the other towns and villages.
The gender, as expected, did not influence significantly the results: t(255)=0.387, p=0.182.
The type of education almost significantly results in a difference in main results from the test: t(255) = -1.829, p=0.069 in favor of the JumpMath educational system, as expected.
4. CONCLUSION
Page 97
The results from this initial testing support the usability of the test. The distribution of the results was almost normal with mean close to the middle. The test results cover well the population, meaning that nor floor neither ceiling effects was observed, about both the total test results and the separate items. The test is useful also in terms that is not much time consuming and the results can be obtained easily. It seems that the test has a good internal consistency. In addition, it seems that although it captures different domains from mathematics, the latent variable behind it is unidimensional. With other words, the ability to understand in deep structured manner is not much dependent on the concrete domain of studying.
Finally, the test demonstrates good construct validity, capturing the predicted correlations with other measurements and registering the predicted differences between specific groups of children.
ACKNOWLEDGMENTS
This work was financially supported by the Institute for Progressive Education, Bulgaria, by the program Jump Math Bulgaria.
REFERENCES
Brown, A.L., & Kane, M.J. (1988). Preschool children can learn to transfer: Learning to learn and learning by example. Cognitive Psychology, 20, 493-523.
Chi, M., Feltovich, P., Glaser, R. (1981). Categorization and representation of physical problems by experts and novices. Cognitive science, 5, 121-152.
Day, S. & Gentner, D. (2007). Nonintentional analogical inference in text comprehension. Memory and Cognition, 35, 39-49.
Dunbar, K. (1997). How scientists think: Online creativity and conceptual change in science. In T.B. Ward, S.M. Smith, & S.Vaid (Eds.) Conceptual structures and processes: Emergence, discovery and Change. APA Press. Washington DC.
Gentner, D. & Smith, L. (2012). Analogical reasoning. In V. S. Ramachandran (Ed.) Encyclopedia of Human Behavior (2nd Ed.). pp. 130-136. Oxford, UK: Elsevier.
Gentner, D. (1983). Structure – mapping: A theoretical framework for analogy. Cognitive Science, 7, 155-170.
Gentner, D. (2003). Why we're so smart. In D. Gentner and S. Goldin-Meadow (Eds.), Language in mind: Advances in the study of language and thought, pp.195-235. Cambridge, MA: MIT Press.
Gentner, D. (2010). Bootstrapping the mind: Analogical processes and symbol system. Cognitive Science, 34 (5), 752-775.
Gentner, D., & Smith, L. A. (2013). Analogical learning and reasoning. In D. Reisberg (Ed.), The Oxford handbook of Cognitive Psychology, pp. 668-681. New York, NY: Oxford University Press.
Gentner, D., Ratermann, M. (1991). Language and the career of similarity. In; S.A. Gelman & J. P. Byrnes (Eds.): Perspectives on thought and language: interrelations in development (pp. 257-277). London: Cambridge University Press.
Goldwater, M. B., & Gentner, D. (2015). On the acquisition of abstract knowledge: Structural alignment and explication in learning causal system categories. Cognition, 137, 137-153.
Goswami, U. (1992). Analogical Reasoning in Children. Hillsdale, NJ: Lawrence Erlbaum Associates.
Page 98
Halford, G.S., Wilson, W.H. & Phillips, S., (2010). Relational knowledge: The foundation of higher cognition. Trends in Cognitive Sciences, 14(11), 497-505.
Hay, D. B., Williams, D., Stahl, D., & Wingate, R. J. (2013). Using drawings of the brain cell to exhibit expertise in neuroscience: exploring the boundaries of experimental culture. Science Education, 97(3), 468–491.
Hofstadter, D. R. (2001). Analogy as the Core of Cognition. In: Gentner, D., Holyoak, K., Kokinov, B., eds. The Analogical Mind: Perspectives from Cognitive Science. Cambridge, MA: MIT Press. Hofstadter, D. R. and the Fluid Analogies Research Group (Eds.) (1995). Fluid Concepts and Creative Analogies. New York: Basic Books.
Jee, B. D., & Wiley, J. (2007). How goals affect the organization and use of domain knowledge. Memory and Cognition, 35, 837–851.
Jee, B., Gentner, D., Uttal, D., Sageman, B., Forbus, K., Manduca, C., Ormand, C., Shipley, T., & Tikoff, B. (2014). Drawing on experience: How domain knowledge is reflected in sketches of scientific structures and processes. Research in Science Education, 44(6), 859-883.
Kindfield, A. C. H. (1992). Expert diagrammatic reasoning in biology. In AAAI Symposium on
Reasoning with Diagrammatic Representations I, Stanford University.
Кокинов, Б. (2004). AMBR1: Един хибриден модел на човешките разсъждения по аналогия. Дисертация, ВАК, София.
Kokinov, B. & French, R. M. (2003). Computational models of analogy-making. Encyclopedia of cognitive science, 1, 113-118.
Kokinov, B. & French, R. M. (2003). Computational models of analogy-making. Encyclopedia of cognitive science, 1, 113-118.
Lowe, R. K. (1993). Constructing a mental representation from an abstract technical diagram. Learning and Instruction, 3, 157–179.
Markman, A., & Wood, K. (2009). Tools for innovation: The science behind practical methods that drive new ideas. New York: Oxford University Press.
Mighton, J (2003). Jump Math България, цитирано от Институт за прогресивно образование, http://www.progresivno.org/jump-math/
Nersessian, N. J. (1988). Reasoning from imagery and analogy in scientific concept formation. In PSA: Proceedings of the Biennial Meeting of the Philosophy of Science Association (pp. 41-47). Chicago: University of Chicago Press.
Pauen, S., & Wilkeining, F. (1997). Children’s analogical reasoning about natural phenomena. Journal of Experimental Child Psychology, 67, 90-113.
Penn, D. C. and D. J. Povinelli (2012). The Human Enigma. In: The Oxford Handbook of Thinking and Reasoning. K. J. Holyoak and R. G. Morrison. Oxford University Press.
Penn., D.C., Holyoak, K.J., & Povinelli, D.J. (2008). Darwin’s mistake: explaining the discontinuity between human and nonhuman minds. Behavioral and Brain Sciences, 31 (2), 109-130.
Petkov, G., Vankov, I., Kokinov, B. (2011). Deduction, Induction, and Analogy Modeled by the Same Mechanisms. In: Proceedings of the 33rd Annual Conference of the Cognitive Science Society, Hillsdale, N.J.: Erlbaum.
Rottman, B. M., Gentner, D. & Goldwater, M. B. (2012). Causal systems categories: Differences in novice and expert categorization of causal phenomena. Cognitive Science, 36(5), 919-932.
Page 99